
South32 Shareholders to Receive Alcoa Shares in $5.6B Sale
30 mins ago

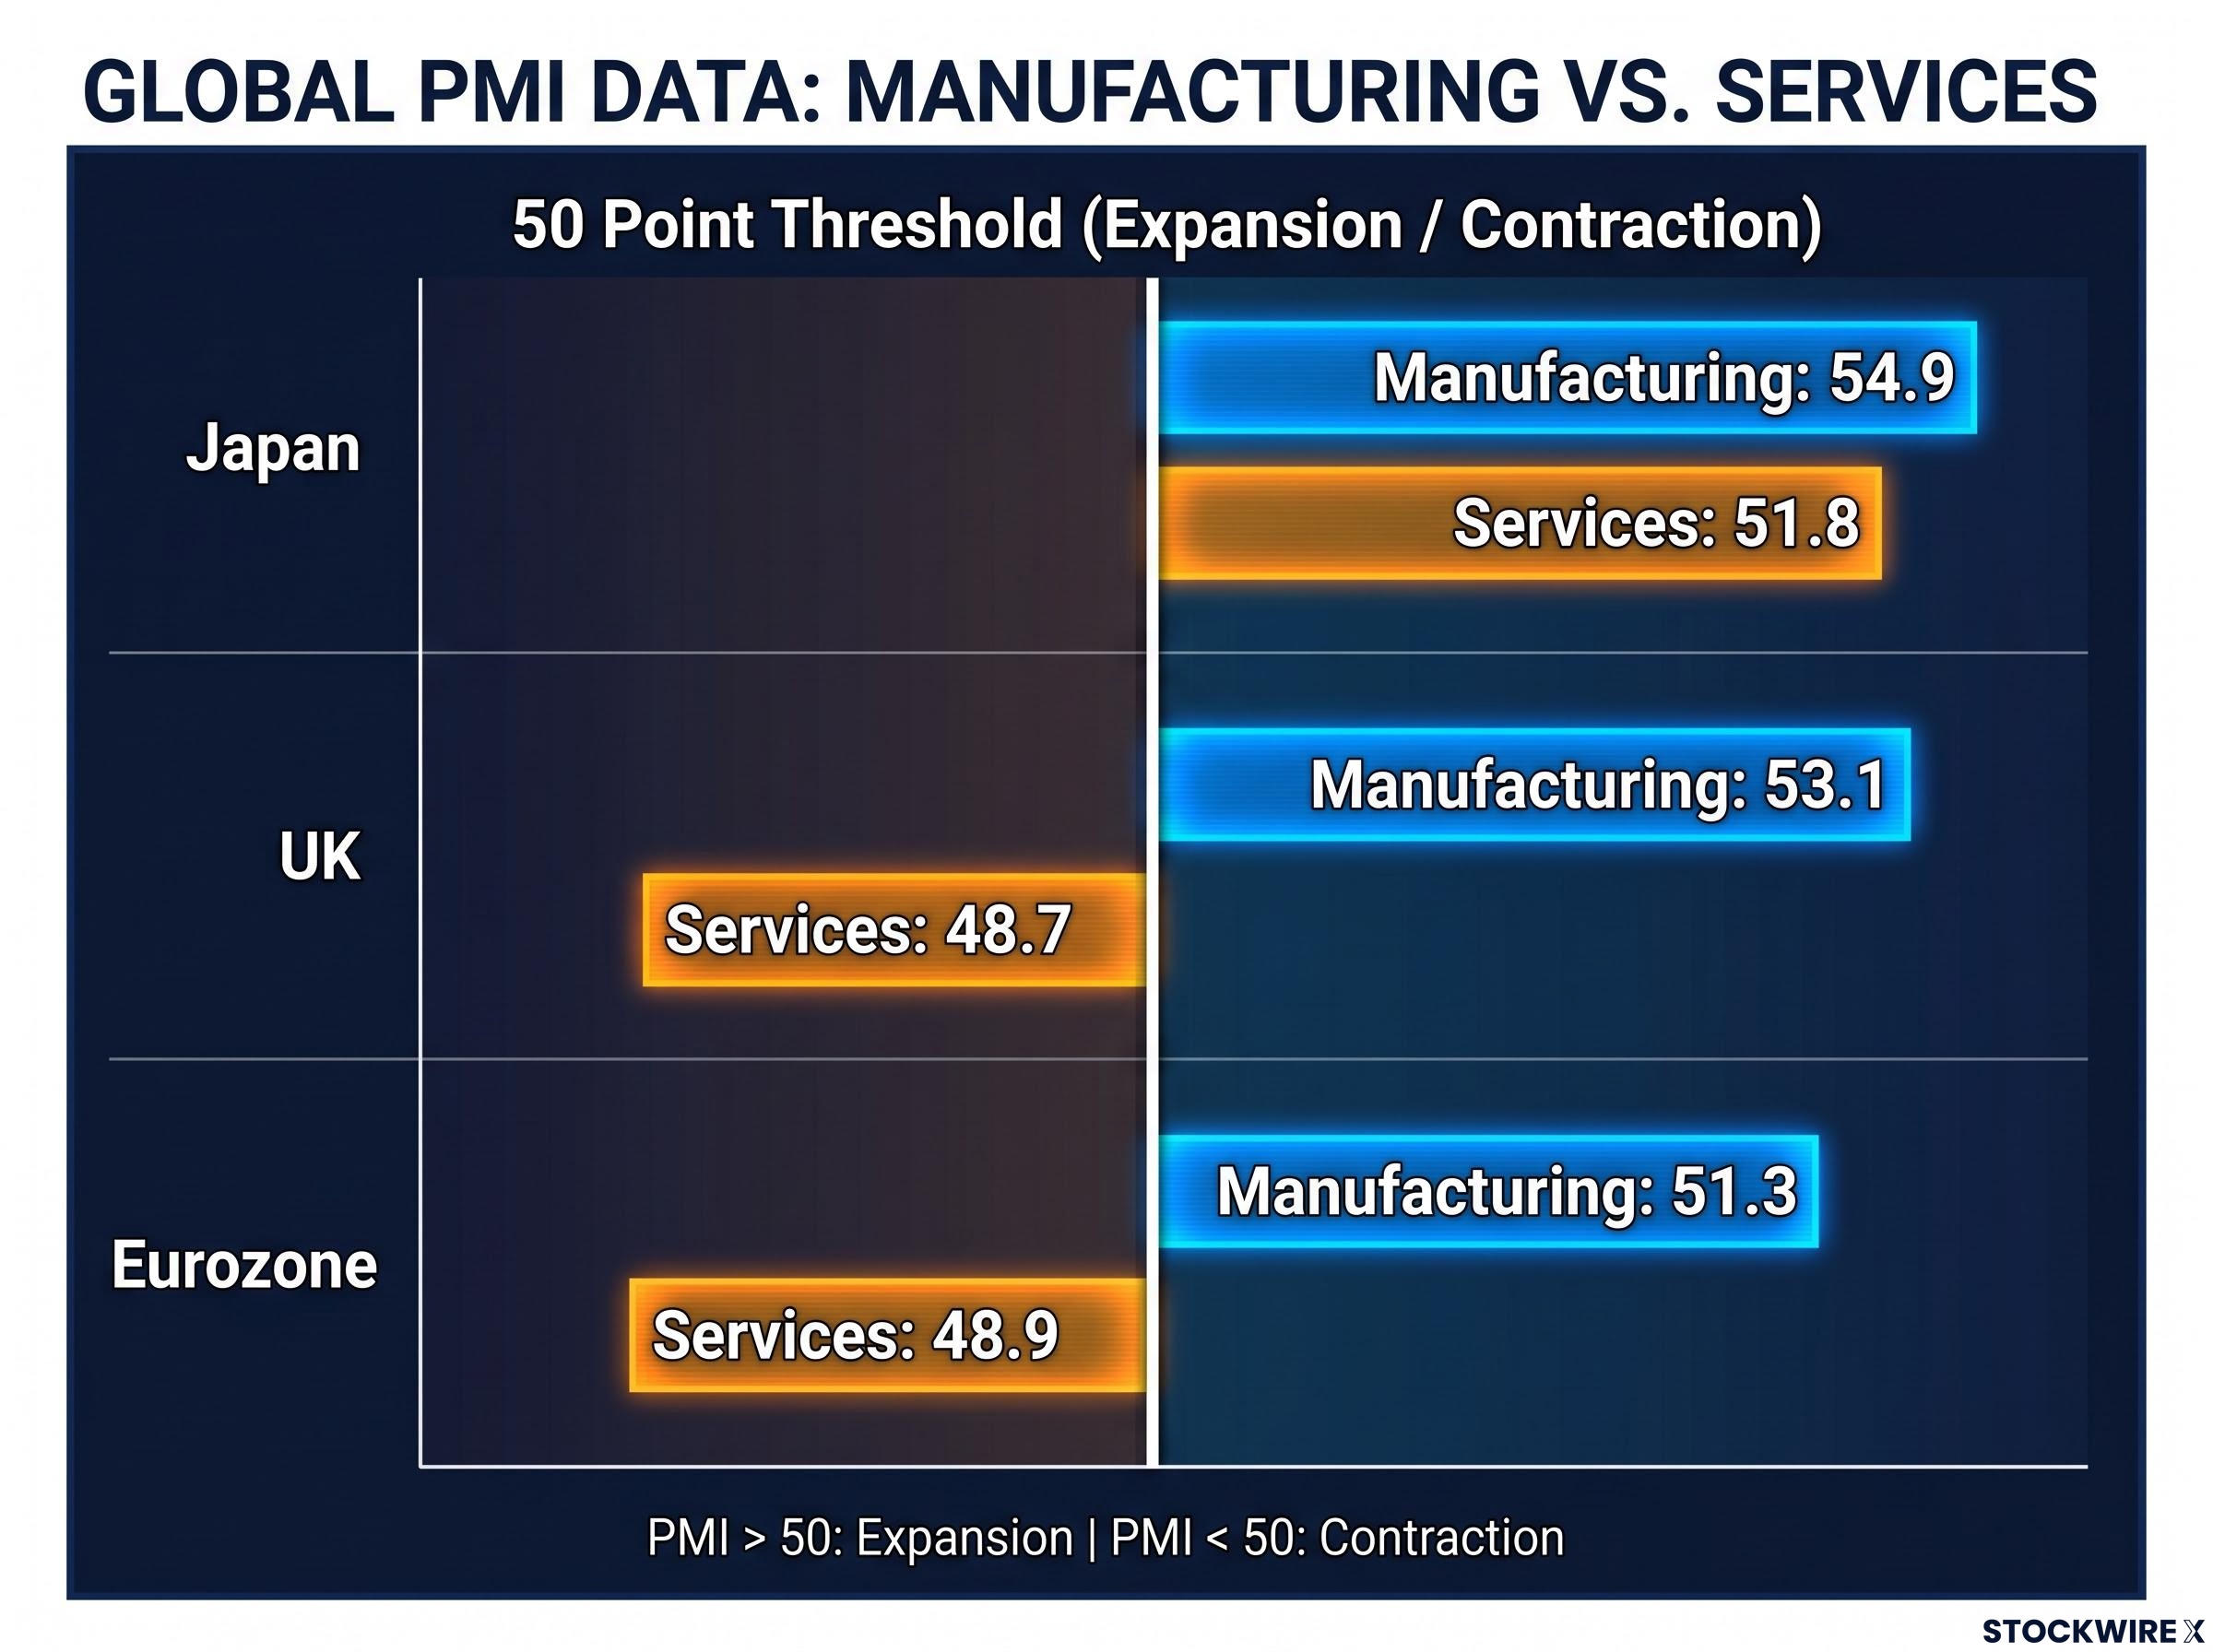
Japan’s manufacturing PMI hit 54.9 in the June 2026 flash release, its strongest reading in three months, while both the UK and eurozone saw their services sectors slip below the 50-point contraction line simultaneously. The divergence is the sharpest in the S&P Global dataset this year.
This matters because the June flash PMI is the first major activity signal for the second half of 2026. It lands at a moment when investors are recalibrating regional exposure and reassessing central bank trajectories across three of the world’s largest developed-market blocs. Flash estimates carry revision risk, but they move markets and shift positioning before hard data arrives.
Here is what the June data tells you about which economies carry genuine momentum heading into H2 2026, which are showing early stress signals, and what the gap between them means for anyone thinking about international allocation right now.
The numbers tell the story in layers. Start with the headline readings from S&P Global’s June flash release:
Manufacturing at 54.9 is not just above 50. It reflects accelerating momentum, with output and new orders both climbing.
“New orders grew at their fastest pace in more than four years.”
That order growth matters because it is forward-looking. Orders placed now feed production pipelines for the coming months, which means the expansion has not yet peaked on its own terms.
Then layer in the trade data. Exports rising 16.8% tells you global demand for Japanese goods is strong. Imports climbing 12.5% tells you domestic demand is pulling in foreign goods at the same time. When both sides of the trade ledger are rising simultaneously, the expansion is not a single-engine story. Both the global and domestic sides of Japan’s economy are pulling in the same direction at once, a qualitatively different signal from an export-only recovery that could stall the moment external demand softens.
Japan’s private-sector growth composition in Q1 2026 matters for interpreting the June PMI signal: exports contributed the largest single demand component while private consumption showed genuine fragility, meaning the manufacturing order surge visible in the June data sits within an economy where domestic spending has not yet fully validated the export-led expansion.
A Purchasing Managers’ Index, or PMI, is a diffusion index. It surveys business managers across an economy and measures the share of respondents reporting improvement versus deterioration. A reading of 50 is the dividing line: above 50 means more businesses are expanding than contracting, below 50 means the opposite.
The distance from 50 reflects the pace of change, not an absolute level of activity. A reading of 48.7 does not mean the economy has shrunk by 1.3%. It means a modest majority of surveyed businesses reported worsening conditions compared with the previous month.
That distinction matters most in the services sector. Services account for roughly 80% of UK economic output, which makes a sub-50 services reading disproportionately significant compared with manufacturing weakness.
“Services account for roughly 80% of UK economic output, making a sub-50 services PMI the more consequential of the two readings.”
The June flash readings landed at 48.7 for UK services and 48.9 for eurozone services. Both are below the contraction threshold, and both are preliminary estimates subject to revision when final readings release.
A services PMI of 48.7 does not mean the UK economy is collapsing. It means the dominant sector is contracting modestly. If that reading persists for two to three consecutive months, it shifts from a soft patch to a trend that changes the growth outlook for the second half of 2026.
PMI false recession signals occur in roughly 30-40% of sub-50 episodes across advanced economies, a base rate that matters when translating the UK and eurozone services readings into a growth outlook rather than a binary contraction verdict.
Neither the UK nor the eurozone picture is uniformly weak. UK manufacturing came in at 53.1 and eurozone manufacturing at 51.3, both in expansion territory. Factory activity is holding up.
| Economy | Manufacturing PMI | Services PMI |
|---|---|---|
| Japan | 54.9 (expansion) | 51.8 (expansion) |
| UK | 53.1 (expansion) | 48.7 (contraction) |
| Eurozone | 51.3 (expansion) | 48.9 (contraction) |
The table shows genuine manufacturing resilience. But three factors explain why it does not cancel out the services drag:
The European picture is weaker than headline manufacturing numbers first suggest. A reader evaluating European exposure needs to price in both the services contraction and the manufacturing disappointment relative to forecasts before forming a view.
The data layer is clear. The question is what you do with it.
Equities:
Fixed income:
The Bank of Japan June 2026 policy statement confirms the central bank’s intention to continue raising the policy interest rate and adjusting the degree of monetary accommodation in response to evolving economic and price conditions, a posture that adds further weight to the yen case if Japan’s growth momentum persists.
FX:
Consider a Japan overweight relative to Europe in growth-sensitive allocations, with duration flexibility maintained on BoE and ECB exposure.
The same data point that confirms Japan’s domestic demand strength, the import surge, also introduces an input-cost headwind. A simple “Japan wins, short Europe” positioning is incomplete without risk management on the yen side.
The Japan outperformance signal is real. The margin between a durable thesis and a one-month story is thinner than the headline numbers suggest.
Input costs are the first risk. The June PMI detail cites energy, fuel, and raw materials costs linked to Middle East conflict pressures. If companies cannot pass those costs through via pricing power, rising inputs compress margins and eventually weigh on real incomes. Strong orders do not guarantee strong profits.
Flash estimate revision risk is the second. Every figure cited in this article is preliminary. Final PMI readings can move materially from the flash, and investment conclusions should be treated as directional rather than definitive until confirmation arrives.
Single-datapoint risk in Europe is the third. One month of sub-50 services readings in the UK and eurozone does not confirm a trend. A single-month soft patch that reverses in July would undermine the entire divergence narrative.
May 2026 cross-bloc PMI readings showed the eurozone composite hitting a 31-month low at 47.5, giving the June flash data an important comparison point: the services contraction now visible in the UK and eurozone is not a one-month anomaly but a signal that has been building across consecutive survey periods.
Confirmation from final readings and July hard data is what converts a directional signal into actionable conviction.
Japan is the current cyclical leader among the three blocs covered, with breadth across manufacturing, services, and trade. The UK and eurozone present a split reading: manufacturing is holding up, but services are under pressure, and both readings missed expectations.
The April PMI divergence across the same three blocs showed a similar pattern, with Japan’s manufacturing at 55.1 and eurozone services collapsing to 47.4, providing an earlier read on whether the June gap reflects an accelerating structural split or a continuation of a trend that has been building since Q2 2026 began.
Flash PMI data is a leading indicator, not a lagging confirmation. That is both its value and its limitation.
The narrative set by this June release will be tested against final PMI readings and subsequent July hard data. That confirmation sequence is what determines whether this divergence is a structural signal or a single-month observation. For anyone making allocation decisions heading into the second half of 2026, the direction is clear; the durability is not yet proven.
This article is for informational purposes only and should not be considered financial advice. Investors should conduct their own research and consult with financial professionals before making investment decisions. All PMI figures cited are flash estimates subject to revision. Past performance does not guarantee future results.
A flash PMI is a preliminary estimate of purchasing managers survey data released before the final reading, typically based on around 85% of total responses. Flash estimates move markets and shift positioning immediately, but they carry revision risk, meaning final readings can differ materially from the initial figures.
A services PMI below 50 means more businesses in the sector reported worsening conditions than improving ones compared to the previous month. Since services account for roughly 80% of UK economic output, a sub-50 reading is disproportionately significant; if it persists for two to three consecutive months, it shifts from a soft patch to a trend that changes the H2 2026 growth outlook.
Japan's manufacturing PMI of 54.9 is the strongest three-month print and reflects accelerating momentum, with new orders growing at their fastest pace in more than four years. Combined with exports up 16.8% year-on-year and imports rising 12.5%, the expansion is a two-sided story driven by both global demand for Japanese goods and domestic demand pulling in foreign goods simultaneously.
The growth gap tilts fundamentals in favour of the yen versus sterling and the euro, particularly if Bank of Japan policy normalisation continues while the Bank of England and ECB turn more growth-sensitive. Japan's import surge of 12.5% year-on-year complicates a straightforward yen-bullish read, since rising imports increase demand for foreign currency and energy-linked input costs add further complexity.
Three confirmation signals matter: final June PMI readings for Japan, the UK, and the eurozone will show whether the flash divergence holds; July hard data including retail sales, industrial production, and labour market prints will test whether survey signals translate into real activity; and central bank commentary from the BoJ, BoE, and ECB will reveal whether policymakers are adjusting rate trajectories in response to the same divergence.