Is Inflation Coming Back? What the June Data Actually Shows
1 hr ago
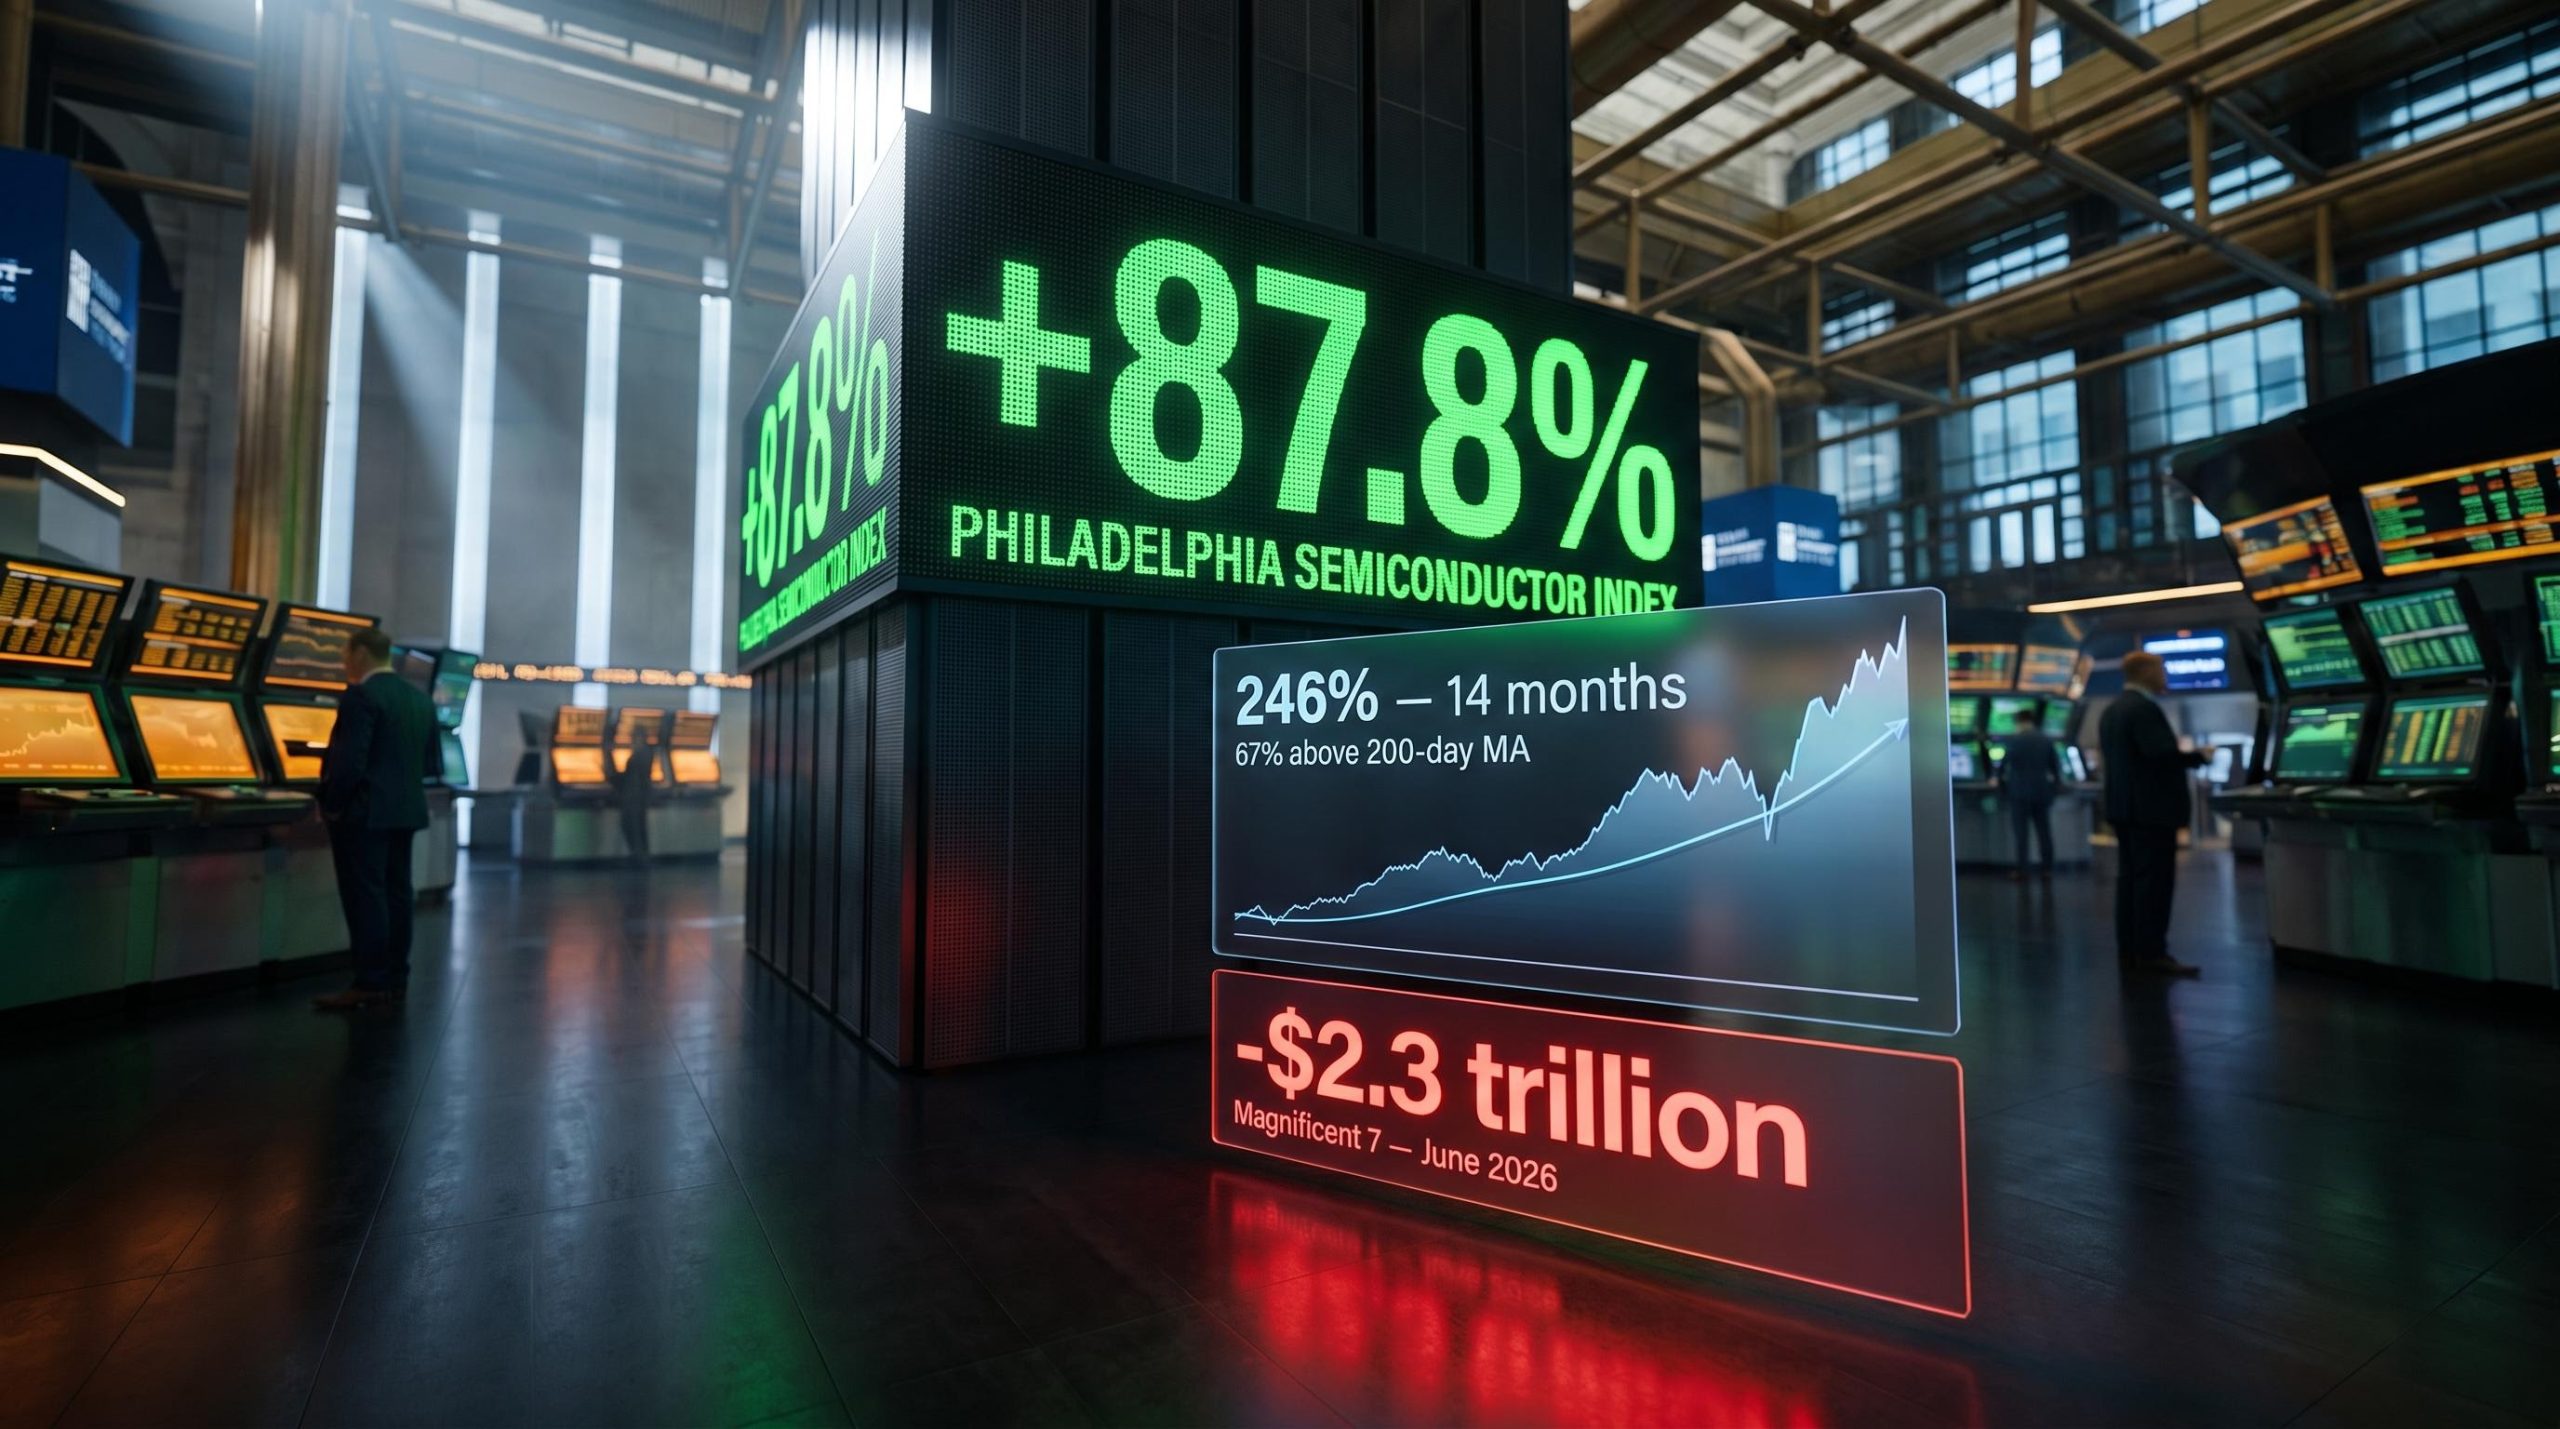
The Philadelphia Semiconductor Index (SOX) recorded an 87.8% gain across the second quarter, a return not surpassed since the index began trading in 1993. In that same quarter’s final month, the Magnificent 7 collectively shed approximately $2.3 trillion in market value, a decline attributed to investor concerns about the scale of AI capital expenditure and uncertainty over returns. Those two facts belong to the same market, and the tension between them is the story.
The SOX’s Q2 2026 performance is not an ordinary technology rally. The index has gained more than 100% year-to-date, a feat matched only once before, in 1999. Over the trailing 14 months, the move is approximately 246%, exceeding the dot-com peak in magnitude, and the index now trades roughly 67% above its 200-day moving average, one of the largest such dislocations on record for the sector.
Here is what the data actually tells you about where semiconductor stocks sit right now: what is structurally real, what may be priced ahead of itself, and how to frame exposure when a sector’s fundamentals and its valuations are telling two different stories.
Start with the broad market. For the full quarter, the Nasdaq returned 21.41%, the Russell 2000 returned 21.15%, the S&P 500 returned 14.87%, and the Dow returned 12.90%, collectively marking the strongest quarter for US equities since 2020. A rising tide.
Then the SOX. An 87.8% quarterly gain is not outperformance; it is a different category of move entirely, more than four times the Nasdaq’s return in the same period. The index closed Q2 near 14,247, against a 52-week range of 5,418 to 14,655. The Semiconductor ETF finished the first session of the new quarter up 4.30%.
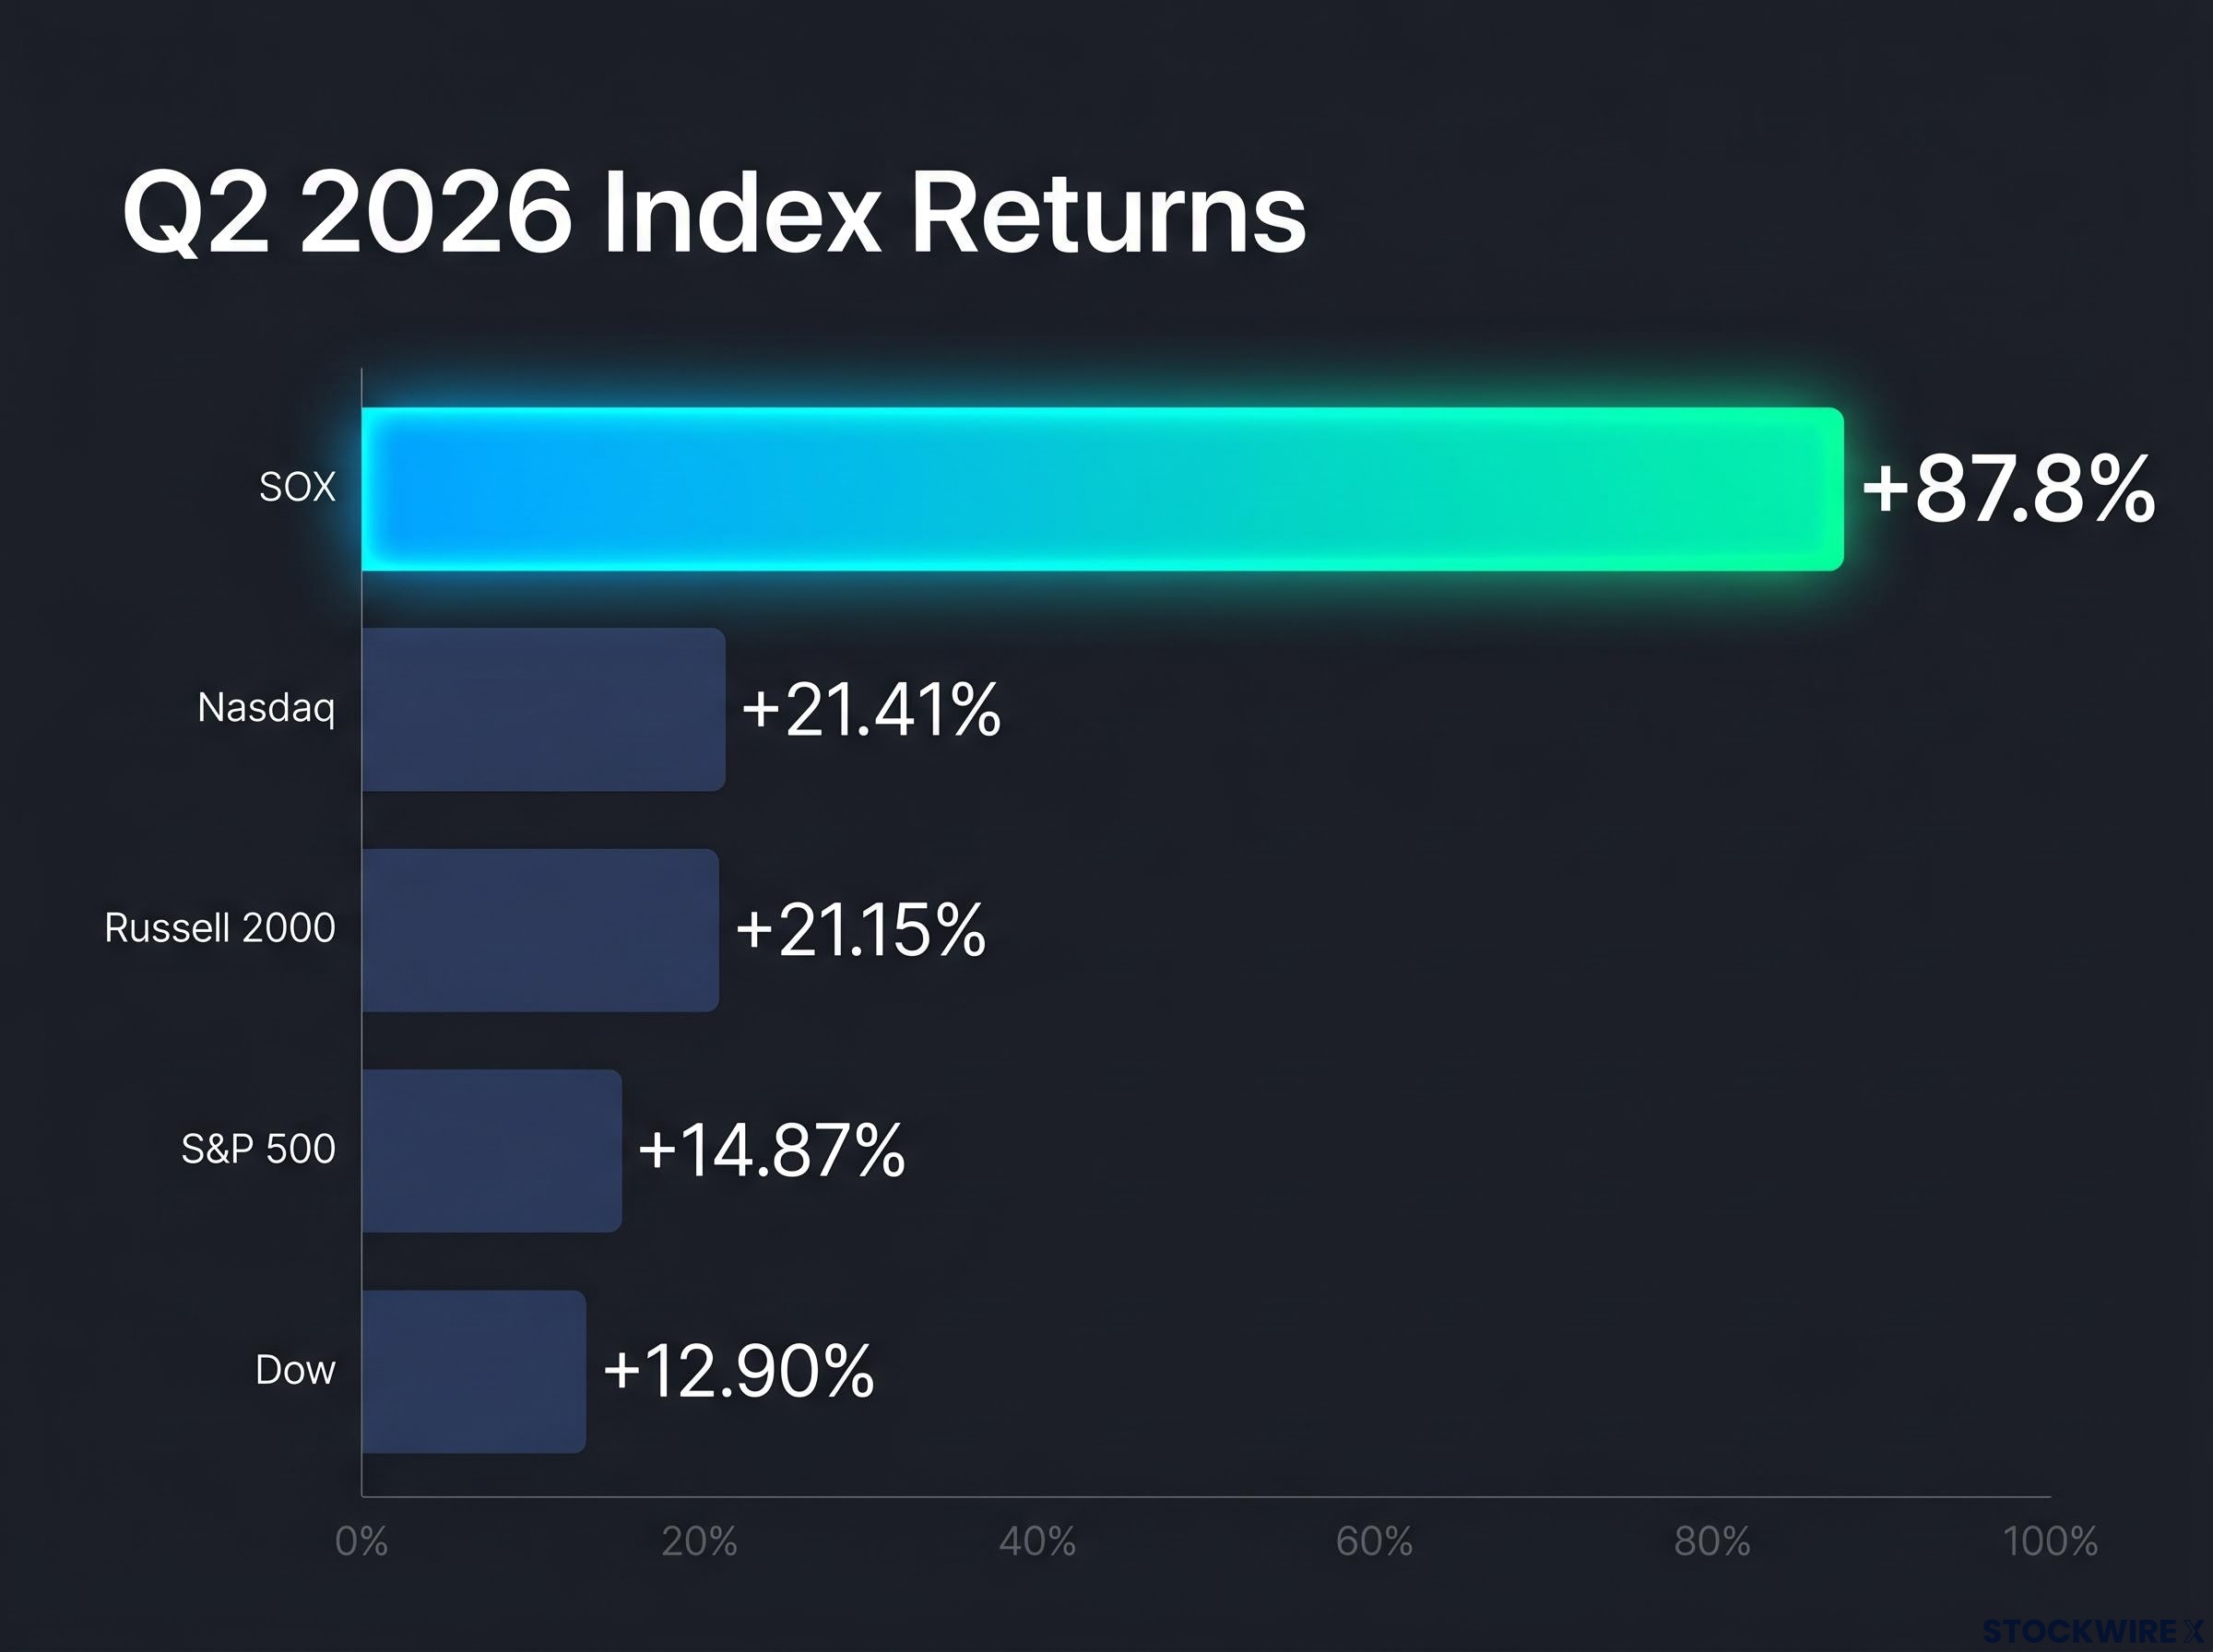
| Index / Asset | Q2 2026 Return |
|---|---|
| SOX (Philadelphia Semiconductor Index) | +87.8% |
| Nasdaq Composite | +21.41% |
| Russell 2000 | +21.15% |
| S&P 500 | +14.87% |
| Dow Jones Industrial Average | +12.90% |
The multi-period picture sharpens the historical rarity:
The only prior year in which the SOX gained more than 100% year-to-date was 1999. The comparison set for this rally is not “strong technology years.” It is the last 12 months before the dot-com crash.
The most concrete demand driver is contractual. Hyperscalers including Microsoft, Amazon, Alphabet, and Meta have committed to multi-year AI infrastructure investment plans that translate directly into purchase orders, long-term supply agreements, and capacity reservations for SOX constituents. This is not aspirational revenue. A large portion of current semiconductor demand is tied to real capital expenditure plans, providing revenue visibility that earlier chip cycles lacked.
That distinction matters. Contractual purchase orders and supply agreements are a materially different demand signal than analyst projections about future AI adoption. When you assess how durable this revenue backdrop actually is, the question is whether the capex commitments hold, not whether analysts’ models are right.
The hyperscaler capex commitments underpinning the SOX rally are not projections; Amazon, Microsoft, Alphabet, and Meta spent $130 billion in Q1 2026 alone, with full-year 2026 combined guidance reaching approximately $725 billion and a $1 trillion annual run rate targeted for 2027.
Three forces built the rally, and they are not equal:
That third point deserves emphasis. When a handful of very large, very AI-exposed names carry a 30-stock index, the headline return reflects their performance far more than the sector’s health overall. The rally is real, but it is not evenly distributed.
The SOX index methodology confirms the index’s inception on 1 December 1993, with a modified market-cap-weighted structure across 30 constituents, a design that concentrates returns in the largest AI-exposed names and amplifies headline performance when those names surge.
All seven Magnificent 7 companies posted losses in June 2026. The group collectively shed approximately $2.3 trillion in market value, even as the SOX delivered its strongest quarter on record.
“The Magnificent 7 collectively shed approximately $2.3 trillion in market value in June 2026, even as the SOX posted its strongest quarter since 1993.”
Among the steepest monthly drops within the group:
June’s monthly returns for the broader indices showed the S&P 500 down 1.06% and the Nasdaq down 2.81%. The megacap selloff was not a sector-wide event. It was targeted.
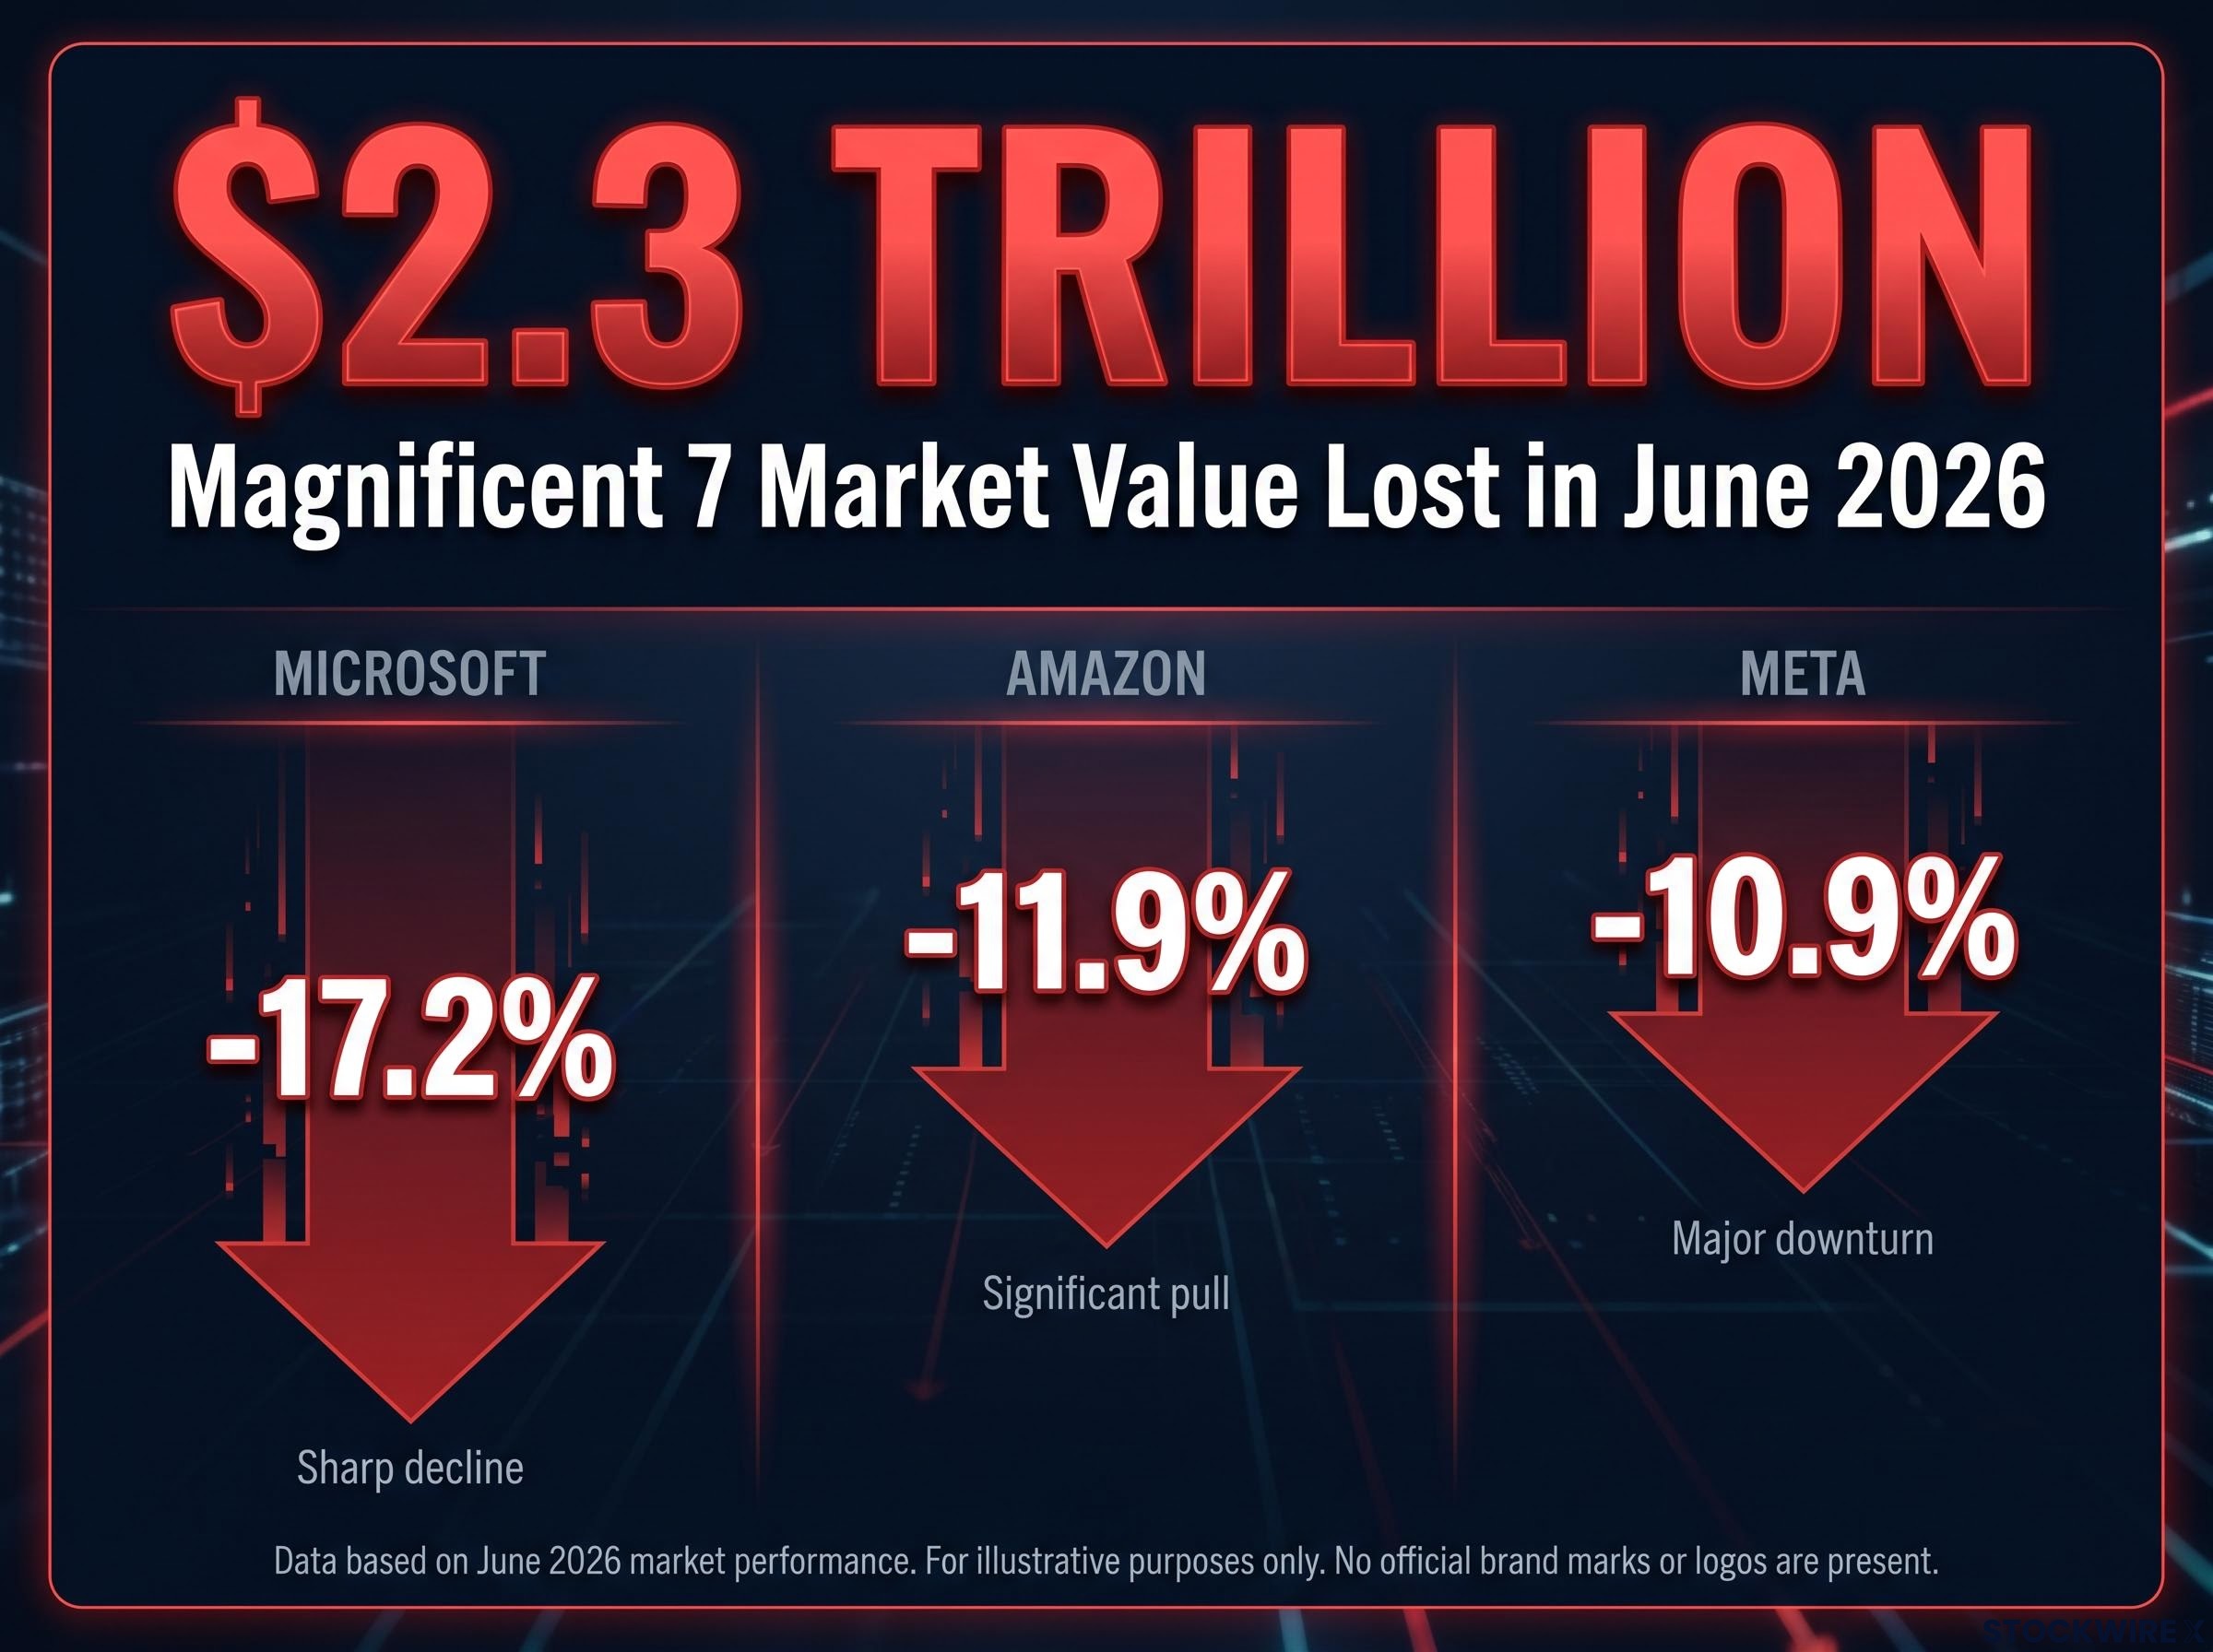
The Financial Times and Reuters attributed the losses to investor concerns about the scale of AI capital expenditure commitments and uncertainty over the return on that spending. Capital appears to have rotated from large-cap technology platforms toward pure-play semiconductor names perceived as more direct beneficiaries of AI infrastructure spending, rather than both groups rising together.
Magnificent Seven underperformance in 2026 reflects four converging headwinds identified by Deutsche Bank strategist Jim Reid: extreme crowded positioning, a shift from AI capex enthusiasm to a credibility test, a more hawkish Federal Reserve compressing growth multiples, and rising chip costs squeezing platform company margins, each of which operates independently of the SOX rally.
When the companies spending the most on AI infrastructure sell off sharply, it signals that investors are beginning to question whether the capex cycle will produce returns proportionate to its scale. That is precisely the risk sitting underneath every semiconductor revenue projection tied to hyperscaler orders. The SOX rally and the AI mega-platform thesis are not the same trade, and conflating them is a source of real portfolio risk.
The SOX is trading approximately 67% above its 200-day moving average as of 30 June 2026, one of the largest such dislocations on record for the sector.
The 200-day moving average is a proxy for medium-term consensus value: the average price investors have been willing to pay over the prior 200 trading sessions. Trading 67% above it means price has outrun the underlying growth rate of the business for an extended period.
The 1999 parallel is not alarmism; it is a framing tool for probability. The only prior year with a 100%-plus year-to-date gain in the SOX was 1999. Creative Planning’s analysis of the 246% 14-month move explicitly frames it as exceeding the dot-com peak in magnitude. Yahoo Finance and broader market commentary have used bubble-adjacent descriptors.
At current prices, investors are paying for a specific set of forward assumptions:
The counterpoint is real: secular demand for semiconductors across AI, cloud, and edge compute is genuine and multi-year. But real secular demand does not prevent overextension from correcting.
Semiconductor earnings revisions of more than 20% in 2026, combined with active long-only overweight positioning at roughly half the 2017 cycle peak, form the core of the bull case that the current valuation premium reflects genuine fundamental support rather than speculative excess alone.
Trading 67% above the 200-day moving average does not predict when or by how much prices will correct. What it tells you is that the margin for disappointment is unusually thin. Even a modest miss on earnings, capex, or AI adoption timelines could trigger an outsized price response.
The cap-weighted S&P 500 gained 0.79% on 1 July 2026 while its equal-weighted counterpart fell 0.13%, a spread of 92 basis points separating the two versions of the same index on one of the market’s strongest days.
“On 1 July 2026, the equal-weighted S&P 500 fell 0.13% while the cap-weighted version rose 0.79%. Ninety-two basis points separated the two on one of the market’s strongest days.”
When equal-weighted indices persistently lag their cap-weighted equivalents, it signals that a small number of large names are carrying the index. The rally is narrower than the headline suggests.
Index concentration risk in US markets had reached historic extremes well before Q2 2026, with five mega-cap stocks controlling approximately 23% of the broad market index and delivering more than half of April’s recovery after driving roughly 70% of Q1’s decline, a pattern that makes the equal-weighted versus cap-weighted spread a more revealing signal than headline index returns.
The SOX has the same structural feature. Its 30 constituents span very different businesses:
On 1 July, the same rotation was visible in sector performance: Healthcare, Staples, Utilities, and Real Estate all finished the session lower by more than 1%, with Real Estate the weakest of the group at -2.19%, while Information Technology topped the leaderboard at +2.55%.
The 92 basis point gap between equal-weighted and cap-weighted performance on a single strong session is a measurable proxy for how narrow leadership has become. Narrow leadership historically amplifies drawdown risk when the leading names stumble. A strong SOX headline does not mean every constituent is attractively valued or equally protected by AI tailwinds.
The core tension is clear. Secular demand for semiconductors is structurally real and multi-year, but current pricing appears to embed a substantial portion of that good news up front, leaving limited margin for error.
Five orienting principles help frame the decision:
The Magnificent 7’s June selloff is the live example. The market reassessed AI capex return assumptions in a matter of weeks, shedding $2.3 trillion in market value from the companies funding the very infrastructure chip investors are pricing in. Position sizing and time horizon alignment matter more in historically overextended markets than in normally valued ones.
This article is for informational purposes only and should not be considered financial advice. Investors should conduct their own research and consult with financial professionals before making investment decisions.
This rally has two competing forces, and both are real. The structural AI capex story gives it genuine fundamental underpinning. The concentration, overextension, and Magnificent 7 divergence make the current configuration fragile. Resolving the tension prematurely, in either direction, is the mistake.
Three variables will tell you whether the fundamental case is holding or whether price is running ahead of it:
The 1999 parallel is not a prediction. It is the baseline for what happens when momentum and fundamentals diverge. The SOX at 67% above its 200-day moving average and 246% over 14 months has characteristics of both a legitimate secular growth cycle and a valuation overshoot.
“This rally has characteristics of both a legitimate secular growth cycle and a valuation overshoot. Those two things can coexist.”
The investor who builds a position acknowledging both is better positioned than one who picks a side before the evidence resolves.
Past performance does not guarantee future results. Financial projections are subject to market conditions and various risk factors.
The Philadelphia Semiconductor Index (SOX) is a modified market-cap-weighted index of 30 semiconductor companies, covering chip designers, foundries, memory producers, and equipment makers. It has traded since 1 December 1993 and is the primary benchmark for semiconductor stocks.
Three forces drove the SOX's 87.8% quarterly gain: real purchase commitments from hyperscalers including Microsoft, Amazon, Alphabet, and Meta (who spent $130 billion on AI infrastructure in Q1 2026 alone), a broad risk-on environment amplifying high-beta technology names, and the index's cap-weighted structure concentrating returns in a handful of large AI-exposed leaders.
The 200-day moving average represents the average price investors have paid over the prior 200 trading sessions, a proxy for medium-term consensus value. Trading 67% above it means price has outrun underlying business growth for an extended period, compressing the margin for error so that even a modest miss on earnings or AI capex could trigger a disproportionately large correction.
Investors rotated capital from large-cap AI platform companies toward pure-play semiconductor names, reassessing whether hyperscaler AI capital expenditure would generate returns proportionate to its scale. Microsoft fell 17.2%, Amazon fell 11.9%, and Meta fell 10.9% in June, reflecting a credibility test on AI return assumptions rather than a broad technology selloff.
Three signals matter most: hyperscaler AI capex guidance in upcoming earnings (any revision flows directly into chip demand forecasts), the spread between equal-weighted and cap-weighted index performance as a breadth indicator, and the measurable return on AI infrastructure spending reported by Microsoft, Amazon, Alphabet, and Meta as evidence the capex cycle is self-sustaining.