ASX 200 Flat Masks Sharp Rotation Into Defensives on Rate-Hold Bets
7 hrs ago

Brent crude fell 3.3% to $91.15 per barrel on 9 June 2026, the sharpest single-day peace-signal-driven move in oil prices since the Israel-Iran conflict began in late February. The drop came within hours of the White House signalling that a formal peace agreement with Iran could be imminent, with President Trump stating the Strait of Hormuz would reopen upon signing. After more than three months of effective closure, markets are now pricing not just a ceasefire but the potential unwinding of one of the most consequential energy supply disruptions in recent memory. What follows is a breakdown of what the Hormuz closure has done to oil prices, bond yields, and inflation expectations since February, and what investors across energy, rates, and equities should watch as a formal deal takes shape.
The diplomatic shift on 9 June was specific. President Trump stated the United States was close to finalising a peace deal with Iran, and that the Strait of Hormuz would reopen upon signing. He also claimed during a virtual rally that U.S. forces had severely degraded Iran’s military capacity and senior leadership, providing context for why a deal appears credible at this stage of the conflict.
Key developments from 9 June:
Brent crude fell 3.3% to $91.15 per barrel on 9 June 2026, while the 2-year Treasury yield moved 2 basis points lower on the same session.
The 3.3% drop reflects headline risk reduction, not a physical change in supply. No tankers moved differently on Tuesday. What changed was the probability markets assign to Hormuz reopening, and that probability shift alone was enough to trigger the largest single-session oil decline since the conflict began in late February. The question now is whether this is a one-day relief trade or the opening leg of a sustained repricing.
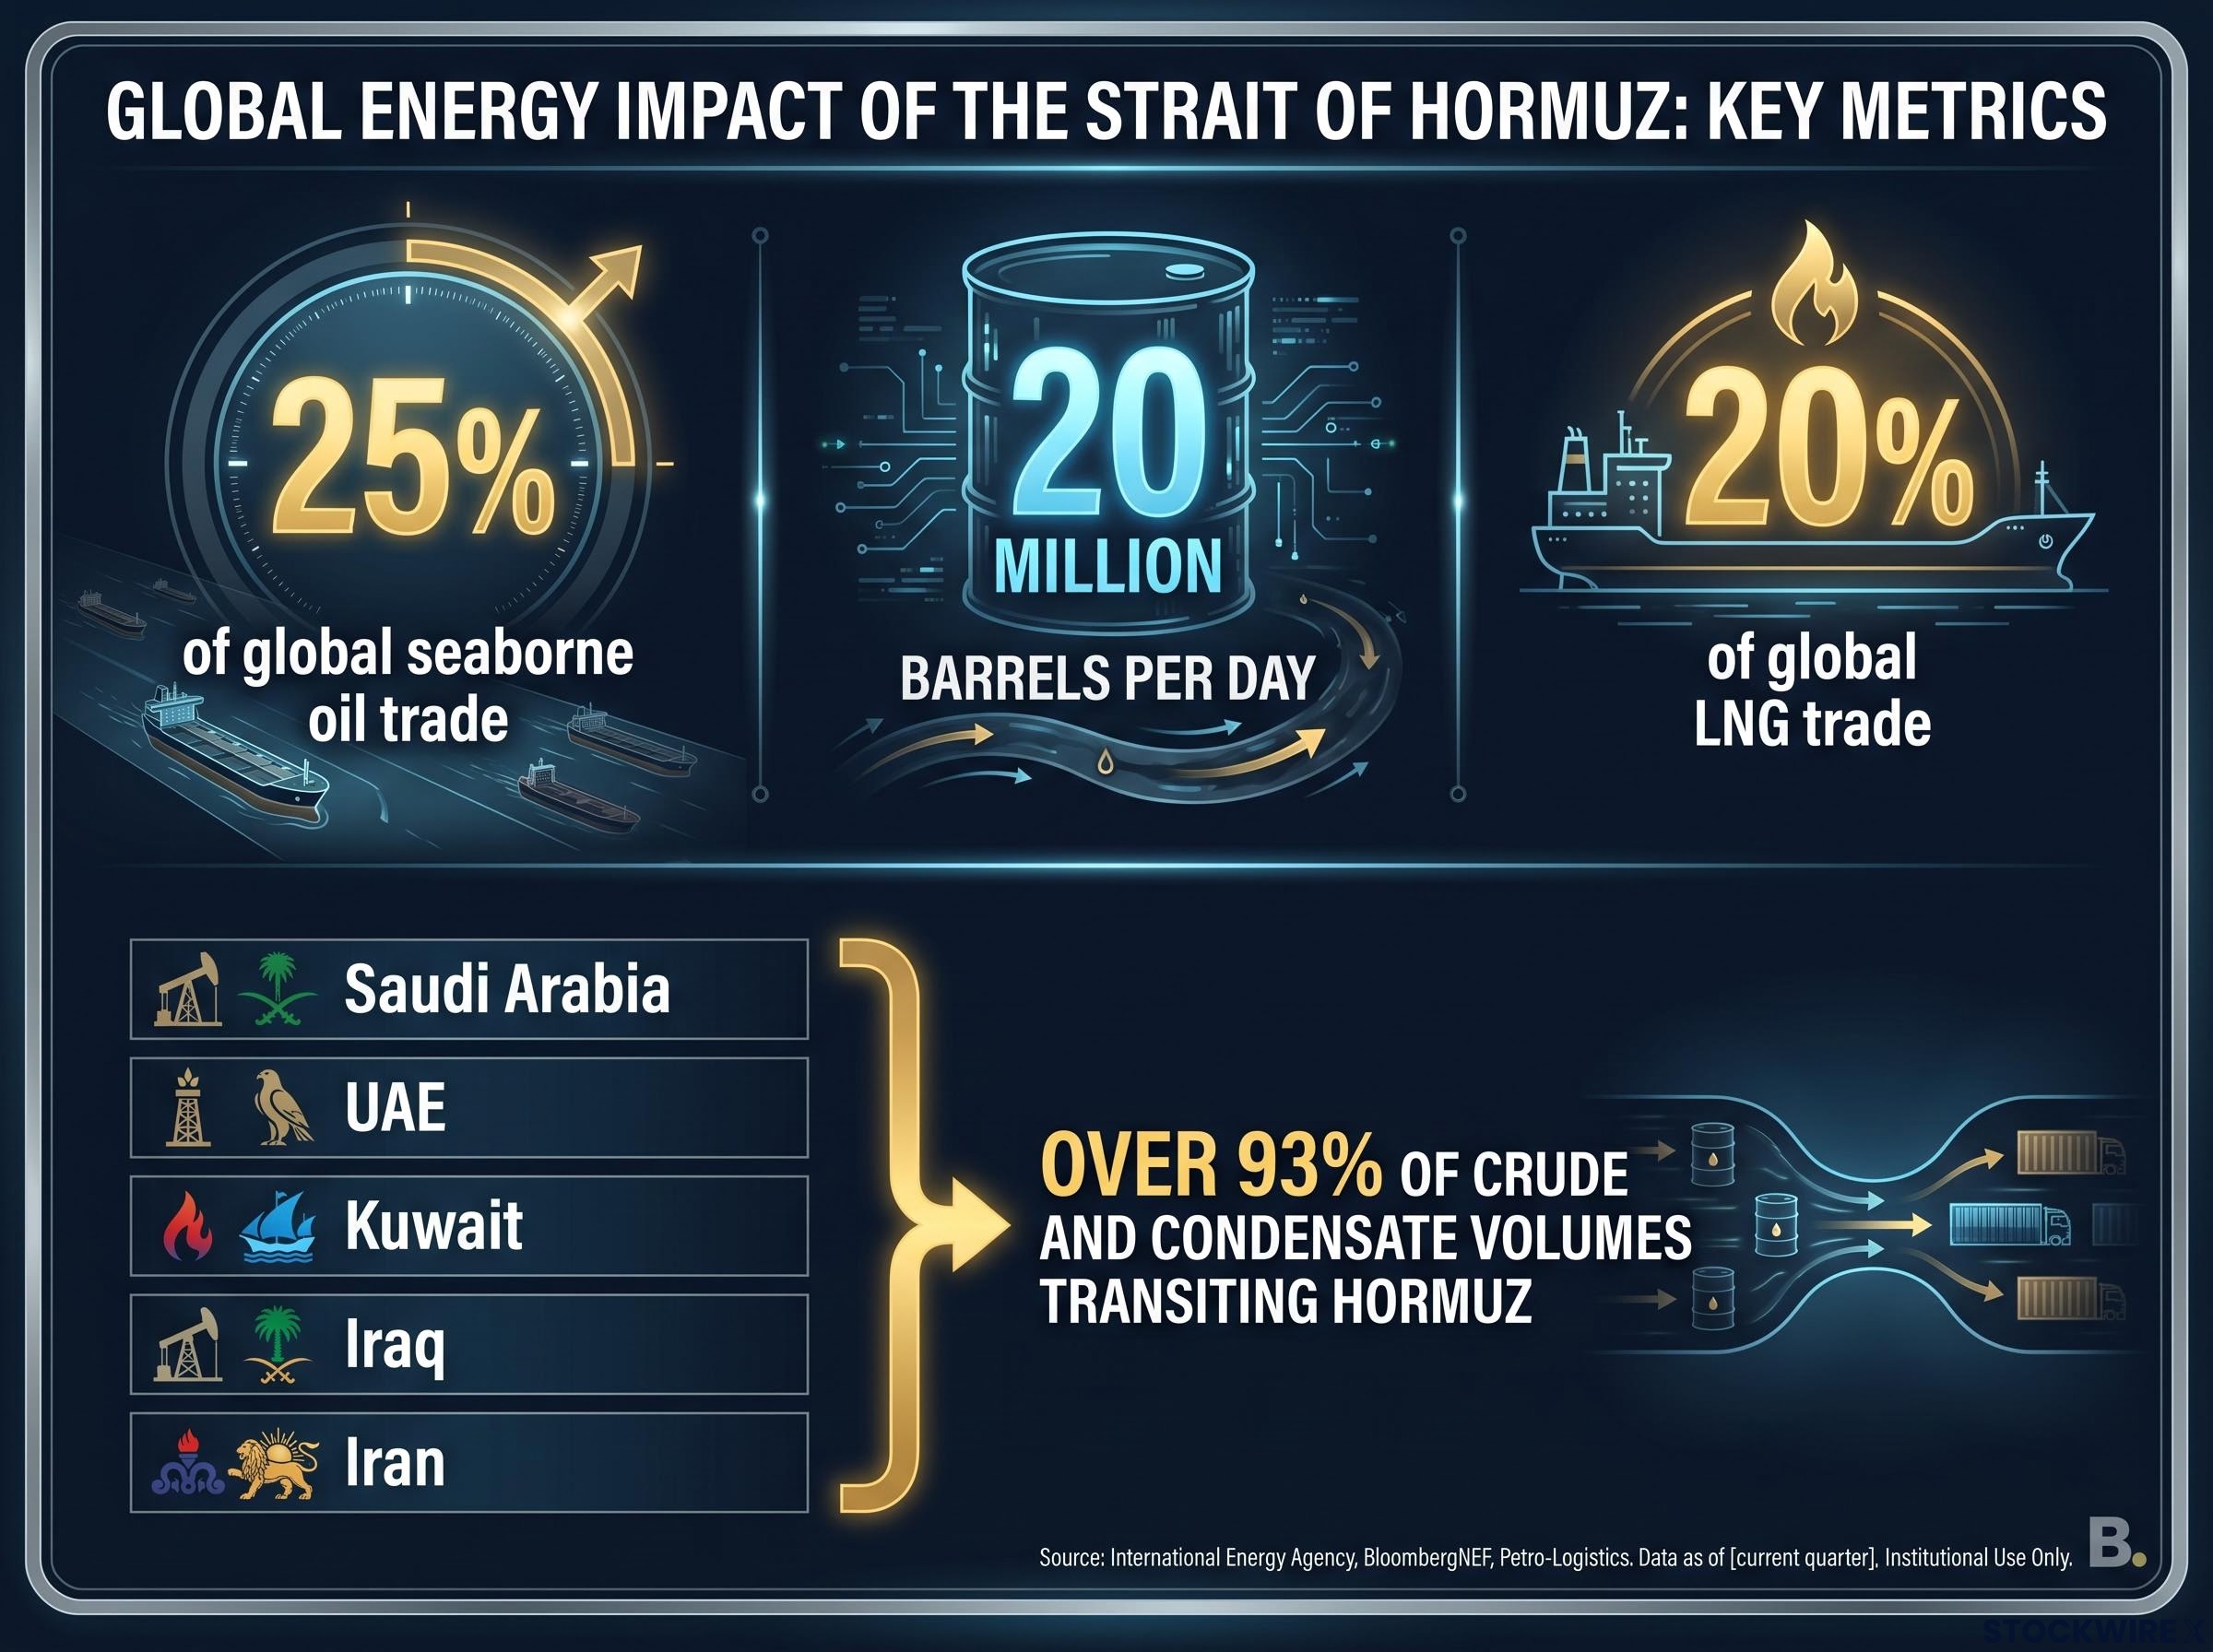
The Strait of Hormuz handles approximately 25% of global seaborne oil trade, roughly 20 million barrels per day of crude and petroleum products, along with approximately 20% of global liquefied natural gas (LNG) trade. Five Gulf producers account for the overwhelming majority of that volume.
| Producer | Key Exports | Collective Share |
|---|---|---|
| Saudi Arabia | Crude oil, refined products | Over 93% of crude and condensate volumes transiting Hormuz |
| UAE | Crude oil, LNG, condensate | |
| Kuwait | Crude oil | |
| Iraq | Crude oil | |
| Iran | Crude oil, condensate |
A prolonged closure of the strait cannot be rerouted away. Pipeline alternatives exist for a fraction of these volumes, but nothing replaces a waterway that carries one in every four barrels of seaborne crude globally.
Pipeline bypass limitations played a central role in how the price surge compounded so quickly; Saudi Arabia’s East-West Pipeline and the UAE’s ADCOP Pipeline together can handle only a fraction of the volumes that transited Hormuz daily, leaving the supply gap structurally unbridgeable by existing overland infrastructure regardless of geopolitical developments.
The gap between Brent at $91+ and pre-war price levels represents risk premium, not a structural shortfall in global production capacity. That premium was earned: three months of effective closure drew down inventories, forced costly rerouting, and embedded geopolitical risk into every barrel priced globally. A credible peace deal begins to unwind that premium. Markets discount future supply normalisation before tankers physically move, meaning price moves will lead physical flows, not follow them.
Three-plus months of elevated oil prices have fed directly into energy CPI components, creating a backward-looking inflation problem that will persist in the data even as the supply shock fades. Market expectations had shifted toward at least one Fed rate hike in 2026, driven partly by energy-related inflation and a resilient labour market. A peace deal and oil price normalisation puts direct pressure on that pricing.
The 10-year Treasury yield was flat on 9 June, remaining above pre-February levels, a signal that the bond market has not yet repriced the forward inflation path.
The May CPI release, scheduled for Wednesday 11 June 2026 (unverified in the original research), arrives at the centre of this tension.
The May CPI print will reflect the high-price regime of the past three months, not the regime that may be emerging if oil normalises. Investors face a near-term interpretive challenge: a print that looks hawkish on its face may arrive alongside a forward-looking macro environment that is becoming progressively more disinflationary.
Energy inflation pass-through into core CPI is not immediate; analyst estimates put 40-60% of an oil price increase feeding into core components over a 3-6 month lag, which means the June and July CPI prints carry more policy weight than the May figure, even if the May release drives the near-term market reaction.
Two distinct questions markets are now asking:
Separating those two signals is directly relevant to rate-sensitive portfolio positioning.
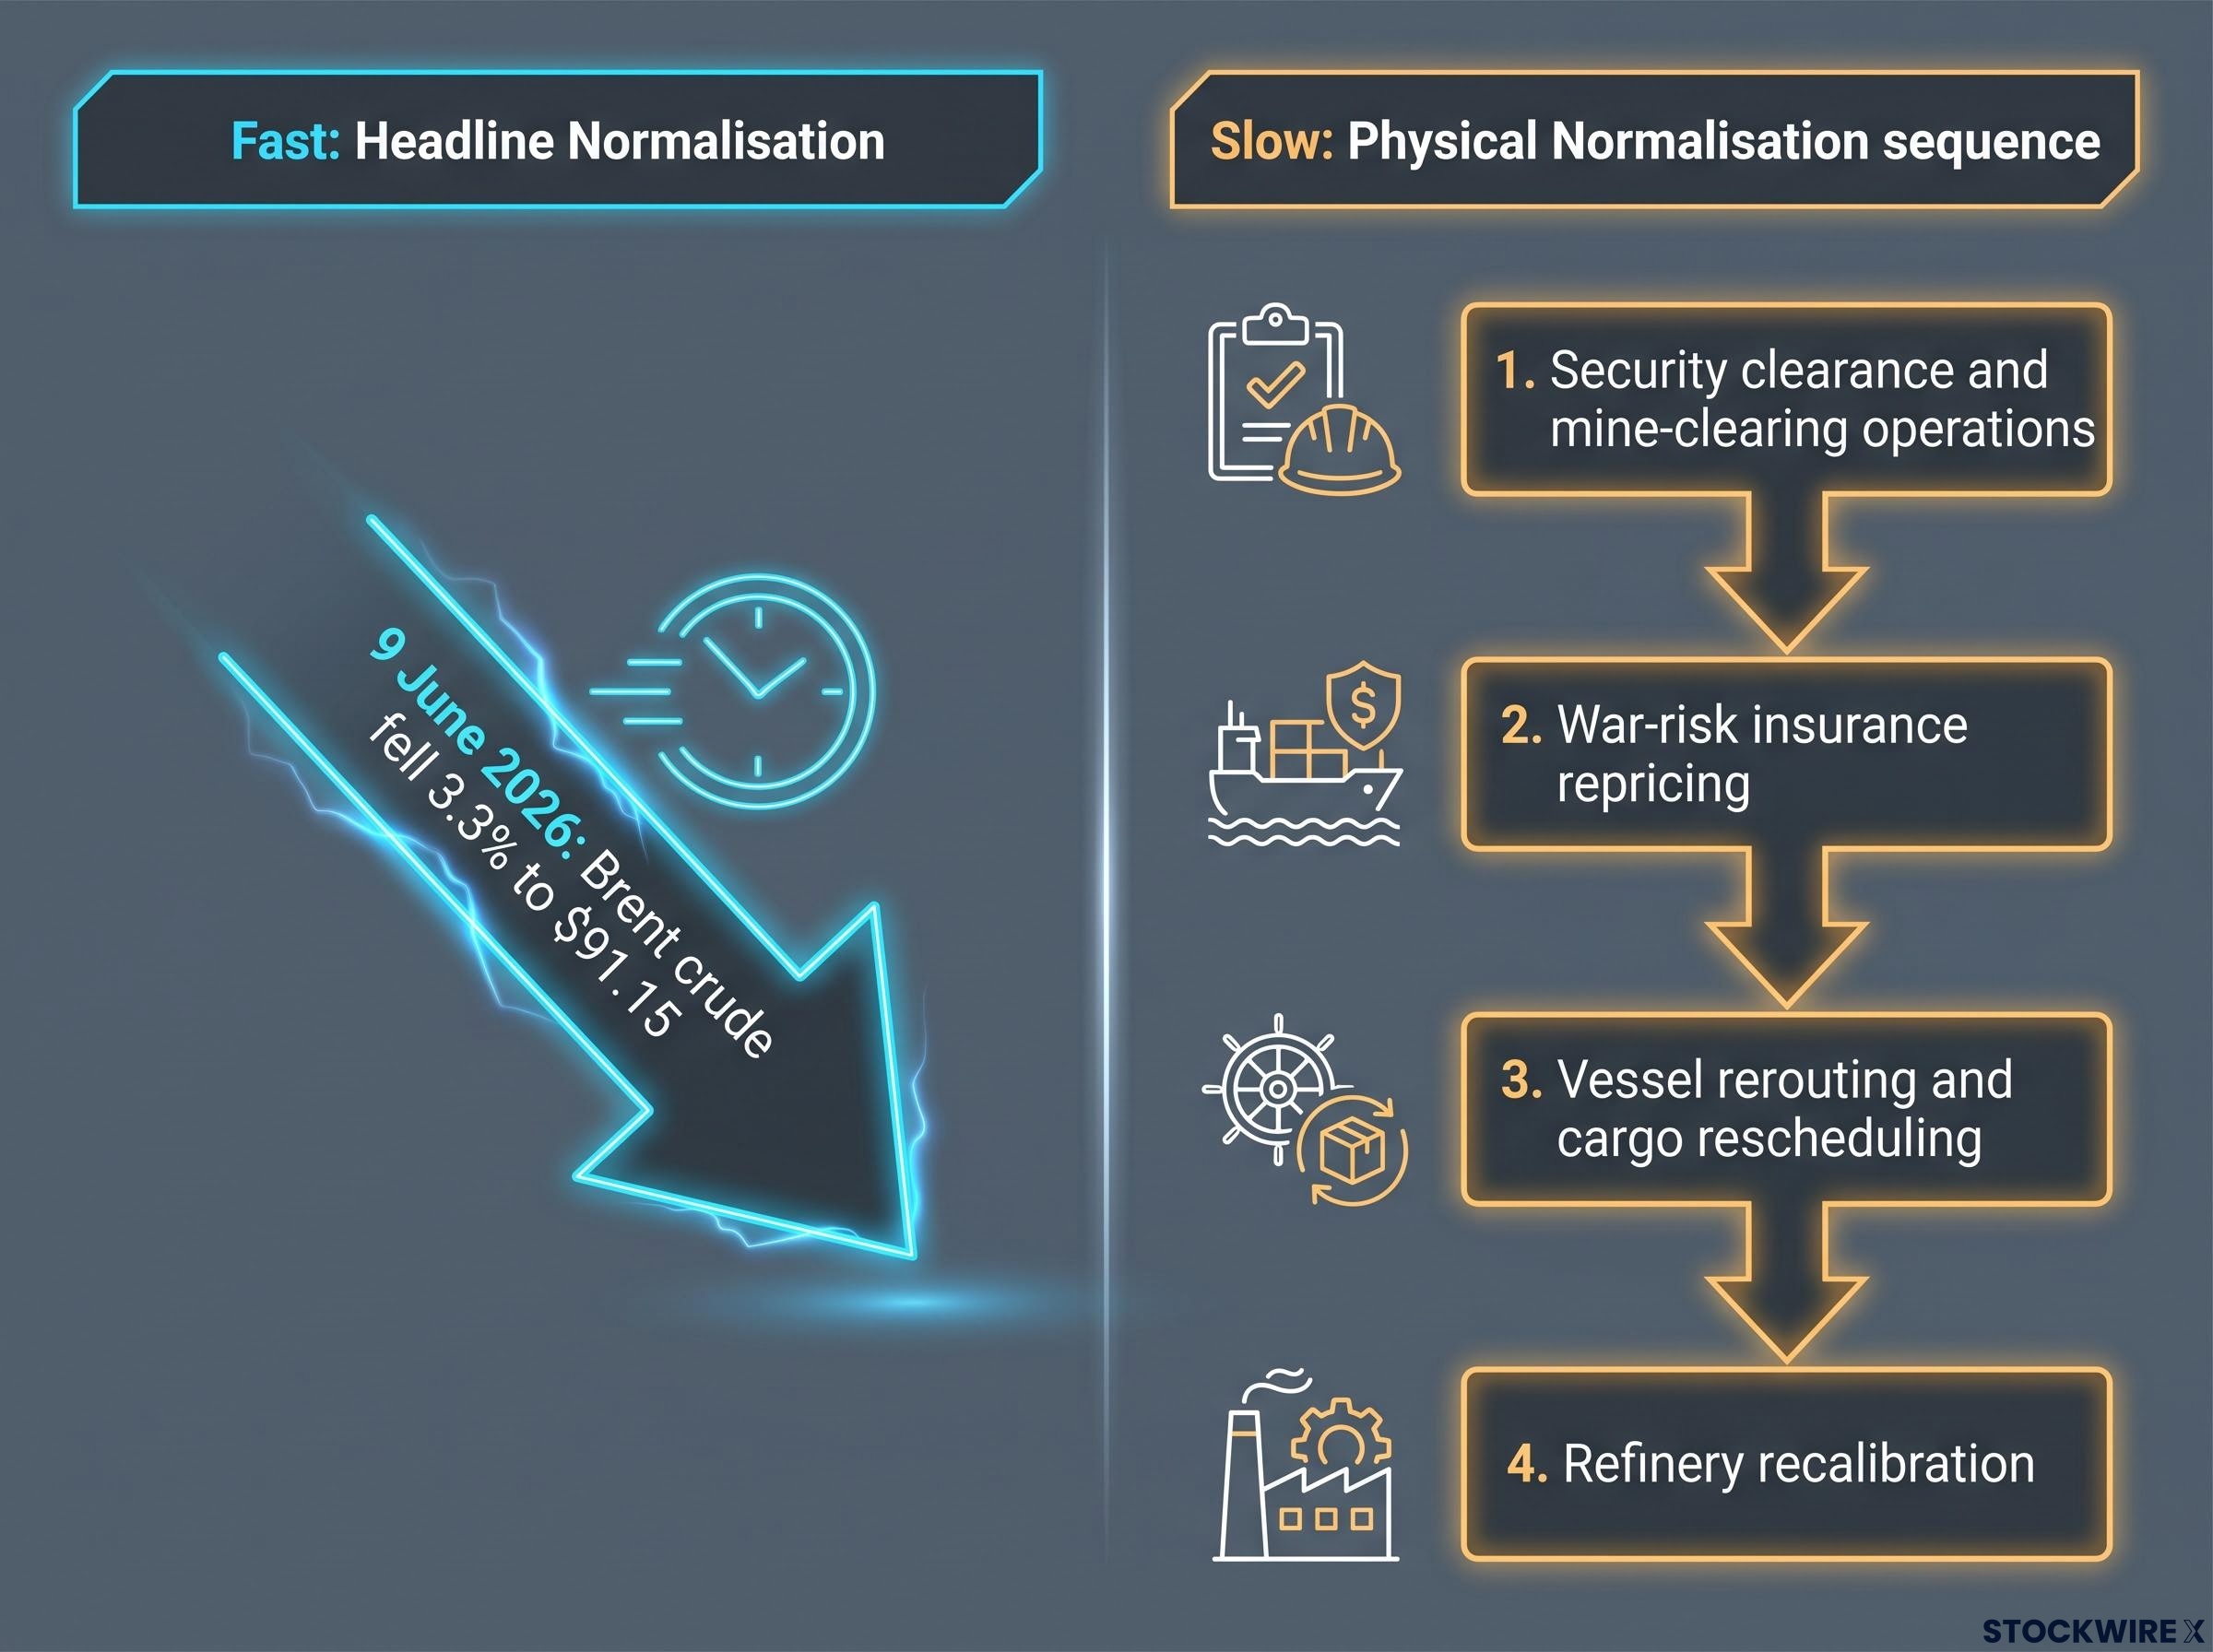
Asset prices reprice on headlines. Physical supply chains do not. That distinction is where investors most commonly misjudge the timeline.
Headline normalisation is fast: the 3.3% Brent drop on 9 June happened within a single session. Physical normalisation is slow, and it follows a specific sequence:
This sequence takes weeks to months, not days. Even with a signed deal, markets may retain a residual political risk premium if participants view the truce as fragile or reversible. The full unwind of the Hormuz premium is conditional, not guaranteed.
The Australian Naval Institute documented that war-risk insurance repricing for Hormuz transit reached 2.5% to 5% of hull value per voyage following the conflict’s outbreak, a cost structure that makes vessel operators economically reluctant to resume normal routing even after a ceasefire is announced.
Five signals will determine whether 9 June was the first leg of sustained normalisation or a relief rally in a still-unresolved conflict:
A peace deal does not move all assets in the same direction. The cross-currents require understanding directionality by asset class.
| Asset Class / Sector | Directional Bias on Deal Confirmation | Key Driver |
|---|---|---|
| Brent crude | Lower | Hormuz closure premium unwinds |
| 2-year Treasuries | Yields lower | Energy-driven hike expectations repriced |
| 10-year Treasuries | Yields modestly lower | Inflation risk premium eases; growth outlook improves |
| Energy equities (high-beta E&P) | Underperform | Crude price deck revisions lower; wartime margins compress |
| Utilities / REITs | Outperform | Lower yields, reduced inflation fears support multiples |
| Consumer discretionary | Outperform | Lower gasoline and input costs support spending |
Specific triggers to monitor within each asset class:
Discount rate compression in growth and technology stocks is the mechanism most at risk of reversing quickly if oil prices normalise; the same yield movement that lifted the 10-year to 4.59% in mid-May has been mechanically compressing equity multiples across long-duration sectors, and a sustained oil price decline would begin unwinding that pressure through the same transmission channel in reverse.
The $91.15 close on 9 June is itself a signal worth reading carefully. It is below the pre-announcement level, reflecting genuine probability repricing. It is still well above pre-war February levels, reflecting genuine uncertainty about whether the deal closes and whether Hormuz reopens smoothly. The market has priced a probability, not a certainty.
The 10-year yield was flat on the session, reinforcing the bond market’s wait-and-see posture. Alongside the peace signal, markets on 9 June were also absorbing U.S. trade data and existing home sales figures, with the May CPI on 11 June completing the near-term data backdrop.
For investors wanting to understand the broader macro framework behind the bond market’s wait-and-see posture on 9 June, our deep-dive into how Treasury yields now drive White House policy examines why the 10-year yield has displaced the S&P 500 as Washington’s primary pressure lever, covering the mortgage, corporate borrowing, and federal debt servicing channels that make sustained high yields politically untenable.
The market has priced a probability, not a certainty. The next moves will be driven by the deal text, the enforcement terms, and the first AIS data showing tankers moving through the strait.
Catalysts that would confirm a sustained normalisation trend:
Catalysts that would reinstate risk premium:
The analytical anchor for investors is not any single data point, whether the CPI print on 11 June or the 9 June price move itself. It is the emerging regime: lower risk premium, fading energy inflation, and a forward path that looks materially different from the three months that preceded it. Current prices reflect that regime as a possibility. Confirmation will come from the indicators above.
This article is for informational purposes only and should not be considered financial advice. Investors should conduct their own research and consult with financial professionals before making investment decisions. Past performance does not guarantee future results. Financial projections are subject to market conditions and various risk factors.
The Hormuz closure premium is the extra cost embedded in crude prices above pre-war levels, reflecting geopolitical risk, inventory drawdowns, and costly rerouting caused by the effective closure of the Strait of Hormuz since late February 2026. It is a risk premium, not a reflection of a structural shortfall in global production capacity.
The Strait of Hormuz handles approximately 25% of global seaborne oil trade, roughly 20 million barrels per day of crude and petroleum products, along with approximately 20% of global LNG trade, making it one of the most consequential energy chokepoints in the world.
Brent crude fell 3.3% to $91.15 per barrel on 9 June 2026 after President Trump signalled that the United States was close to finalising a peace deal with Iran and that the Strait of Hormuz would reopen upon signing, triggering a probability-driven repricing of geopolitical risk in oil markets.
Headline repricing happens within a single session, as seen on 9 June 2026, but physical supply normalisation follows a sequence of security clearances, war-risk insurance repricing, vessel rerouting, and refinery recalibration that takes weeks to months, not days.
A confirmed Iran peace deal and resulting oil price decline would put downward pressure on energy-driven inflation expectations, which had shifted Fed rate hike pricing higher in 2026; lower oil prices would ease inflation risk premiums in both the 2-year and 10-year Treasury yields, particularly in the 2-5 year area of the curve most sensitive to Fed repricing.