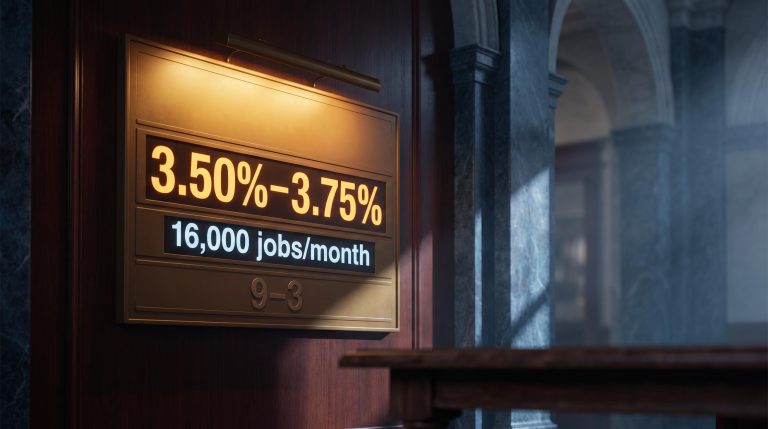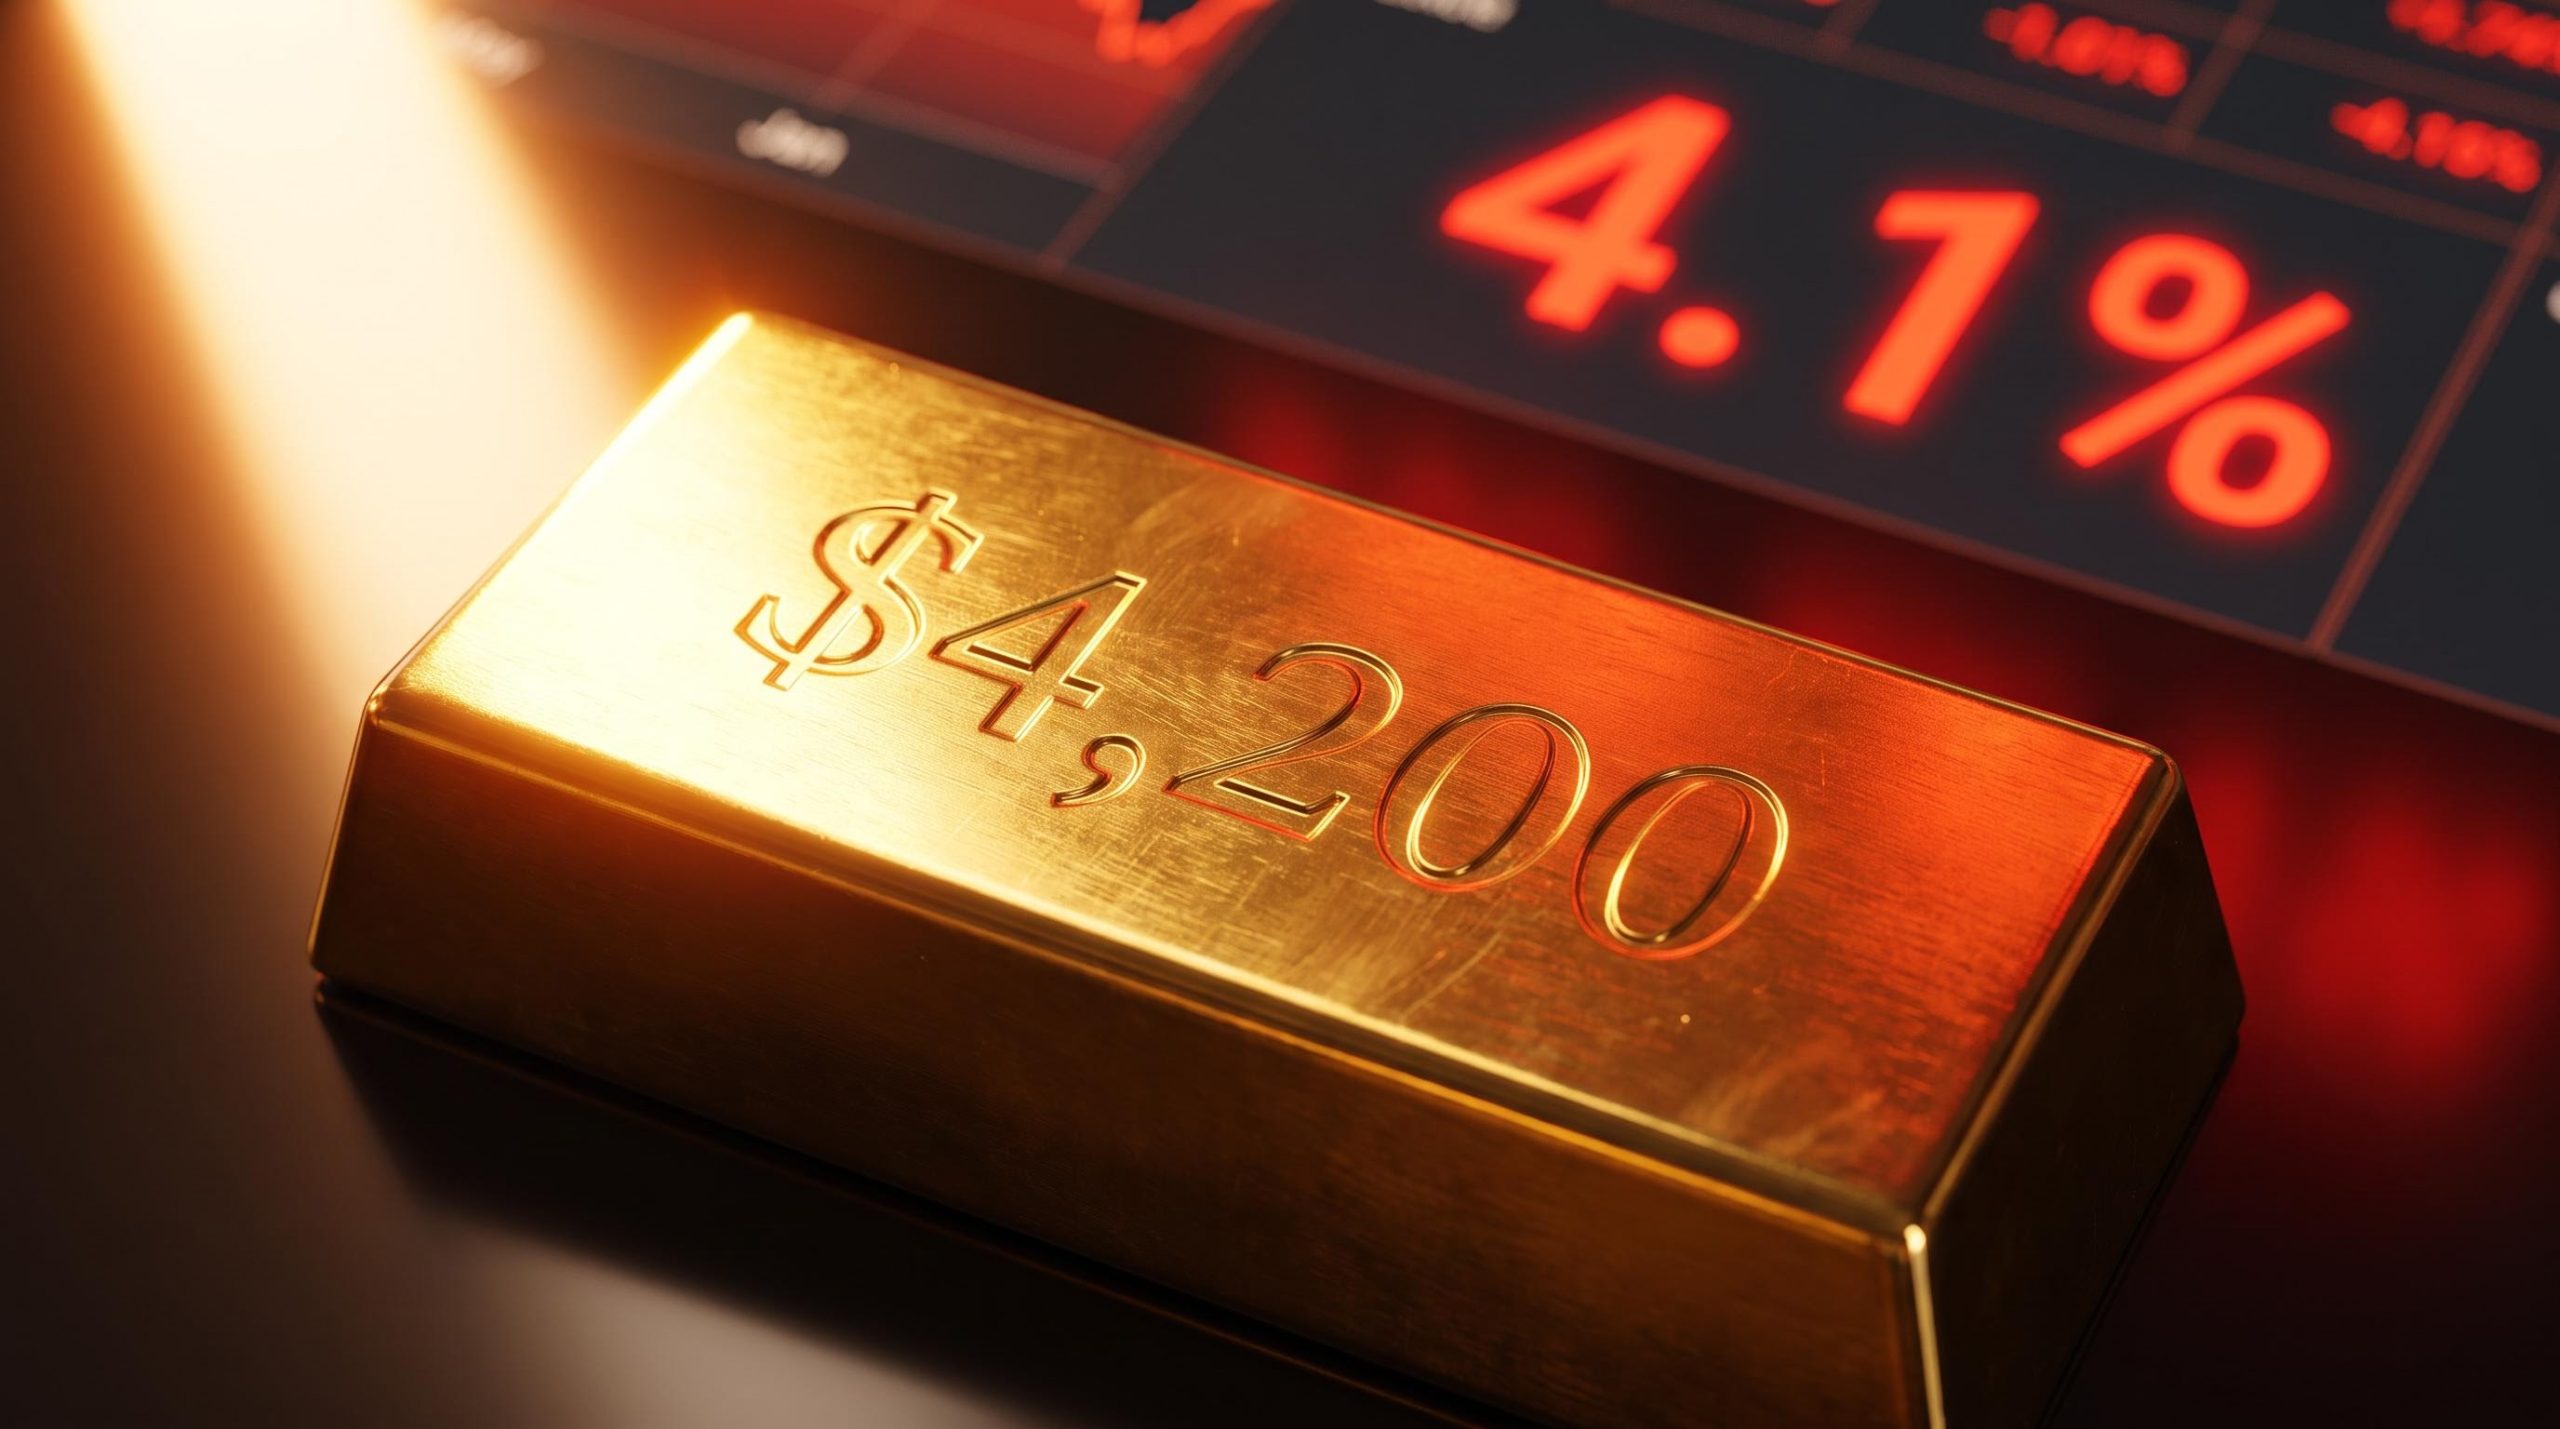
Gold just posted its sharpest single-session retreat in weeks, pulled down not by a panic or a data miss, but by the Fed doing exactly what markets had been warned it would do. A 25-basis-point hike to 3.75%-4.00% landed on 16 September 2026, and XAU/USD fell from an intraday peak of $4,366 to close near $4,250, with the metal still trading around $4,262 as of this writing. The question worth asking now is not what happened, but whether the selling is finished.
The Fed’s September decision did not arrive in isolation. Sixteen of eighteen FOMC officials are projecting at least one more hike before year-end, and the dot plot’s median end-2026 rate has climbed from 3.4% in March to 4.1% today, a trajectory that markets have consistently and materially underestimated all year.
That pattern of upward revision is the real story behind this sell-off, and it has direct implications for how long the headwinds facing gold are likely to persist.
What follows maps the mechanism driving gold lower, reads the current technical structure for where price could move next, assesses what positioning data reveals about the fragility or resilience of the current level, and places this moment inside the longer history of gold during Fed hiking cycles. Work through all four layers and you will have a clearer picture of whether this is a dip worth watching or the start of a deeper structural retreat.
Why the Fed’s rate path is the real weight on gold right now
Start with what did not happen. Inflation did not fall. The Fed’s own September projections put headline PCE inflation at 3.7% for end-2026 and core PCE at 3.4%, both revised higher than the June figures. So the sell-off is not gold reacting to an improving inflation picture that would reduce its appeal as a hedge.
What moved instead was the relationship between yields and inflation expectations. When the Fed signals more tightening, nominal Treasury yields rise faster than inflation expectations, which means real yields (the return on a bond after inflation) climb. Gold pays no income, so a rising real yield raises the opportunity cost of holding it. That is the mechanism doing the work here, not a change in the inflation story.
Invesco’s Gold Outlook 2026 frames it plainly: higher rates lift the opportunity cost of holding a non-yielding asset, and a stronger dollar makes gold more expensive for buyers outside the US. The dollar’s concurrent strength is not a separate headwind. It is the same opportunity-cost argument compounding on the currency side.
“Continued rate increases could drive further gold selling,” warned Daniel Pavilonis, senior market strategist at StoneX, as Treasury yields pushed to their highest levels since 2007.
The single hike is not the structural signal. The upward revision to the entire path is. Look at how the Fed’s own end-2026 projections have moved across the year:
| SEP Release | Median end-2026 rate | PCE inflation | Core PCE inflation |
|---|---|---|---|
| March 2026 | 3.4% | ~2.7% | 2.7% |
| June 2026 | 3.8% | 3.6% | 3.3% |
| September 2026 | 4.1% | 3.7% | 3.4% |
Chair Kevin Warsh characterised current monetary conditions as insufficiently restrictive, which is the language of a Fed with more work to do. Every one of the three 2026 projection releases pushed the rate path higher, and markets were caught underestimating each revision.
That tells you something practical about what to watch. As long as the trajectory keeps rising, gold’s headwinds hold, which makes the next CPI and PPI prints more than inflation readings. They are the inputs that decide whether real yields climb further and the pressure on gold intensifies.
When big ASX news breaks, our subscribers know first
What XAU/USD’s technical structure is telling you about the next move
The chart is not ambiguous right now. At roughly $4,262, gold sits below all three of its key moving averages: the 100-day SMA near $4,326, the 20-day SMA near $4,442, and the 200-day SMA near $4,540. When price trades under all three and the shorter averages are turning down, the near-term structure is bearish, and momentum indicators sliding below their midlines confirm it.
That structure sets up two decision points. One below, one above. Which one gets tested first, and whether it holds, determines whether this is a short correction or the start of an extended drawdown.
| Level | Label | Significance |
|---|---|---|
| $4,540 | 200-day SMA | Upper resistance boundary |
| $4,442 | 20-day SMA | Significant overhead resistance |
| $4,326 | 100-day SMA | First resistance to reclaim |
| $4,235 | Post-Fed session low | Immediate support |
| $4,200 | Structural floor | Break opens path to $4,000 |
Downside: the $4,200 floor and what lies below it
The first line of defence is $4,235, the low printed in the post-Fed session. The line that actually matters is $4,200.
That zone, roughly $4,180-$4,200, has repeatedly capped bullish momentum in recent months. FXEmpire’s late-July analysis described it as a resistance barrier reinforced by rising yields, and it is now flipping into the floor the market is defending. A sustained break below it on volume opens the path toward $4,000.
The $4,000 level is watched because it broke for the first time since November 2025 back in June, when a firmer dollar and higher rate expectations dragged gold under the round number. If $4,000 fails decisively, technical analysts flag $3,980 and $3,950 as the next targets. The trigger for that scenario is the same fundamental pair from the previous section: sustained high yields and a stronger dollar.
Upside: what gold needs to clear to change the picture
The resistance ladder is a list of conditions, not a forecast. Above the current price sit $4,300, then the 100-day SMA at $4,326, then a cluster at $4,368, the 20-day SMA at $4,442, $4,475, and finally the 200-day SMA at $4,540.
Each level is something gold has to clear, not something it is likely to reach on its own. Recapturing the 100-day SMA at $4,326 would be the first meaningful signal that the near-term structure is stabilising rather than deteriorating.
For anyone holding or watching gold, the immediate read is proximity to $4,200. If that level breaks on volume, the case for a move toward $4,000 stops being speculative and becomes structurally supported by the chart.
What futures positioning and ETF flows say about who is holding gold here
Positioning data sends two signals that look contradictory, and understanding why they coexist matters more than either one alone. Futures traders are crowded long, which is a vulnerability. ETF buyers are still pouring money in, which is support. Different classes of buyer, different implications.
Start with the futures side. The most recent CFTC Commitments of Traders report, covering positions as of 8 September 2026, shows speculative money leaning heavily to one side:
- Large speculator net long: 231,960 contracts (up 3,836 week-over-week)
- Managed money net long: 134,972 contracts (down 1,799 week-over-week)
- Commercials net short: 270,274 contracts
- Total open interest: 411,227 contracts
Note the split inside the bullish camp. The large speculator gross long rose, but managed money net longs ticked down. That divergence is a fragility signal: the crowded long positioning creates room for a stop-run, a fast cascade of sell orders triggered when price breaks a key level and stops out leveraged longs. If $4,200 gives way, that unwind could push gold toward $4,000 faster than the fundamental picture alone would justify.
Now the counterweight. ETF investors are behaving nothing like the futures crowd.
Global gold ETF inflows reached US$18 billion in August 2026, led by North American and European funds, according to World Gold Council data. Year-to-date inflows through August totalled US$29 billion, roughly 160 tonnes of added holdings.
Those two flows tell you different things because the buyers are different. Futures speculators are leveraged and quick to exit, which is why their positioning is a volatility signal. ETF buyers tend to be institutions and allocators building longer-horizon positions, and their continued inflows run directly against the bearish technical read.
The takeaway is not a direction call. Positioning tells you where the market is vulnerable to fast moves, which is precisely the information you want when deciding where to set entries, exits, or stops around the $4,200 zone.
What history says about gold during Fed hiking cycles
Here is the finding that complicates the simple story. Gold does not reliably fall when the Fed hikes. Across the historical record, it has more often risen.
The instinct that rate hikes are straightforwardly bad for gold does not survive contact with the data. What determined direction in past cycles was not whether the Fed hiked, but how it hiked and where real yields and the dollar went. Consider the evidence in order of analytical weight:
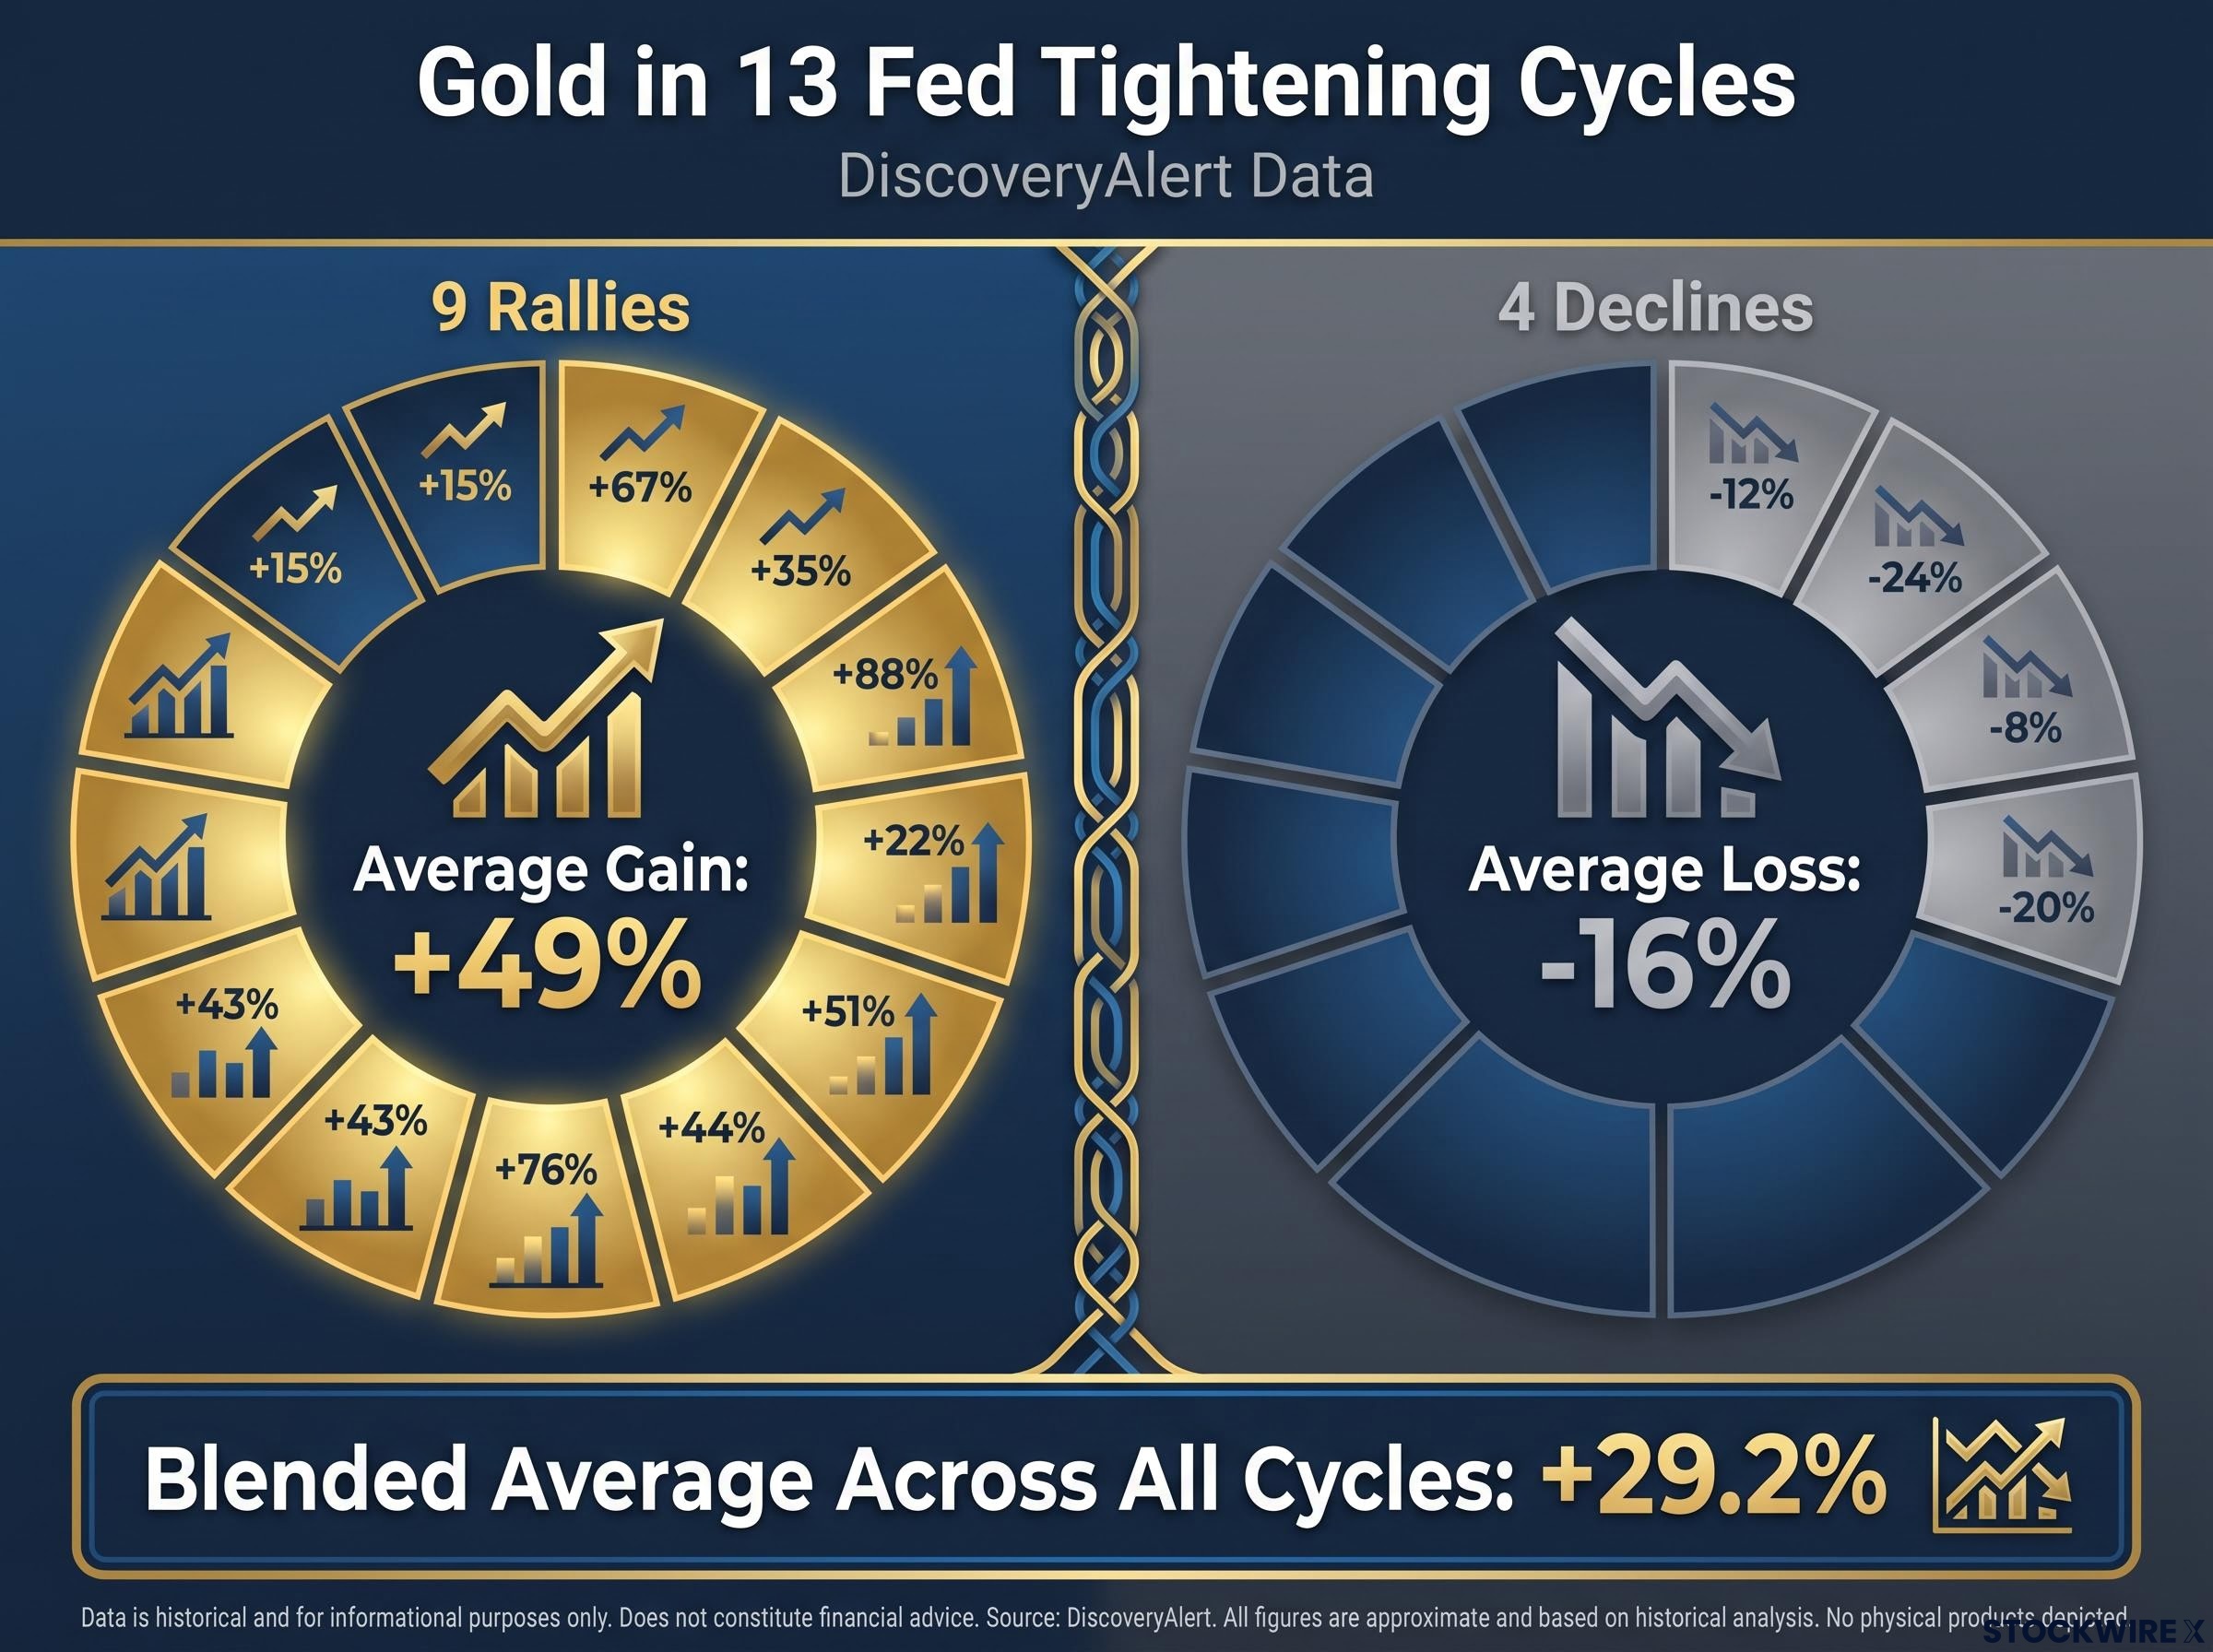
- DiscoveryAlert’s review of 13 Fed tightening cycles over roughly 50 years found gold rallied in 9 of them, averaging +49% in the positive episodes and a blended +29.2% across all cycles. Only four cycles saw declines.
- The LBMA’s study of cycles from 1971 to 2008 found gold rallied through five of seven clearly identifiable hiking cycles, averaging gains of around 133% in the rallying episodes.
- The World Gold Council has found that gold tends to make its strongest moves when the Fed shifts from tightening toward a neutral stance, though the effect is not always immediate.
That third point is the one to hold onto. The pivot, not the peak of hiking, has historically been the catalyst.
What made the difference in prior cycles
The variable that separated bullish cycles from bearish ones was pace. Front-loaded shock tightening, like some of the early-1980s episodes, was dangerous for gold because it drove real yields sharply positive in a compressed window. Gradual, telegraphed hikes were a far more benign setup.
The bullish cycles of 2004-06 and 2015-19 ran on measured 25 bps increments with inflation expectations that stayed anchored, and gold rose through both. September 2026 looks more like those episodes than the 1980s: gradual 25 bps hikes, still-elevated inflation expectations, and an active central-bank buyer base underpinning demand.
So the more useful question is not whether this hike is bad for gold. It is where the Fed sits in its cycle. Early-to-mid tightening with more hikes projected is a different environment from a late-cycle pause, and history says the latter has been the setup that drove gold’s strongest runs. The World Gold Council’s scenario work puts numbers on the upside: a shallow slowdown could lift gold 5%-15%, and a deeper downturn 15%-30%.
Where the balance of risk sits from here, and what to watch next
The bearish case is real, but it is conditional. It requires yields to stay elevated and the dollar to hold its bid. Remove either leg and the setup shifts.
Several things could remove them. Renewed dollar weakness, which State Street flags as a meaningful upside risk, would ease the FX headwind directly. A macro slowdown that triggers safe-haven inflows would pull a different class of buyer into the market. And any softening in FOMC language toward a pause would reposition gold in the cycle, closer to the pivot that history rewards. Janus Henderson notes that emerging-market central-bank purchases have been a major demand source capable of counteracting the negative real-yield impact, and the World Gold Council points to tense geopolitics as an ongoing support for central-bank and ETF demand even in a high-rate environment.
That leaves three variables worth tracking in the weeks ahead:
- The next CPI and PPI prints: they feed directly into whether real yields rise further and gold’s headwinds intensify.
- The DXY trajectory: a firmer dollar deepens the pressure, a weaker one relieves it.
- FOMC language: any shift toward signalling the cycle is closer to its end than the dot plot implies.
That last one carries asymmetric weight. With 16 of 18 officials already projecting at least one more hike, the bar for a positive surprise from Fed communication is low. Any hint that tightening is nearer its end than the projections suggest would be exactly the kind of pivot signal that history says drives gold higher fastest.
State Street’s midyear outlook frames the medium-term range: a bear case of pullbacks into $4,000-$4,750, and a base case of consolidation in a $4,750-$5,500 band.
Track these three variables and you will spot whether the sell-off is deepening or stabilising before the price makes the answer obvious.
What the data actually tells you before the next Fed decision
Four layers, one read. The fundamentals point down, because rising real yields and a firm dollar raise the cost of holding a non-yielding asset. The technicals point down, with gold below all three key moving averages and $4,200 as the line that matters. Positioning adds fragility, because crowded speculative longs could accelerate any break lower. And history complicates the whole picture, because gradual hiking cycles have not been structurally fatal for gold.
Put together, this is a market under genuine pressure from a Fed that is not finished. In the near term, the setup favours further pressure, with $4,000 as the scenario to watch. In the medium term, the cycle pivot remains the historical catalyst for gold’s strongest runs, and that pivot has not arrived.
The single line the market is watching is $4,200. Hold it, and the current pattern persists. Break it on volume, and the path to $4,000 opens. Which way it resolves depends on the three variables ahead: the next inflation prints, the dollar’s direction, and whether the Fed’s tone shifts toward a pause.
The bearish case needs all three to align, not just one. The next FOMC meeting, with 16 of 18 officials already projecting further hikes, is the next major inflection point.
This article is for informational purposes only and should not be considered financial advice. Investors should conduct their own research and consult with financial professionals before making investment decisions. Past performance does not guarantee future results. Financial projections are subject to market conditions and various risk factors, and forward-looking scenarios are speculative and subject to change based on market developments.