
The Dollar Index dropped under 98.80 on 19 August 2026, recording its weakest daily settlement in roughly three months. The daily chart is offering bulls almost nothing to work with: every prior support has flipped into resistance, and the oscillators are stretched but not yet signalling a floor.
This is not a routine pullback inside a healthy trend. The breakdown carries structural weight because of where the index settled relative to its key moving averages and the prior consolidation zone. Making matters more immediate, the next 48 hours deliver a compressed window of high-impact US economic data, from the Philadelphia Fed Manufacturing Survey to preliminary PMIs, before the market can settle into a cleaner directional read.
Here is the full level-by-level map: where sellers are likely to reload on any bounce, where bulls can mount a credible case, and which data prints on Thursday and Friday will determine whether this is a controlled retreat or an accelerating breakdown.
The breakdown in context: what closing below 98.80 actually means
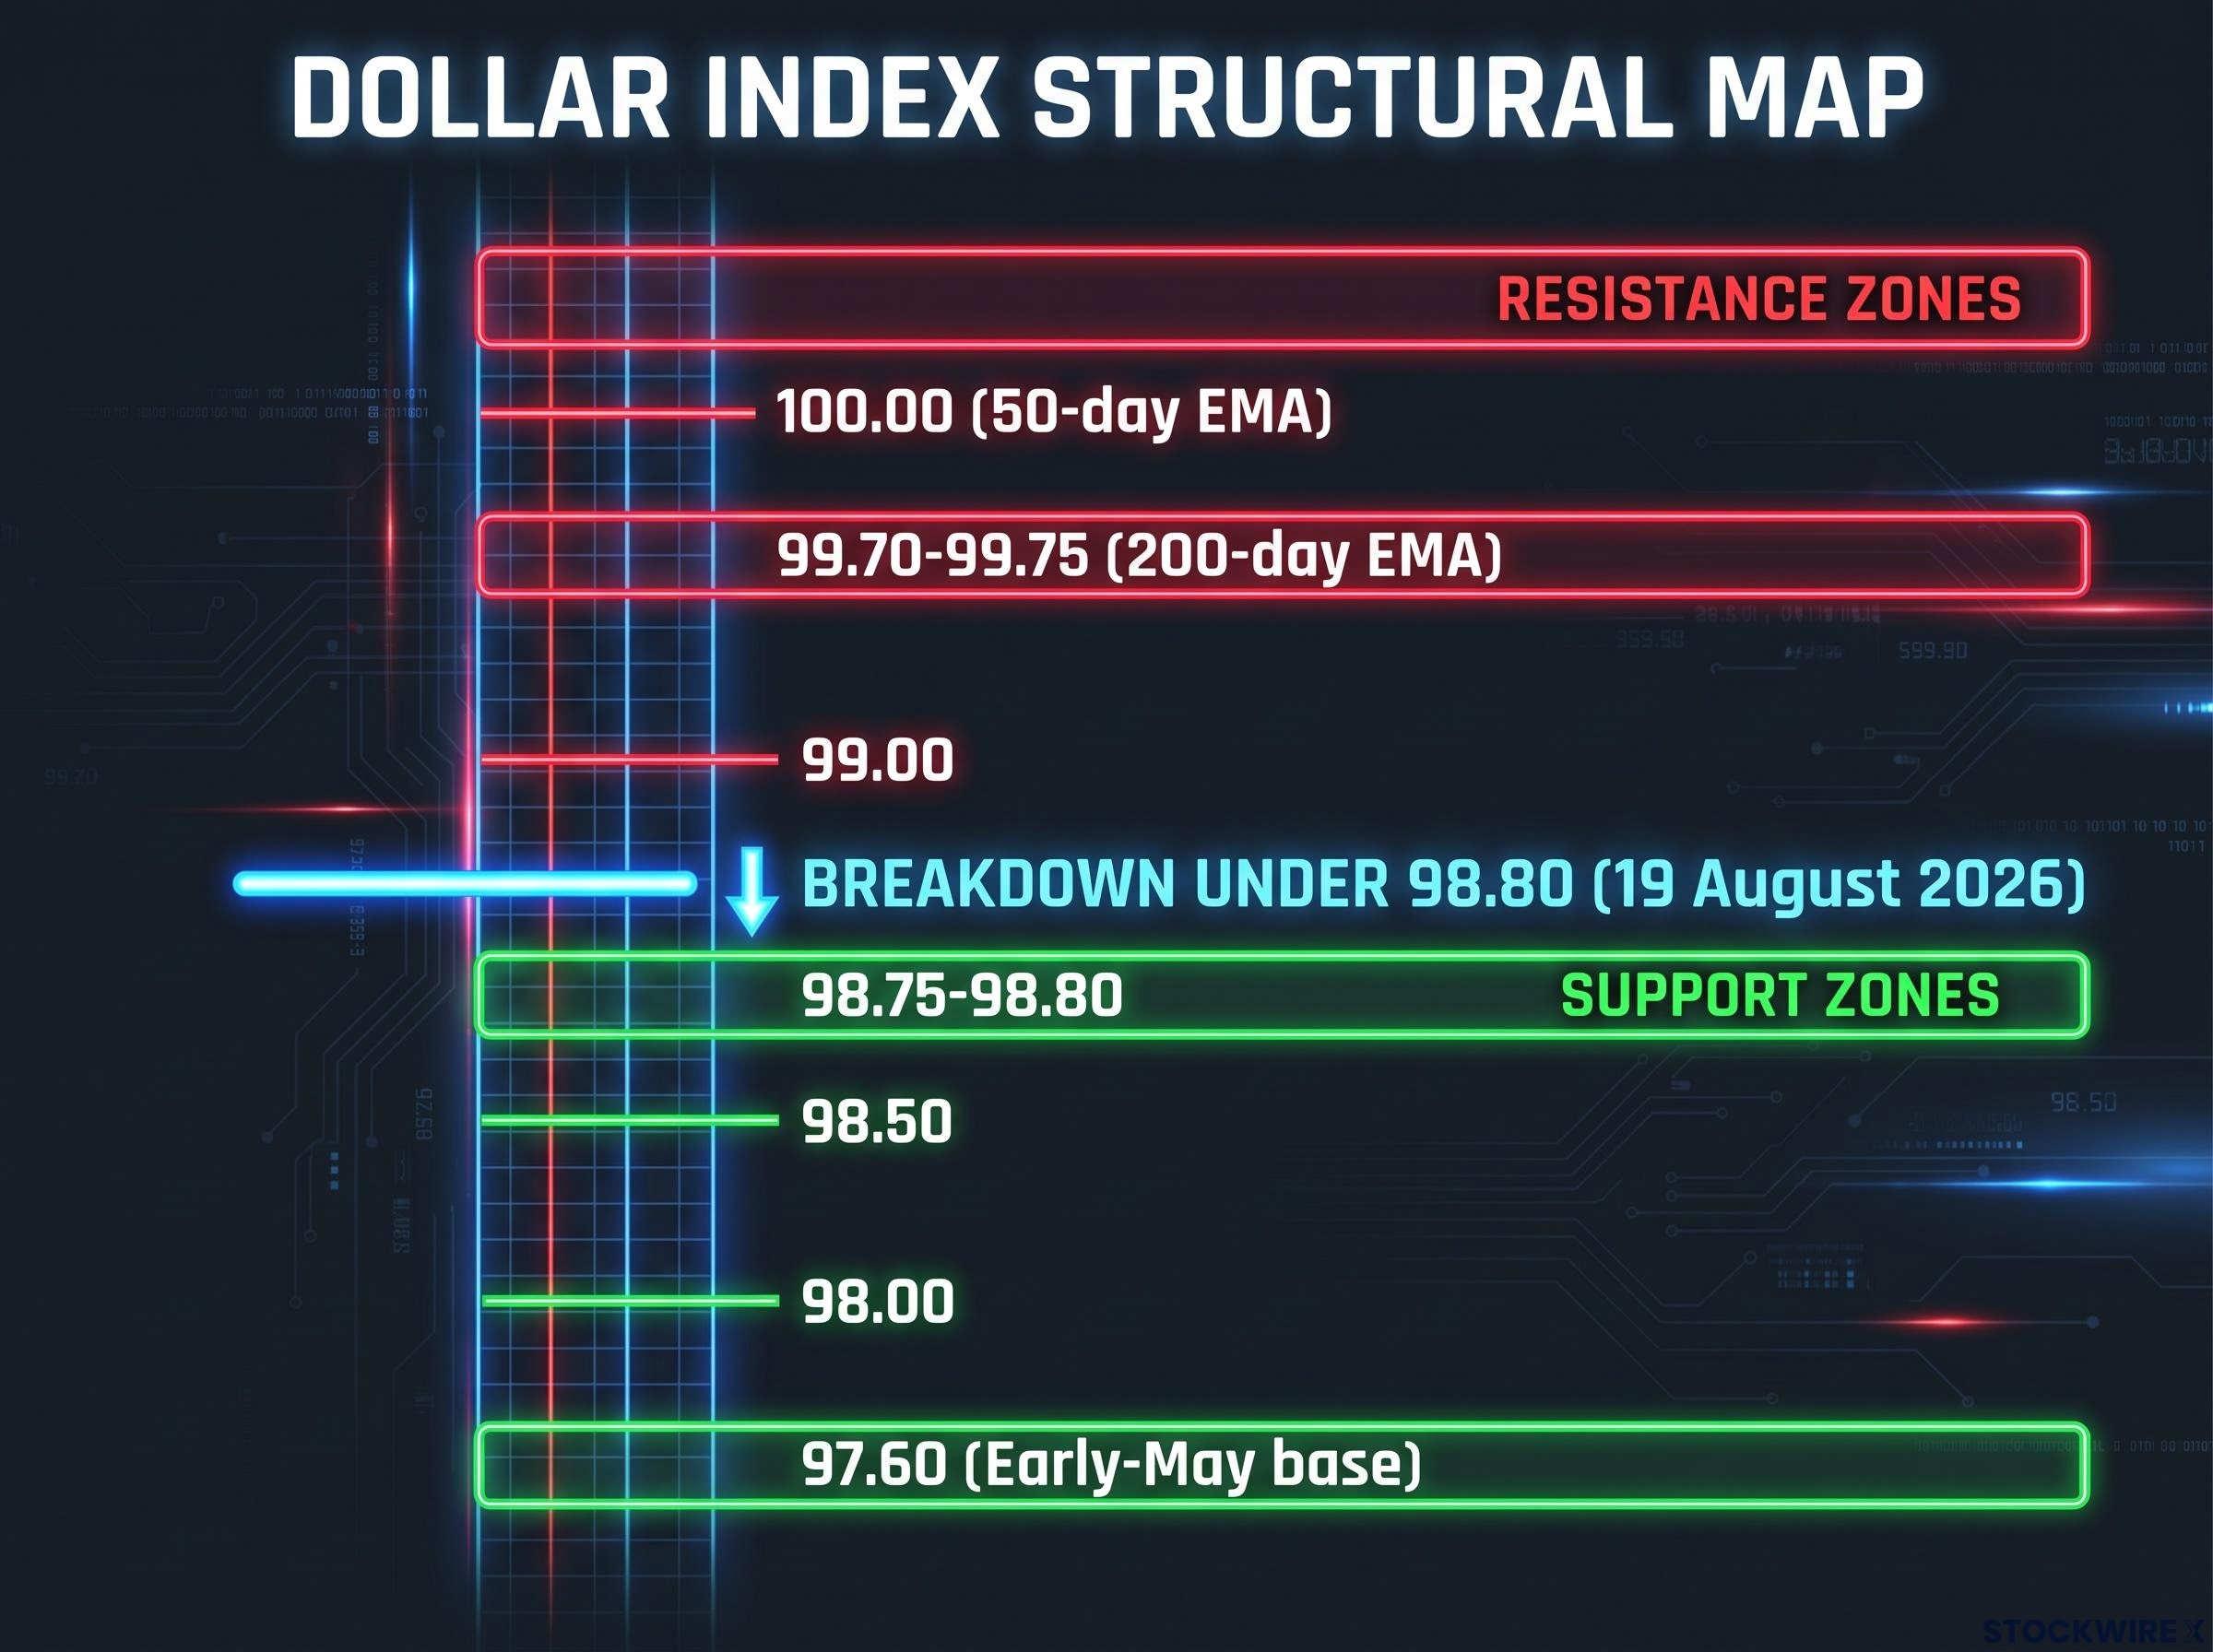
The close below 98.80 did not happen in isolation. It completed a stair-step structure that has been building across the daily chart for weeks: each prior support level has broken, held briefly, and then rolled over into resistance on the next leg lower. The pattern is directional, not choppy.
That sequence matters. It tells you the market is not pausing to negotiate at each support level. Price is passing through, which means any position predicated on a quick V-shaped recovery here is running against the weight of the structure.
The DXY technical structure at the 100 handle just weeks ago showed the same layered overhead resistance dynamic now visible at lower levels: EMA caps sitting above spot, MACD below zero, and RSI failing to recover before the next leg lower reinforced the bearish read.
Reading the stair-step: why prior support becomes resistance
The zone between 98.75-98.80 marks the immediate breakdown area, where sellers asserted control most recently. Beneath that, 98.50 offers an interim pause point, though it lacks the structural depth to sustain a meaningful defence. The principal downside target is the 98.00 handle, a clean round number that represents the first area where a genuine buyer response becomes credible. Should that give way, the deeper structural shelf near 97.60, which marked the early-May launchpad for the prior rally, would come into focus and would signal a major structural break if breached.
| Level | Role | Significance |
|---|---|---|
| 98.75-98.80 | Immediate support / breakdown area | Current session low; now the zone where sellers took control |
| 98.50 | Secondary support | Interim pause level; limited structural depth |
| 98.00 | Primary downside objective | Round number and first zone for a meaningful buyer response |
| 97.60 | Early-May structural base | Deeper support; a break here confirms a major structural shift |
Understanding this map is the difference between treating current levels as a potential entry point and recognising them as continuation risk. For anyone with dollar exposure or FX-adjacent positions, the stair-step tells you which side of the structure carries the burden of proof right now, and it is not the bulls.
When big ASX news breaks, our subscribers know first
Moving averages as overhead ceilings, not recovery targets
The instinct on a selloff this sharp is to look at the moving averages above spot and treat them as recovery targets. That instinct is wrong in this configuration.
Each moving average sitting above spot price functions as a zone where sellers are likely to re-engage, not a destination bulls are heading toward. The resistance picture layers up as follows:
- 99.00: The first seller reload and pause level on any bounce. This is where early shorts who covered near the lows are most likely to re-enter.
- 99.70-99.75 (200-day EMA): The level that must be reclaimed on a closing basis before the broader trend structure can be considered repaired. Until price is back above here, the longer-term bias stays bearish.
- ~100.00 (50-day EMA): The psychological ceiling and the upper bound of any realistic near-term recovery absent a decisive shift in the fundamental story.
Systematic signals are currently showing a “Strong Sell” bias at these levels, with all shorter exponential and simple moving averages positioned above spot and acting as caps rather than supports.
“A sustained daily close back above 99.75 is what separates a genuine trend repair from a short-covering bounce that runs out of fuel.”
Until that happens, every rally into the moving average band is more likely a selling opportunity than a trend change. That framing should guide how you size any counter-trend position. Knowing where supply returns on a relief rally is more actionable than knowing the broader directional bias alone.
What the Stochastic RSI at 16 does and does not tell you
With the daily Stochastic RSI sitting at approximately 16, the indicator has pushed firmly into oversold territory, a level that reflects how one-sided the recent momentum has been relative to the index’s own recent range. The Stochastic RSI measures how far an asset’s RSI has fallen relative to its own recent range; a reading this low means momentum has been almost entirely one-directional.
That sounds like a buy signal. It is not, at least not on its own.
In strong downtrends, oversold momentum readings can persist for extended periods while price continues to grind lower. What the oscillator is telling you is about timing and position sizing, not directional bias:
- What it means: The selloff has been aggressive and one-sided. Stretched downside creates room for a short-covering bounce if data or Fed rhetoric surprise to the dollar-positive side.
- What it does not mean: Capitulation is complete, or a reversal is imminent. An oversold reading in a confirmed downtrend is not a buy signal on its own; it is a caution against pressing fresh shorts at current levels.
The directional call remains bearish. But if you are bearish, the oscillator reading primarily tells you to wait for a rally before adding rather than pressing new shorts here. That discipline, waiting for price to come to your level rather than chasing momentum into a potential flush, is what separates a well-structured trade from an expensive lesson.
The dollar’s 2026 structural context matters here: the DXY peaked at 101.8 in late June before shedding nearly three full points into this week’s settlement, and Morningstar’s valuation model flagging the index as approximately 15% overvalued at the peak suggests the current breakdown is unwinding an overshoot rather than marking a new secular low.
Thursday and Friday catalysts: the data that will move this chart
The next 48 hours carry more weight than a typical mid-week session. Three high-impact releases land before the market can settle into a cleaner read, and each one feeds directly into the Fed rate expectations that are currently driving dollar weakness.
Thursday opens with Initial Jobless Claims at 12:30 GMT, where the consensus sits at 210,000 against a prior of 209,000. A reading close to that range would represent steady-state conditions and matter mainly if it deviates sharply. The more market-moving release is the Philadelphia Fed Manufacturing Survey, with the consensus forecast at 25 versus a prior of 41.4, an expected single-month drop of over 16 points that is striking in its own right.
September hike repricing has been the dominant dollar headwind across August, with odds collapsing to around 30% on softer labour and inflation data, and the current positioning squeeze into Thursday’s Philly Fed release reflects how much the data must surprise to the upside before the rate-expectations narrative reverses.
“A Philly Fed print near consensus would represent a deterioration of unusual speed for a regional survey, and the dollar index would struggle to hold current levels without testing 98.00 on a miss of that scale.”
A Regional Fed President is scheduled to speak at 15:10 GMT on Thursday, providing an additional opportunity for the market to pick up directional tone from Fed communication.
Friday sees the release of the preliminary August S&P Global PMI figures at 13:45 GMT, covering both manufacturing (consensus 53.8, prior 53.9) and services (consensus 54.0, prior 54.6), with the composite previously sitting at 54.5. The services PMI is the single most important print in this window because it either validates or challenges the cooling growth narrative that has been selling the dollar. Knowing that in advance tells you where to focus your attention on Friday morning.
| Release | Date | Time (GMT) | Consensus | Prior |
|---|---|---|---|---|
| Initial Jobless Claims | Thu 20 Aug | 12:30 | 210,000 | 209,000 |
| Philly Fed Manufacturing | Thu 20 Aug | Thursday | 25 | 41.4 |
| S&P Global PMI (Mfg) | Fri 21 Aug | 13:45 | 53.8 | 53.9 |
| S&P Global PMI (Services) | Fri 21 Aug | 13:45 | 54.0 | 54.6 |
Two scenarios for the next 48 hours
Scenario A (weak data): A soft Philly Fed print combined with services PMI slipping below 54.0 would reinforce the breakdown narrative. In this case, the path toward 98.00 opens cleanly, and a test of the 97.60 structural base becomes a live possibility within days.
Scenario B (strong data or hawkish Fed tone): Mixed or better-than-expected readings, particularly a services PMI that holds above the mid-50s, combined with hawkish Fed rhetoric on Thursday, would squeeze the oversold positioning and drive a bounce toward 99.00. Maximum upside in this scenario extends to 99.70-99.75 before sellers re-assert.
Jackson Hole and why the chart view has a shelf life
Every level mapped above is reliable for navigating this week. Beyond that, the analysis carries an expiry date, and that date is 27 August 2026.
The Jackson Hole Economic Symposium, running from 27-29 August and hosted by the Federal Reserve Bank of Kansas City, represents the clearest upcoming window for Fed policymakers to reassert control over the policy narrative. Historical precedent shows the event has moved dollar markets substantially; previous symposia have shifted rate-hike and rate-cut narratives in a single speech.
Two paths emerge from that event:
Hartnett’s Jackson Hole framework adds an institutional layer to the technical read: BofA’s strategist has flagged 28 August as a critical inflection date and is monitoring the 10-year Treasury yield alongside the DXY as the leading indicators, rather than equities, for any signal that the policy narrative is about to shift.
- Data continues to soften, but the Fed leans more hawkish than current market pricing: This creates a natural catalyst for a snap-back from sub-98 levels, potentially driving a technical recovery toward the 99.00 region and testing the moving average ceiling above it.
- The tone validates a patient or dovish stance: This would legitimise the current breakdown and open a more durable extension below 98.00 toward the mid-97s and potentially lower, turning the technical break from a chapter into the whole story.

Jackson Hole is not background noise for this trade. It is the event that will determine whether the current breakdown extends or reverses, and you need to size your exposure with that uncertainty priced in. High-conviction technical views that stretch far beyond this week are difficult to justify until the symposium’s tone is known.
Navigating the level map before Jackson Hole sets the next direction
The chart bias is bearish. The oscillators are stretched. The data calendar is loaded. Jackson Hole sits nine days out. These are not competing conclusions; they are a sequenced decision map.
If you are bearish:
- Avoid chasing fresh shorts below 98.75-98.80. The oversold oscillators argue against pressing here.
- Target selling into rallies toward 99.00, reserving the highest-conviction entries for any extension up to 99.70-99.75.
- Use a daily close above 99.70-99.75 as your stop reference. A settlement above that level shifts the read from a pullback sell to a failed breakdown.
If you are looking for a long entry or short-covering opportunity:
- Treat 98.00-97.60 as the key reaction zone. Failure there confirms a deeper structural breakdown.
- Stabilisation or strong intraday reversals in that zone could justify tactical long entries targeting a move back to the 99.00 region.
- Size accordingly: this is a counter-trend trade inside a bearish structure, not a new directional position.
“Trend: bearish. Momentum: wait for a bounce. Near-term focus: Thursday and Friday’s data. Longer-term direction: Jackson Hole decides.”
The combination of a bearish trend, stretched momentum, and a major Fed communication event nine days away means the most disciplined positioning this week is probably smaller than your conviction suggests. That is itself an actionable conclusion.
This article is for informational purposes only and should not be considered financial advice. Investors should conduct their own research and consult with financial professionals before making investment decisions. Past performance does not guarantee future results. All technical levels and scenarios are subject to change based on incoming data and market developments.