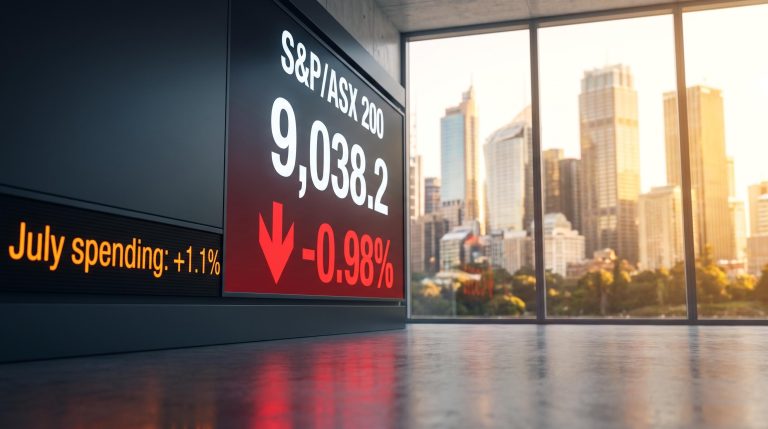
Two of the world’s regional equity markets fell sharply on 27 August for reasons that had nothing to do with each other, and almost nothing to do with the AI-driven optimism lifting Wall Street at the same time.
French political and fiscal uncertainty sent European stocks to their worst single-day loss in roughly a month. French banks shed up to 4.4% as investors priced a messier path to the country’s next presidential election and a budget battle with no clear resolution. On the other side of the world, Australian shares dropped for a second straight session after inflation data and household spending figures forced three of the country’s big four banks to publicly flag at least one more Reserve Bank of Australia (RBA) rate hike.
Here is what drove each market lower, what the data is actually telling you about the risks that matter in each region, and what two simultaneous but unconnected declines reveal about how macro risk travels in a diversified portfolio.
French political risk hits Europe’s banks hardest
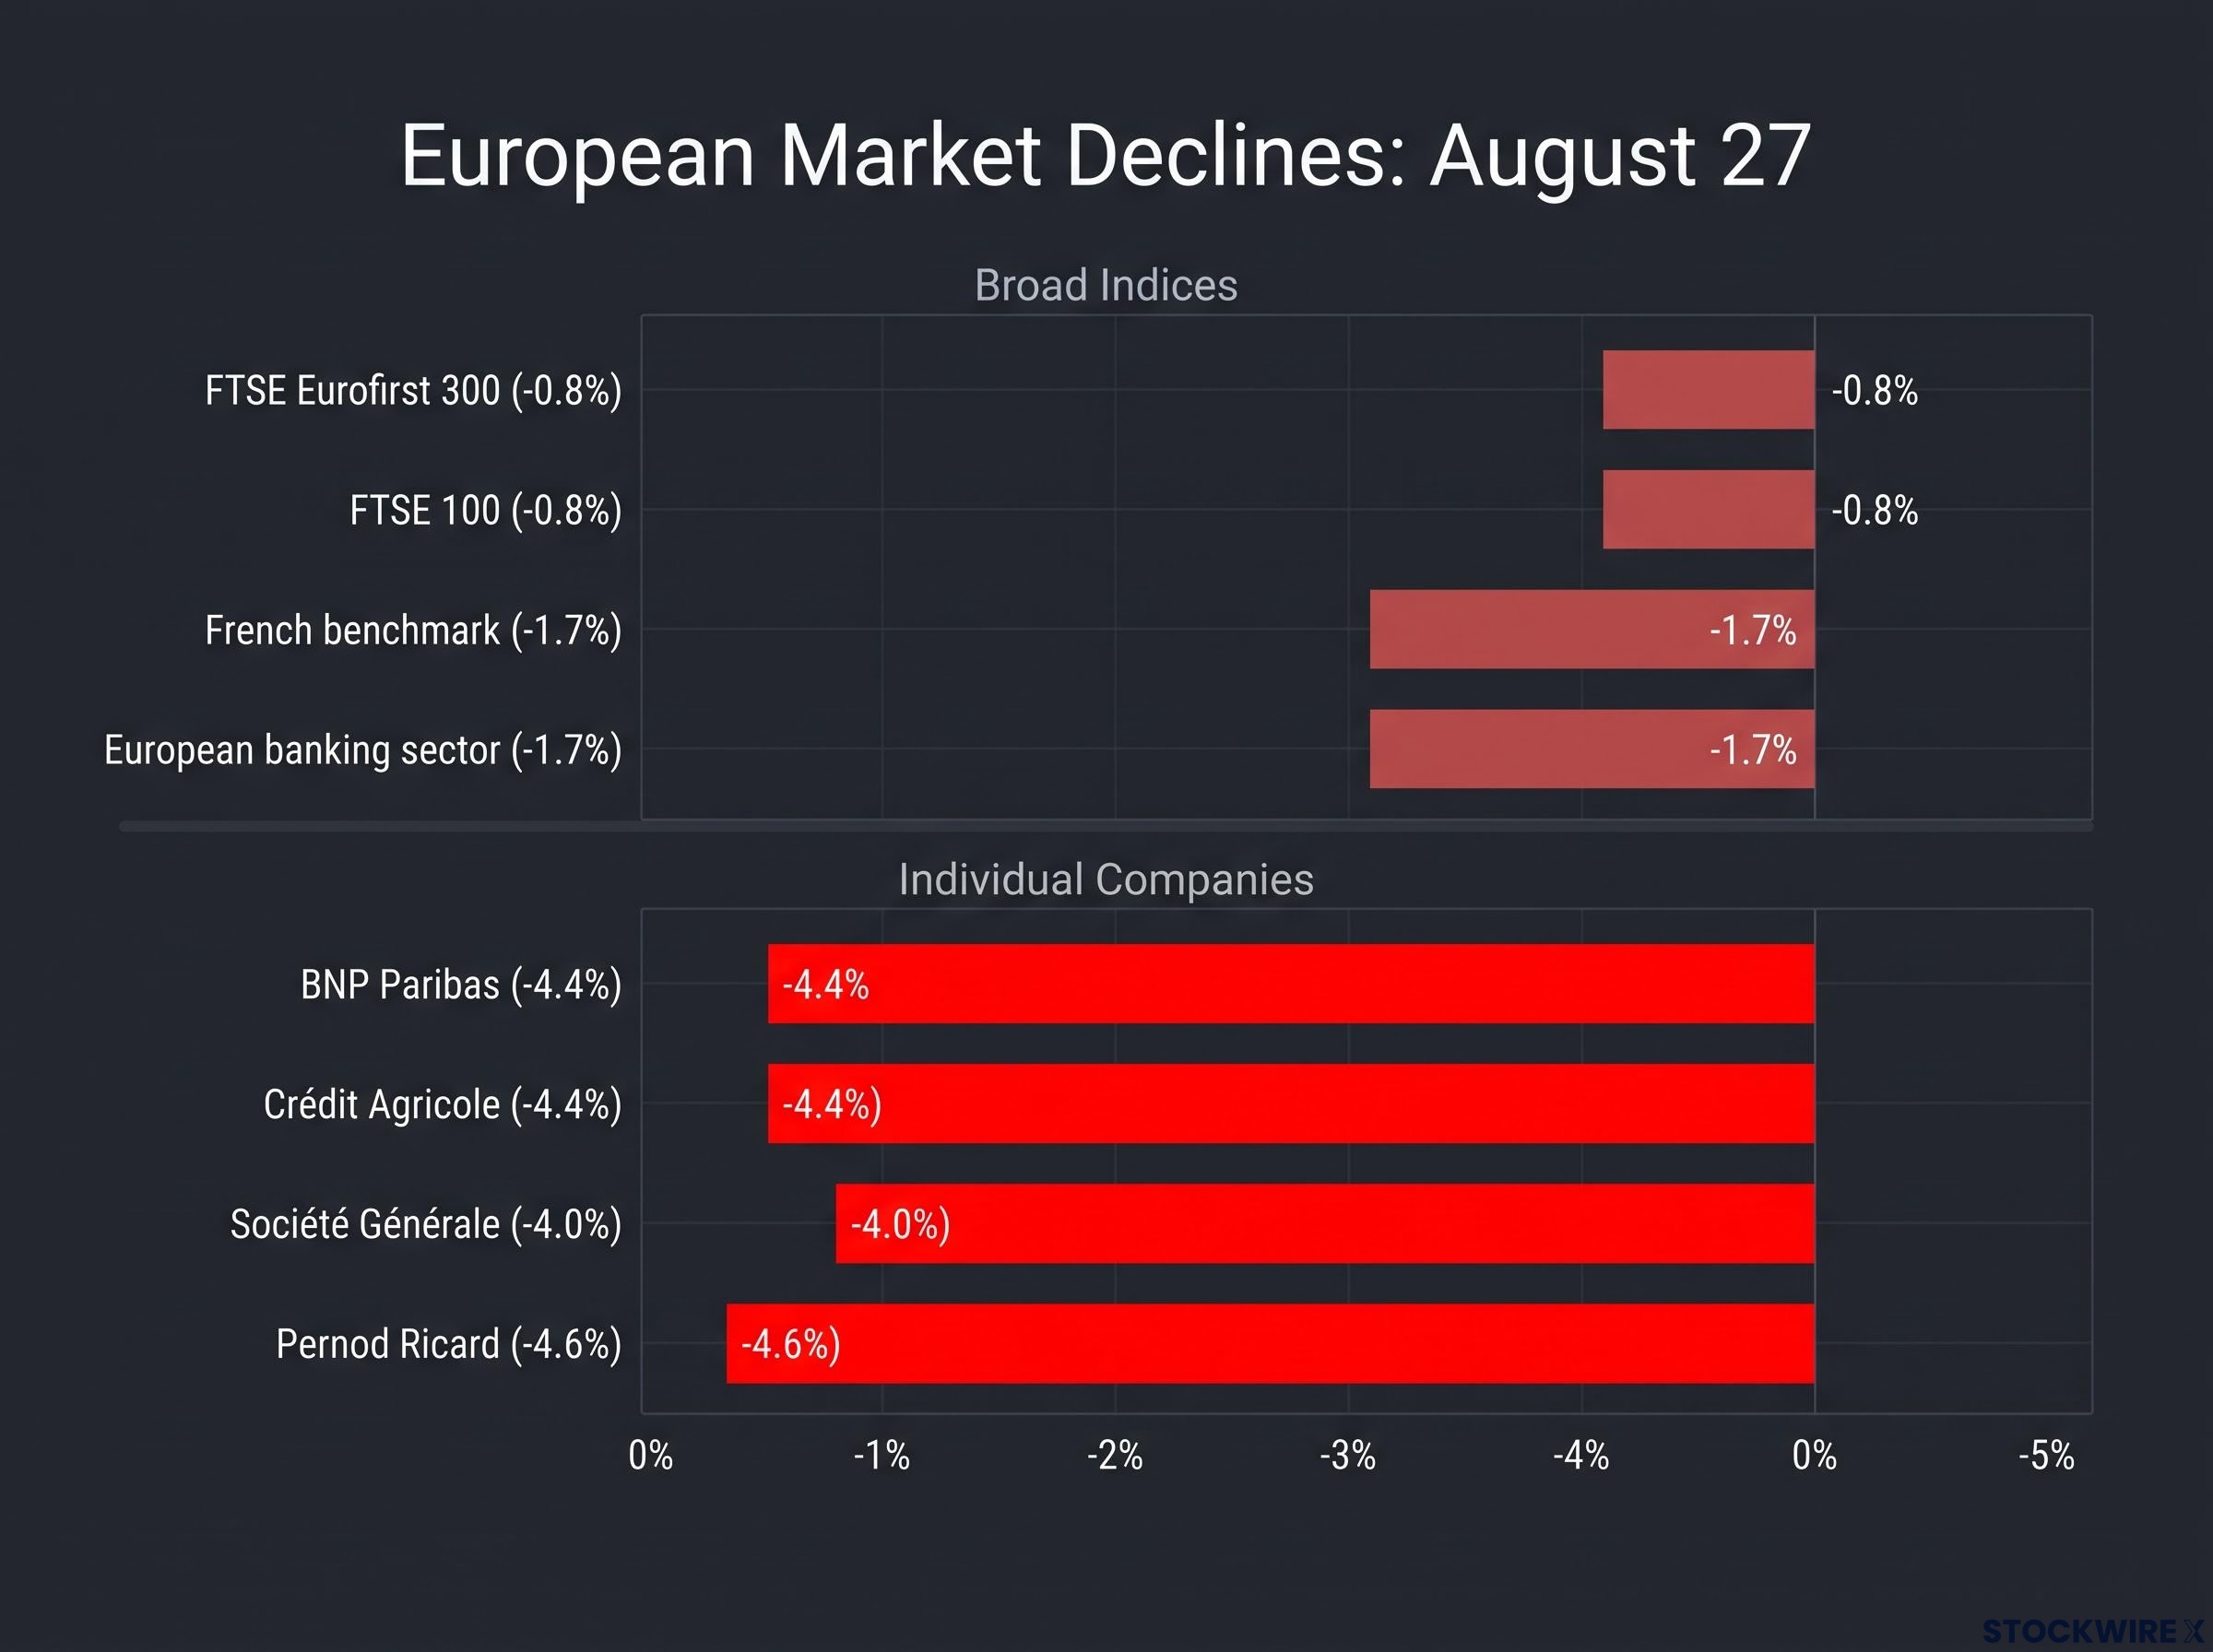
The damage was broad, but France took the brunt. Both the FTSE Eurofirst 300 and the FTSE 100 closed the session down 0.8%. The French benchmark slid 1.7% to a one-month low, a decline mirrored precisely by the European banking sector index, which also finished 1.7% in the red.
| Index | Move |
|---|---|
| FTSE Eurofirst 300 | -0.8% |
| FTSE 100 | -0.8% |
| French benchmark | -1.7% (one-month low) |
| European banking sector | -1.7% |
Within the banking sector, French names led the continent lower. The individual moves tell you the market is not treating this as routine sector rotation:
- BNP Paribas and Crédit Agricole each lost around 4.4% on the session
- Société Générale shed roughly 4%
The driver is not an election result. It is the uncertainty over whether any French government can credibly commit to fiscal consolidation before voters go to the polls. A parliamentary budget battle is sharpening ahead of next year’s presidential election, and parties jockeying for position have given investors very little confidence that the deficit trajectory will improve.
France’s public debt stood at €3.536 trillion at the end of Q1 2026, equivalent to 117.5% of GDP.
That sovereign exposure concentrates risk directly inside the banking sector. French banks hold significant quantities of French government bonds. When the market questions fiscal credibility, it reprices the banks first, making financials the live indicator of how seriously investors are taking the threat. A 4-5% single-session move in major banks without a policy announcement or earnings miss tells you sentiment toward French fiscal credibility is deteriorating faster than official rhetoric suggests.
Institutional positioning in European equities was already a contested debate before the French political selloff, with the June 2026 BofA Global Fund Manager Survey showing the region at its most underweight since December 2024, a backdrop that makes large single-session moves in French names easier to execute without triggering significant buy-side absorption.
Spirits group Pernod Ricard compounded the French market’s losses, with its shares down 4.6% after fiscal year 2026 revenues came in slightly below forecasts, dragged by underperformance in both the US and Chinese markets.
ASX 200 posts back-to-back losses as RBA rate hike bets firm
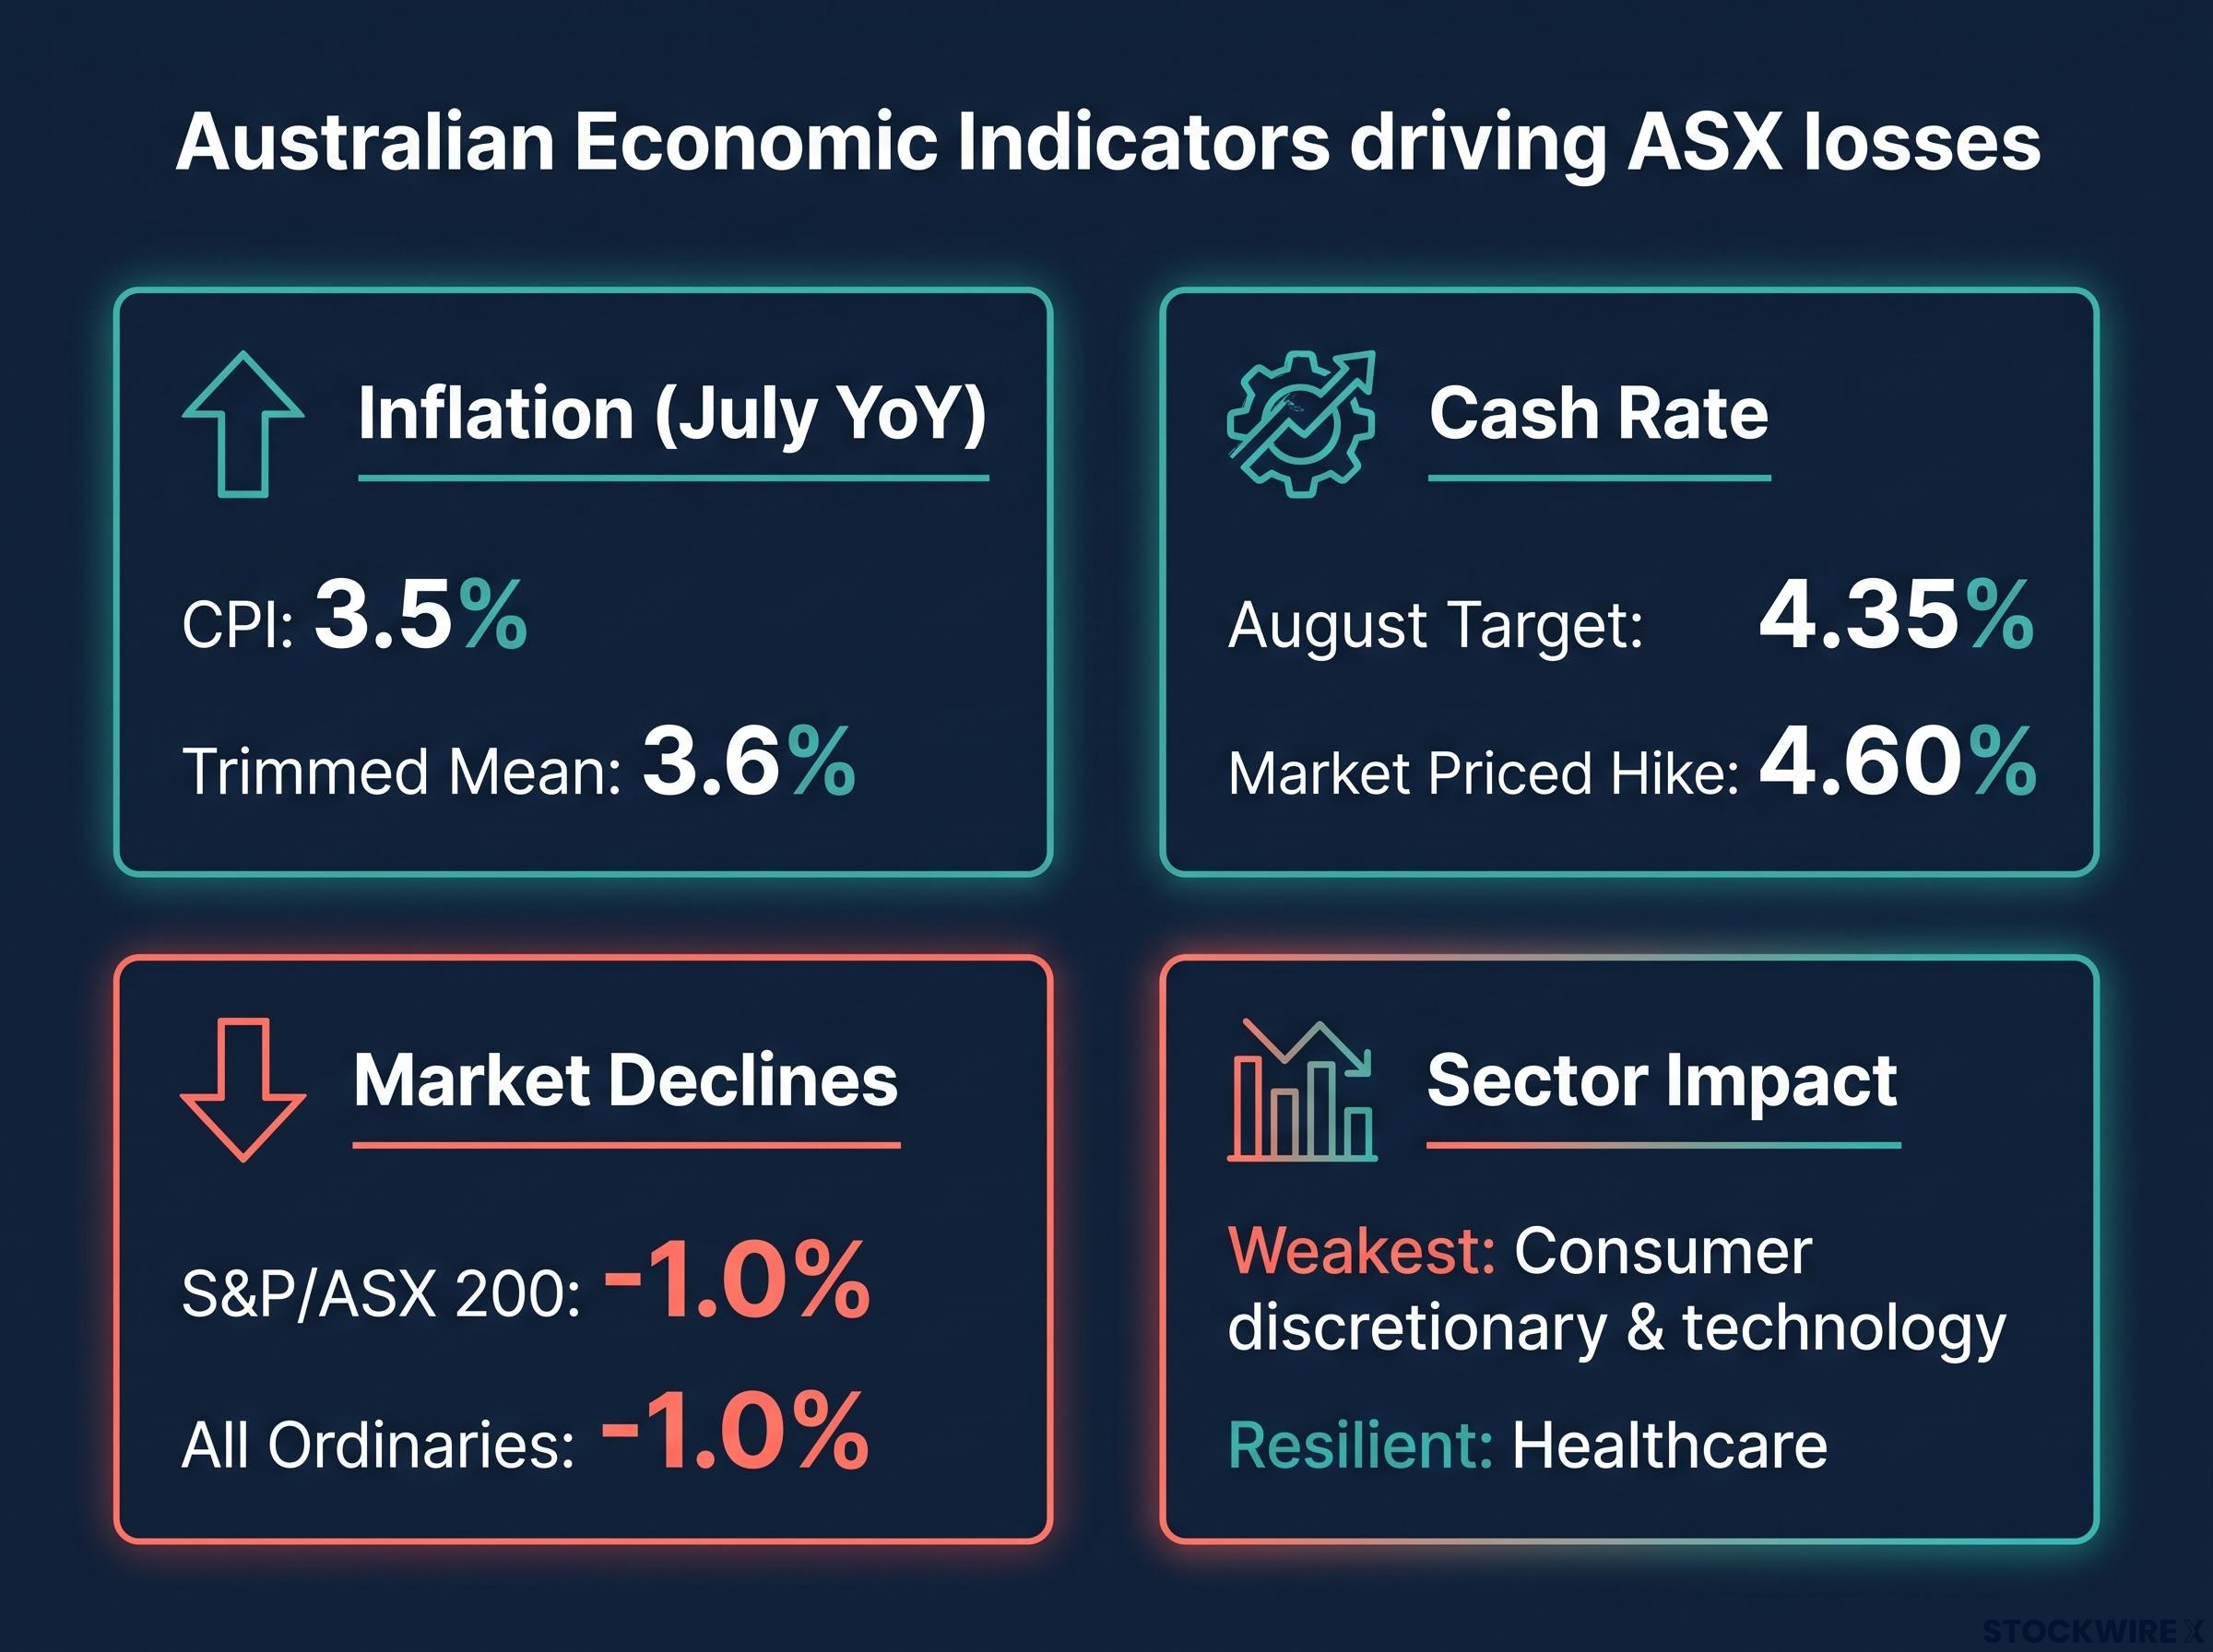
Thursday’s session saw the S&P/ASX 200 give up close to 1%, extending the index’s losing streak to a second consecutive day. Only two of its eleven sectors managed to close in positive territory. The broader All Ordinaries fell a similar 1.0%.
The breadth of the damage mattered as much as the headline number. This was not one sector dragging the index; it was a market absorbing data it did not want to see.
Two releases did the work. July’s consumer price index (CPI), the monthly measure of price changes across the economy, rose 3.5% year-on-year. The trimmed mean, which strips out the most volatile price movements, held steady.
The trimmed mean inflation figure from the June 2026 CPI read came in at 3.6% annually, beating the RBA’s own May forecast of 3.8%, yet the board stopped short of signalling a pause, reinforcing that a single below-forecast print is insufficient to change the rate path when underlying price pressures remain structurally elevated.
Trimmed mean inflation: 3.6% year-on-year. This is the RBA’s preferred measure of underlying price pressure, and it has not budged.
Household spending data came in stronger than expected on the same day, suggesting domestic demand remains resilient enough to justify additional tightening. The combination gave the market no room to argue that inflation was cooling on its own.
The sector pattern confirmed how the market read the data:
- Weakest: Consumer discretionary and technology, which bore the heaviest selling as the most rate-sensitive parts of the market
- Resilient: Healthcare, which stood out as the session’s strongest performing sector
That rotation tells you the market is not selling indiscriminately. It is pricing out the rate-cut thesis and rotating away from the names most exposed to a higher cost of borrowing.
What the big four banks are now forecasting
Three of the big four banks publicly flagged at least one more rate hike following the data. Some forecast a move as early as the late-September meeting; others pointed to November as the more likely timing. The cash rate target stood at 4.35% following the August decision. Money markets shifted to price roughly coin-flip odds of a hike to around 4.60%.
The RBA’s August policy decision held the cash rate target at 4.35%, with the Monetary Policy Board citing persistent inflation and resilient domestic demand as the basis for its unchanged stance, setting the context for market sensitivity to any further upside surprise in price data.
When three of the four major domestic banks simultaneously revise their rate call upward, that is not a fringe forecast. Investors positioned for rate cuts in late 2026 need to reassess whether that thesis still holds. The market is reluctantly adjusting to a higher-for-longer path rather than confirming a new hiking cycle, but the distinction matters less than the direction.
Index futures signalled that ASX shares would open around 0.2% higher on 28 August, a session on which nine companies were scheduled to report results, among them Virgin Australia and Harvey Norman. With reporting season winding into its final stretch, individual earnings could provide short-term price catalysts, but the macro repricing remains the dominant force.
What simultaneous declines in two unconnected markets actually tell you
On the same day, European investors were selling French bank exposure over political and fiscal risk, while Australian investors were rotating out of rate-sensitive stocks on inflation persistence. Neither market cared about the other’s problem. Both fell anyway.
That is the point. Geographic diversification shifts the composition of macro risk; it does not reduce total macro risk exposure. A portfolio spanning Europe and Australia on 27 August would have been exposed to political risk in one region and monetary risk in another simultaneously, which is precisely the scenario diversification is sometimes assumed to prevent.
Country-level selectivity in Europe has produced dramatically different outcomes across the past decade, with Sweden delivering approximately 85% equity returns and the FTSE 100 managing just 17%, a dispersion that a single-session French-driven selloff in European banking indices can easily obscure when investors view the continent as a single allocation.
| Region | Risk type | Key indicator to watch |
|---|---|---|
| Europe (France) | Political-fiscal | OAT-Bund spread; French parliamentary budget votes |
| Australia | Monetary | RBA September and November meetings; monthly CPI prints |
The contrast is structurally different from two correlated selloffs. In France, the risk calendar runs through parliamentary budget proceedings and any widening in the spread between French and German government bond yields. In Australia, the live dates are the RBA’s September and November meetings and the next monthly inflation print. Different triggers, different timelines, different instruments signalling stress.
What changes from here, and what the next signals are
Neither situation has a near-term resolution that is clearly visible. Ongoing volatility is the base case in both regions, not an aberration.
For readers tracking both markets, here are the forward catalysts that matter:
Europe (France):
- French parliamentary budget proceedings ahead of next year’s presidential election
- OAT-Bund spread movements as a real-time gauge of sovereign risk sentiment
- Any shift in party positioning on fiscal consolidation commitments
Australia:
- RBA September meeting minutes and communication on the rate path
- Next monthly CPI print before the November decision
- Final reporting season results from 28-31 August for near-term micro catalysts
The ASX futures recovery of approximately 0.2% for Friday’s open does not resolve the underlying rate concern. It is a one-session technical relief. The real test comes with the next inflation print and the RBA’s September communication.
Wall Street’s AI-driven rally continued running in the background through all of this, providing the contrast that makes both regional stories more instructive. The global market on 27 August did not move as one. It moved in three different directions for three different reasons, and that is the information a diversified investor should be paying attention to.
For investors reassessing how simultaneous but unconnected regional shocks fit within their existing allocation, our dedicated guide to portfolio risk management covers beta-weighted position sizing and volatility targeting as practical frameworks for measuring actual versus intended risk exposure across multi-region portfolios.
This article is for informational purposes only and should not be considered financial advice. Investors should conduct their own research and consult with financial professionals before making investment decisions.
—