China’s economy grew 4.5% year on year in Q3 2026, edging past the 4.4% consensus, but the growth came from exporters and AI-linked factories rather than households. Retail sales rose just 1.1% in September, a figure that complicates any China GDP forecast built on a consumer recovery.
Standard Chartered kept its forecasts unchanged after the release: 4.7% growth for Q4 2026 and 4.6% for the full year. The Q3 result sits at the bottom of Beijing’s 4.5%-5.0% target range for 2026.
For anyone holding China-exposed equities, commodity producers or the Australian dollar, the key question is which parts of the beat are likely to last and which are not. The data gives a fairly clear answer.
Why did China beat GDP expectations when households stayed cautious?
The headline numbers were better than forecast. Data released by the National Bureau of Statistics (NBS) on 19 October 2026 showed quarter-on-quarter growth of 1.2%, above the 1.1% consensus and up from 0.9% in Q2. Growth for the first nine months reached 4.6%.
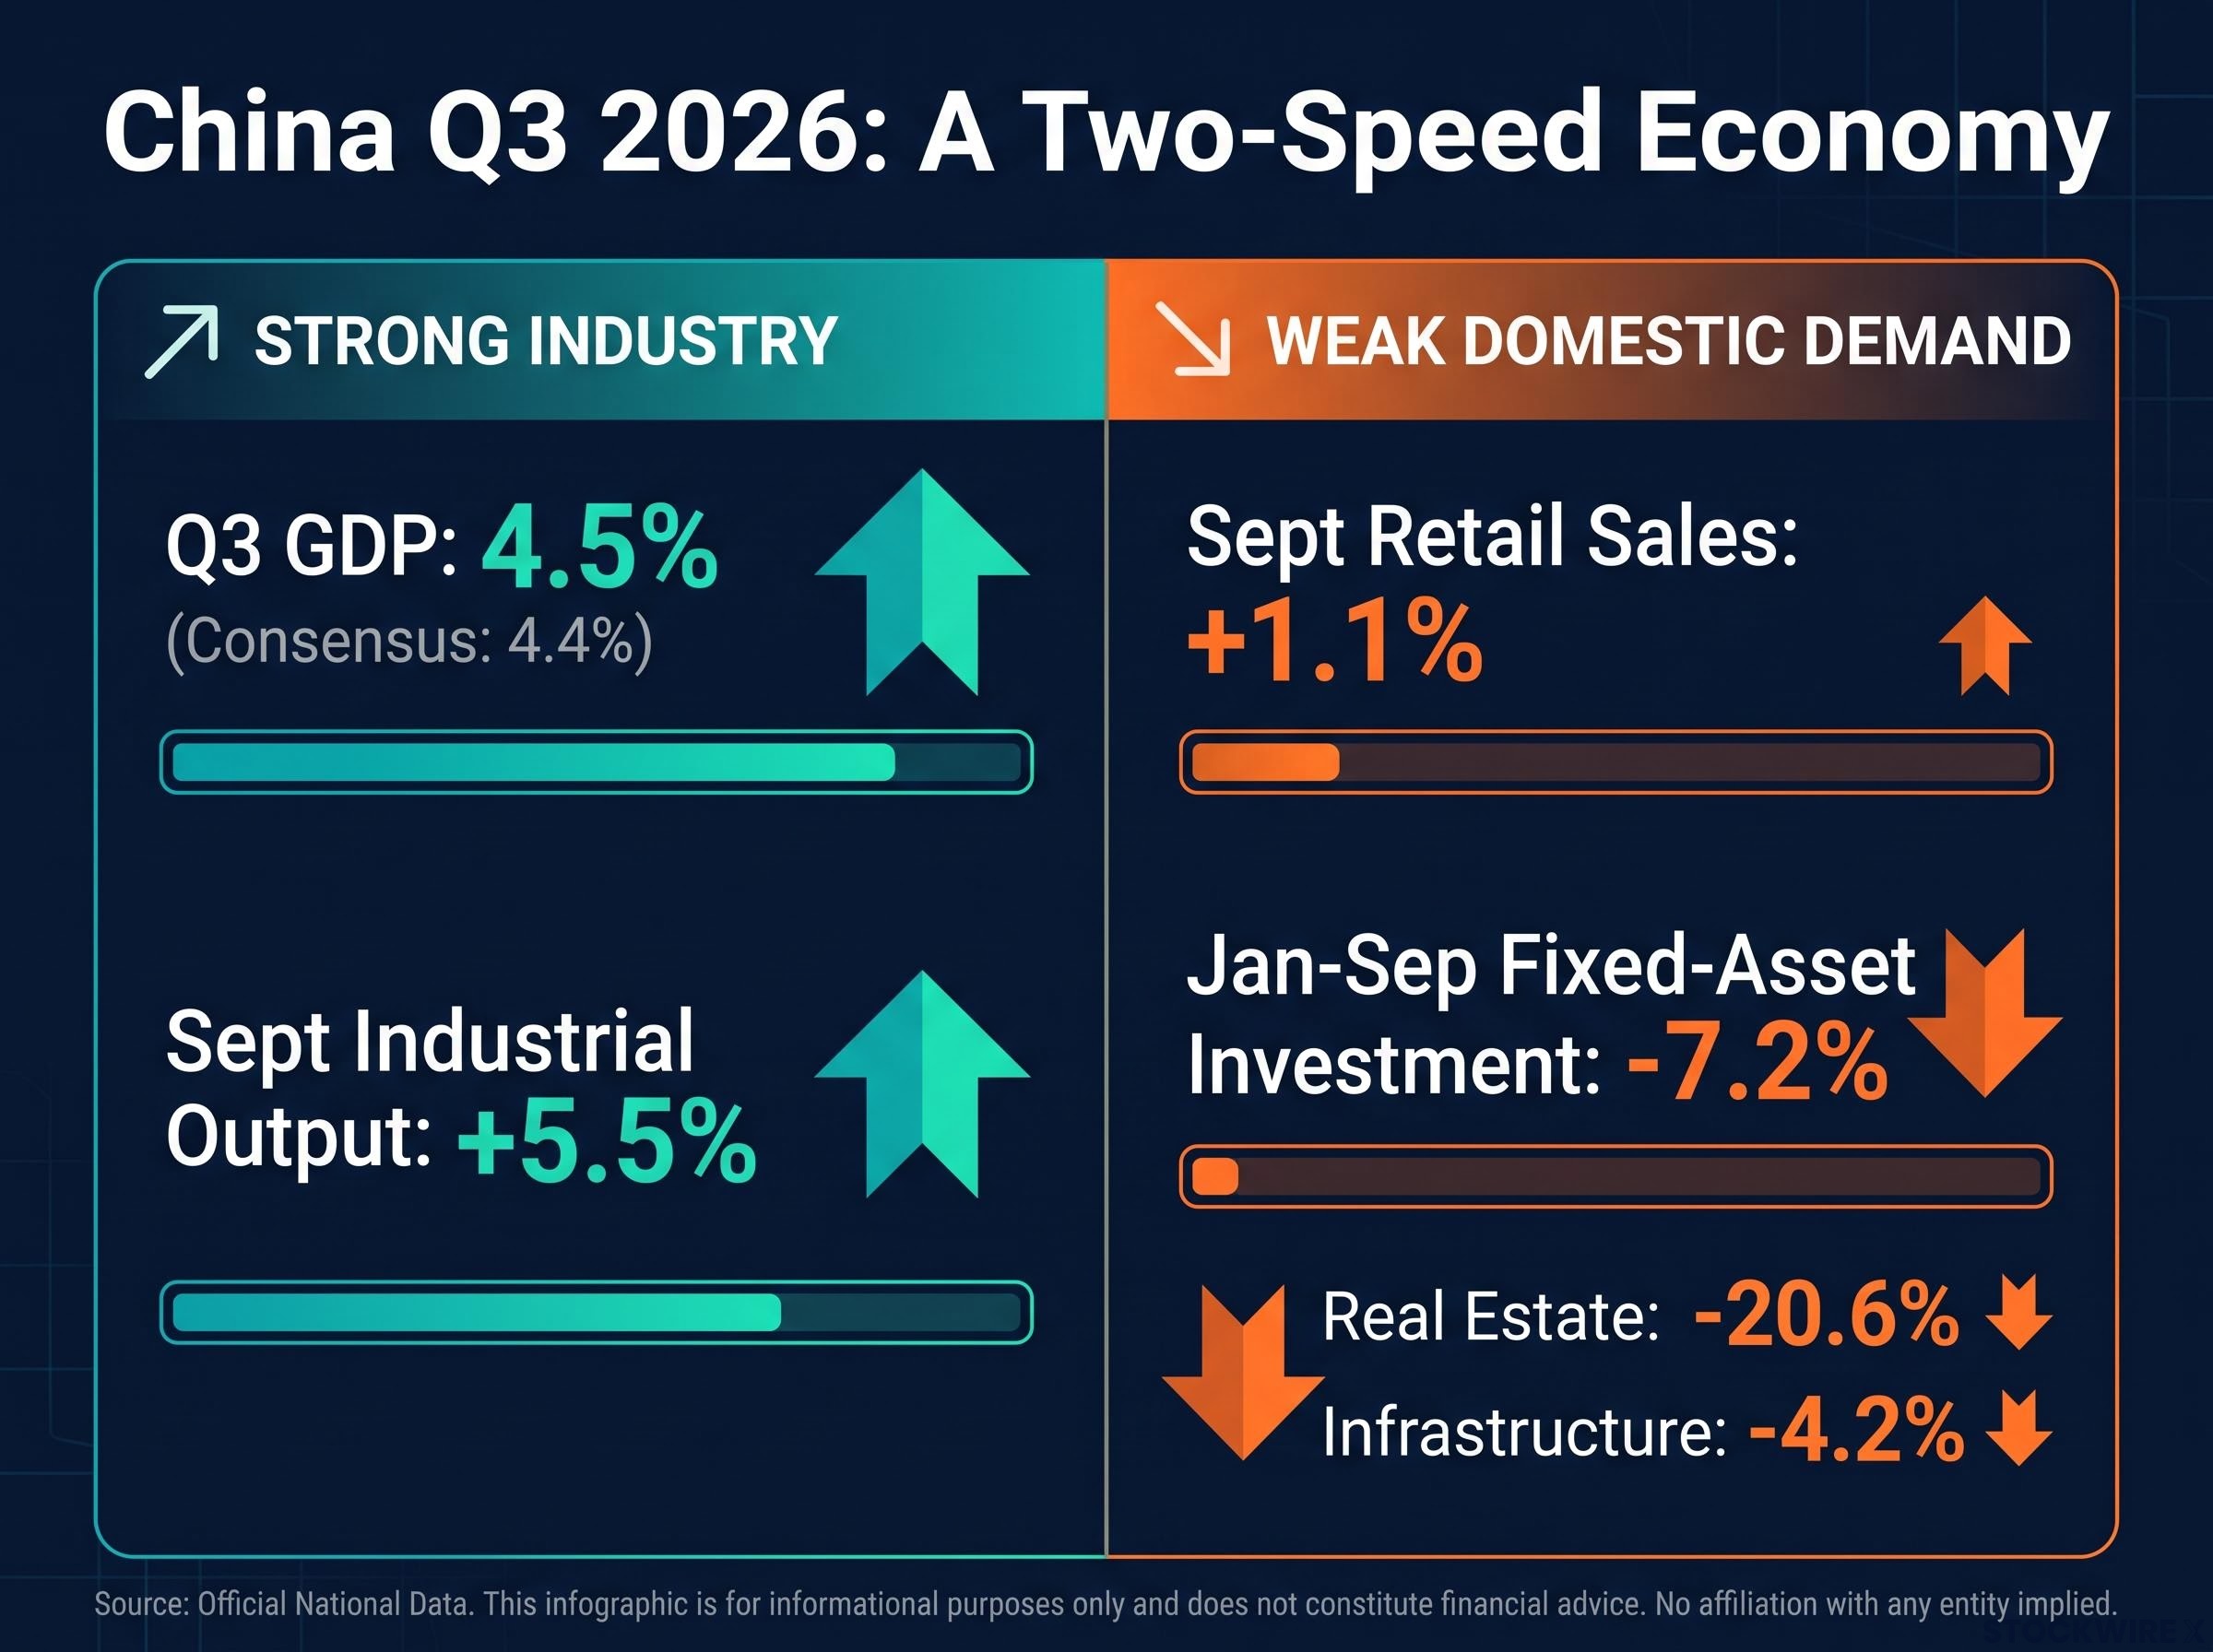
The details are less encouraging. According to the NBS, high-end manufacturing, the digital economy and modern services contributed more than 40% of growth over the nine months. Industrial output rose 5.5% in September, while fixed-asset investment, meaning spending on physical assets such as buildings, machinery and infrastructure, continued to shrink.
| Indicator | Result | Context |
|---|---|---|
| Q3 GDP (y/y) | 4.5% | Consensus 4.4%; Q2 4.3% |
| Industrial output (Sept) | +5.5% | Up from 5.2%; strongest in six months |
| Retail sales (Sept) | +1.1% | Up from 0.4%, off a low base |
| Fixed-asset investment (Jan-Sep) | -7.2% | Real estate -20.6%; infrastructure -4.2% |
The pattern is a two-speed economy. AI hardware, advanced manufacturing and strong technology exports are growing, while household demand, private investment and property remain weak. Hunter Chan, an economist at Standard Chartered, attributed the beat to external demand and AI-linked manufacturing and noted that consumer spending stayed soft.
Analysts at Citi and Bloomberg Economics now treat the K-shaped divergence between technology exports and property-linked consumption as a structural condition rather than a passing phase, entering its sixth year.
Property’s problem Andy Ji of ITC Markets described growth as export- and state-led and said the property sector has “no floor.”
The beat shows that China is winning where it competes globally. A rising GDP figure should not be read as evidence that domestic demand has turned.
What does Standard Chartered’s China GDP forecast assume, and why do prices point in two directions?
Unchanged forecasts can look like a vote of confidence. Standard Chartered’s 4.6% call for 2026 depends on recent policy steps, which the bank says limit downside risk:
- A first-home mortgage-interest subsidy worth one percentage point of annual interest, on loans of up to 1 million yuan principal, for up to five years
- Reallocation of 550 billion yuan in unused local-government debt quotas to ease fiscal pressure and fund infrastructure
- Cheaper credit directed at infrastructure and technology
Announcing these measures is the easy part. Chan said faster fiscal disbursement and clearing hidden local-government debt and arrears matter most. Goldman Sachs warned before the release that local-government financial constraints could delay implementation.
The inflation picture shows why execution matters. Standard Chartered cut its 2026 consumer price index (CPI) forecast to 0.9%, citing weak energy price transmission and ongoing food deflation. It also said producer prices (PPI), which measure what factories charge, could rise more than 3% this year.
Why CPI and PPI are moving apart
September CPI rose 0.9%, with food prices down 1.7% because of an oversupply of pork. Reported figures suggest factory-gate inflation accelerated sharply over the same month, although those PPI details have not been independently confirmed. Three forces are pulling the two measures apart:
- Cost pass-through: Higher oil, coal and metal prices reach factory prices first.
- AI inputs: Demand for semiconductors and data-centre equipment is lifting prices in selected industries.
- Weak demand: Price wars, cheap food and subdued rents stop those costs from reaching consumers.
This is cost-driven reflation at the industrial level, not inflation led by consumers. Margins may be improving in some industrial segments while households have little ability to absorb higher prices, so headline inflation figures are a poor guide to the health of China’s demand. CNN has reported that the International Monetary Fund trimmed its 2026 China forecast to 4.5% because of weak domestic demand.
The widening gap between producer and consumer prices is producing a margin squeeze in domestic-facing sectors, with industrial profit growth slowing from 18.7% in the first half to 11.2% in July.
What does the China data mean for AUD/USD and China-exposed markets?
Currency markets reacted quickly. AUD/USD rose about 0.4-0.5% to roughly 0.6970-0.6980 during Asian trading. Onshore USD/CNY fell to 6.6812, the yuan’s strongest level since July 2022, and the offshore yuan reached a multi-year high.
The yuan outlook points to managed, gradual appreciation rather than a sharp revaluation, with the PBOC setting its fixing at 6.7208 against a market-implied 6.6897.
China was not the only factor. Relatively hawkish commentary from the Reserve Bank of Australia also supported the Australian dollar.
The source of the growth matters as well. Past Chinese stimulus cycles lifted commodity currencies mainly through construction and property. With fixed-asset investment still down 7.2%, this rally rests on factories and exports, which favour copper, aluminium and electricity inputs over commodities tied to construction.
| Market or asset | Likely effect | Key risk |
|---|---|---|
| China tech and manufacturing equities | Supported by AI and export cycle | Weaker global AI investment |
| Consumer and property stocks | Still vulnerable | Property decline continuing |
| Commodity exporters | Uneven benefit, metals over construction inputs | No construction rebound |
| AUD/USD | Modest lift | Tariffs eroding Chinese exports |
| CNY | Strongest since 2022 | Export surge proving temporary |
ANZ sees China becoming more dependent on external demand, which increases its exposure to protectionism and geopolitics.
Limits of exports Michelle Lam of Société Générale cautioned that export expansion has limits without stronger household income and consumption support.
For investors, the Australian dollar’s move looks more like a response to strength in AI manufacturing and exports than a broad China reflation trade. Its durability depends on global tech demand and trade policy, not on a recovery in Chinese consumer spending. Tariffs, European restrictions or a slowdown in AI investment could reverse the move even if Beijing meets its target.
What the beat settles, and what it leaves open
The Q3 result and Standard Chartered’s unchanged outlook suggest the 2026 target range is within reach. The quality of that growth is still uncertain. Three variables are worth watching:
- Fiscal disbursement: whether the 550 billion yuan in reallocated quotas actually reaches projects
- Retail sales and property data: any sign that households are spending again and real-estate investment is bottoming out
- Export resilience: how technology shipments hold up against trade barriers and changes in global AI spending
If exports weaken before consumption recovers, current forecasts could prove optimistic.
For readers wanting to see why weak household borrowing limits the stimulus story, our full explainer on China’s credit miss shows how August loans fell far short of forecasts.
This article is for informational purposes only and should not be considered financial advice. Investors should conduct their own research and consult with financial professionals before making investment decisions. Past performance does not guarantee future results. Financial projections are subject to market conditions and various risk factors.