Micron trades at roughly 5x forward earnings, a multiple usually reserved for businesses the market expects to shrink. Yet the contracts memory chip stocks are now signing point the other way, towards earnings that are more predictable than at any point in the sector’s history.
The overnight session sharpened that tension. SanDisk rose 5.4%, SK Hynix gained 4.7% and Micron added 3.0%, while China’s CXMT fell about 8%. If a business is supposedly getting safer, a multiple that low should make you ask whether “cheap” means what you think it does.
The driver is a change in how memory gets sold. Artificial intelligence (AI) demand is pushing suppliers away from spot-style sales and towards multi-year, custom agreements. The market is now deciding whether that justifies a different valuation, and the cost of getting it wrong runs both ways: treat a cyclical sector as permanently fixed and you buy the peak, or treat it as permanently doomed and you miss a genuine change.
This analysis gives you a way to judge whether the new contracts deserve a higher multiple, and the checks that separate durable earnings from peak-cycle earnings.
Why are AI buyers rewriting how memory gets sold?
The overnight rally was the visible part. The Nasdaq climbed 1.1% and the S&P 500 rose 0.4%, with memory names leading the tech rebound even as most S&P sectors slipped.
The price move is the least interesting part of the story. Underneath it, the sector is quietly rebuilding its commercial model.
Four forces are behind the shift. AI memory such as high-bandwidth memory (HBM), stacked DRAM built to sit alongside AI processors, is designed into specific systems and is hard to substitute. Hyperscalers need guaranteed allocation so suppliers cannot redirect capacity to the highest bidder, suppliers need financing and visibility for expensive new capacity, and products are increasingly co-engineered, as with Micron’s custom HBM work with Nvidia.
| Company | Term and coverage | Protections | Disclosed figures |
|---|---|---|---|
| SK Hynix | About 10 customers, roughly five-year terms | Purchase commitments, pricing structures, possible deposits | Negotiations completed July 2026 |
| Micron | 26 agreements (up from 16), about 35% of revenue through 2030 | Take-or-pay, price bands, customer financial commitments | Custom HBM with Nvidia |
| SanDisk | Five agreements, terms up to five years | Guarantees, prepayments, fixed then floating pricing | About US$42B minimum remaining revenue on three deals; US$11B+ guarantees; about US$400M prepayments |
Take-or-pay means the buyer pays for a minimum volume whether or not it takes delivery. A price band sets a floor and ceiling on what the buyer pays.
Hyperscalers have been moving towards deposit-backed supply agreements running three to five years, which treats memory as strategic infrastructure rather than a commodity bought on demand and explains why suppliers can now finance new capacity.
What each side gets from a multi-year deal
Buyers get allocation assurance. Suppliers get deposits and minimum volumes that de-risk capital spending, which matters because new HBM and advanced DRAM capacity takes years to bring online.
SanDisk’s structure adds a twist: pricing is fixed for an initial period and floating later, so it keeps some upside if NAND prices rise. That matters because pricing is still climbing, but more slowly. TrendForce expects Q4 2026 conventional DRAM contract prices up 10-15% quarter on quarter and NAND up 15-20%, a gentler pace than earlier in the year.
The distinction you should hold onto is between contracted volume and contracted economics. Disclosed coverage tells you how much revenue is predictable, which is a far better valuation input than a one-night price jump.
When big ASX news breaks, our subscribers know first
How do you value a cyclical stock when its contracts change?
A low forward price-to-earnings (P/E) ratio, share price divided by expected earnings per share, usually looks like a bargain. In cyclical industries it often signals the opposite.
When earnings are at a peak, the denominator is swollen and the multiple shrinks. A 2026 valuation commentary warned that memory shares often look cheapest just before earnings peak, because high prices attract new capacity and supply eventually overshoots demand.
The supply response has historically ended memory upcycles, and SK Hynix’s plan to lift production capacity by 60% by 2030 shows how quickly high margins convert into expansion that eventually overshoots demand.
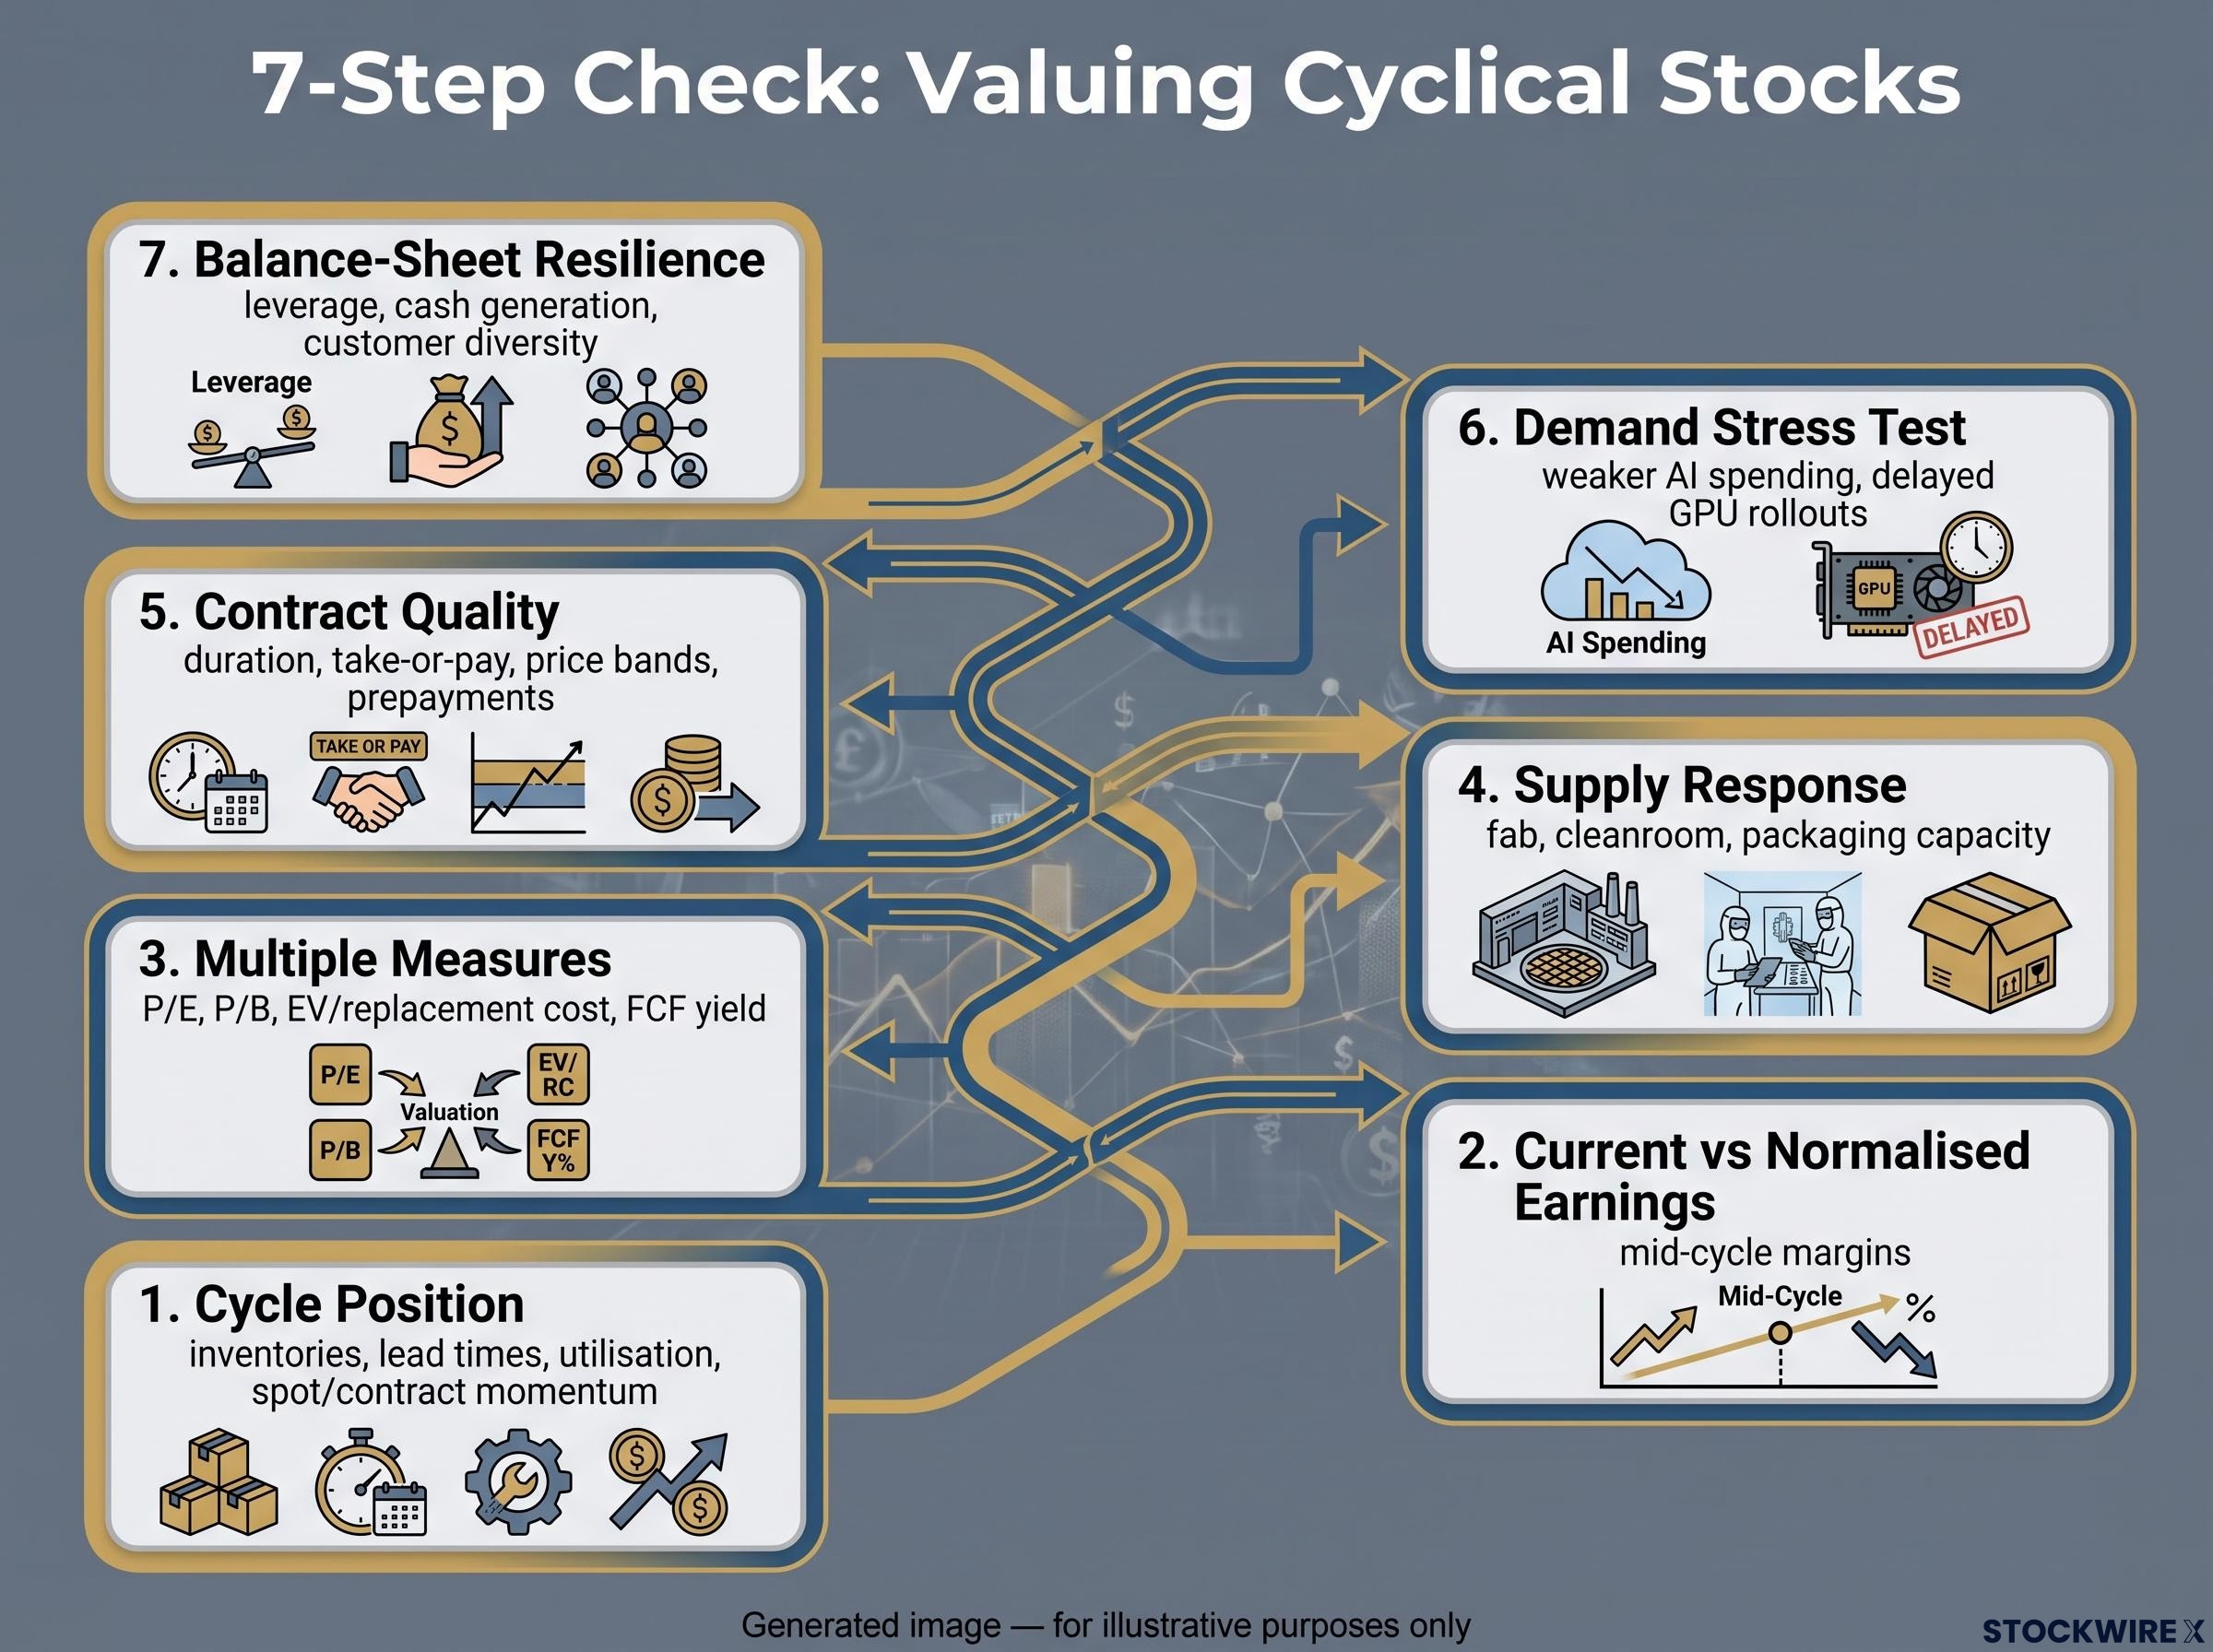
The fix is to separate current earnings from normalised earnings, meaning what the business might earn in an average year across the whole cycle. This seven-step check makes that repeatable:
- Cycle position: inventories, lead times, utilisation, spot and contract-price momentum.
- Current vs normalised earnings: estimate mid-cycle margins.
- Multiple measures: cross-check P/E with price-to-book, enterprise value to replacement cost and free-cash-flow yield.
- Supply response: announced fab, cleanroom and packaging capacity, and when it ships.
- Contract quality: duration, take-or-pay, price bands, prepayments, cancellation rights, customer concentration.
- Demand stress test: weaker AI spending, delayed GPU rollouts, more efficient architectures.
- Balance-sheet resilience: leverage, cash generation, customer diversity.
Contracted volume vs contracted economics A five-year agreement with enforceable minimums, guarantees and price floors protects earnings. A non-binding intent to buy protects very little, however long its stated term.
What precedents from other industries show
Memory is not the first industry to try this. Semiconductor foundries take wafer capacity reservations, airlines and aerospace suppliers rely on long-term commitments with deposits, chemicals and industrial gas producers use take-or-pay deals, and data-centre operators lock in power and colocation contracts.
In each case, contracts delivered visibility. In each case, pricing resets or overbuilding still hit suppliers eventually.
That is the lesson for you. Read the contract terms before you credit a re-rating, and the same framework works on any cyclical sector changing how it sells.
Does Citi’s view on CXMT really protect incumbents until 2028?
The bullish thesis has a reassuring competitive leg. Citi reportedly noted that export restrictions limit CXMT’s access to advanced chipmaking equipment, making next-generation mass production unlikely before 2028.
That would hand Micron, SK Hynix and Samsung a multi-year head start. The sourcing, however, is thin: the specific Citi note could not be independently located, and the claim rests on the original report of Citi’s comment.
CXMT’s own numbers are far less reassuring for incumbents. Its shares fell about 8% on 19 October 2026 (the original source cited 8.9%, while Investing.com reported roughly 7.6-8.0%), but not because results were weak.
| Preliminary Q3 2026 item | Figure | Source |
|---|---|---|
| Revenue forecast | RMB114.7B-119.7B | Seoul Economic Daily, 18 Oct |
| Net profit forecast | RMB53.395B-54.895B | Seoul Economic Daily, 18 Oct |
| Sequential profit growth | 1-4% vs 113% in Q2 | Investing.com, 19 Oct |
| Nine-month net profit | RMB131B-132.5B vs a RMB5.28B loss a year earlier | Investing.com, 19 Oct |
Preliminary, not final These are company forecasts. CXMT’s final Q3 results are due on 31 October 2026.
Investors sold on slowing sequential growth, not on weakness. A company swinging from a loss to more than RMB130B in nine-month profit is already a serious commercial force.
What this tells you is that export controls may buy incumbents time at the leading edge, but they do not stop a fast-growing rival from adding pressure in conventional DRAM and NAND, exactly where oversupply risk sits.
Is Micron’s forward P/E near 5 a bargain or a peak-earnings trap?
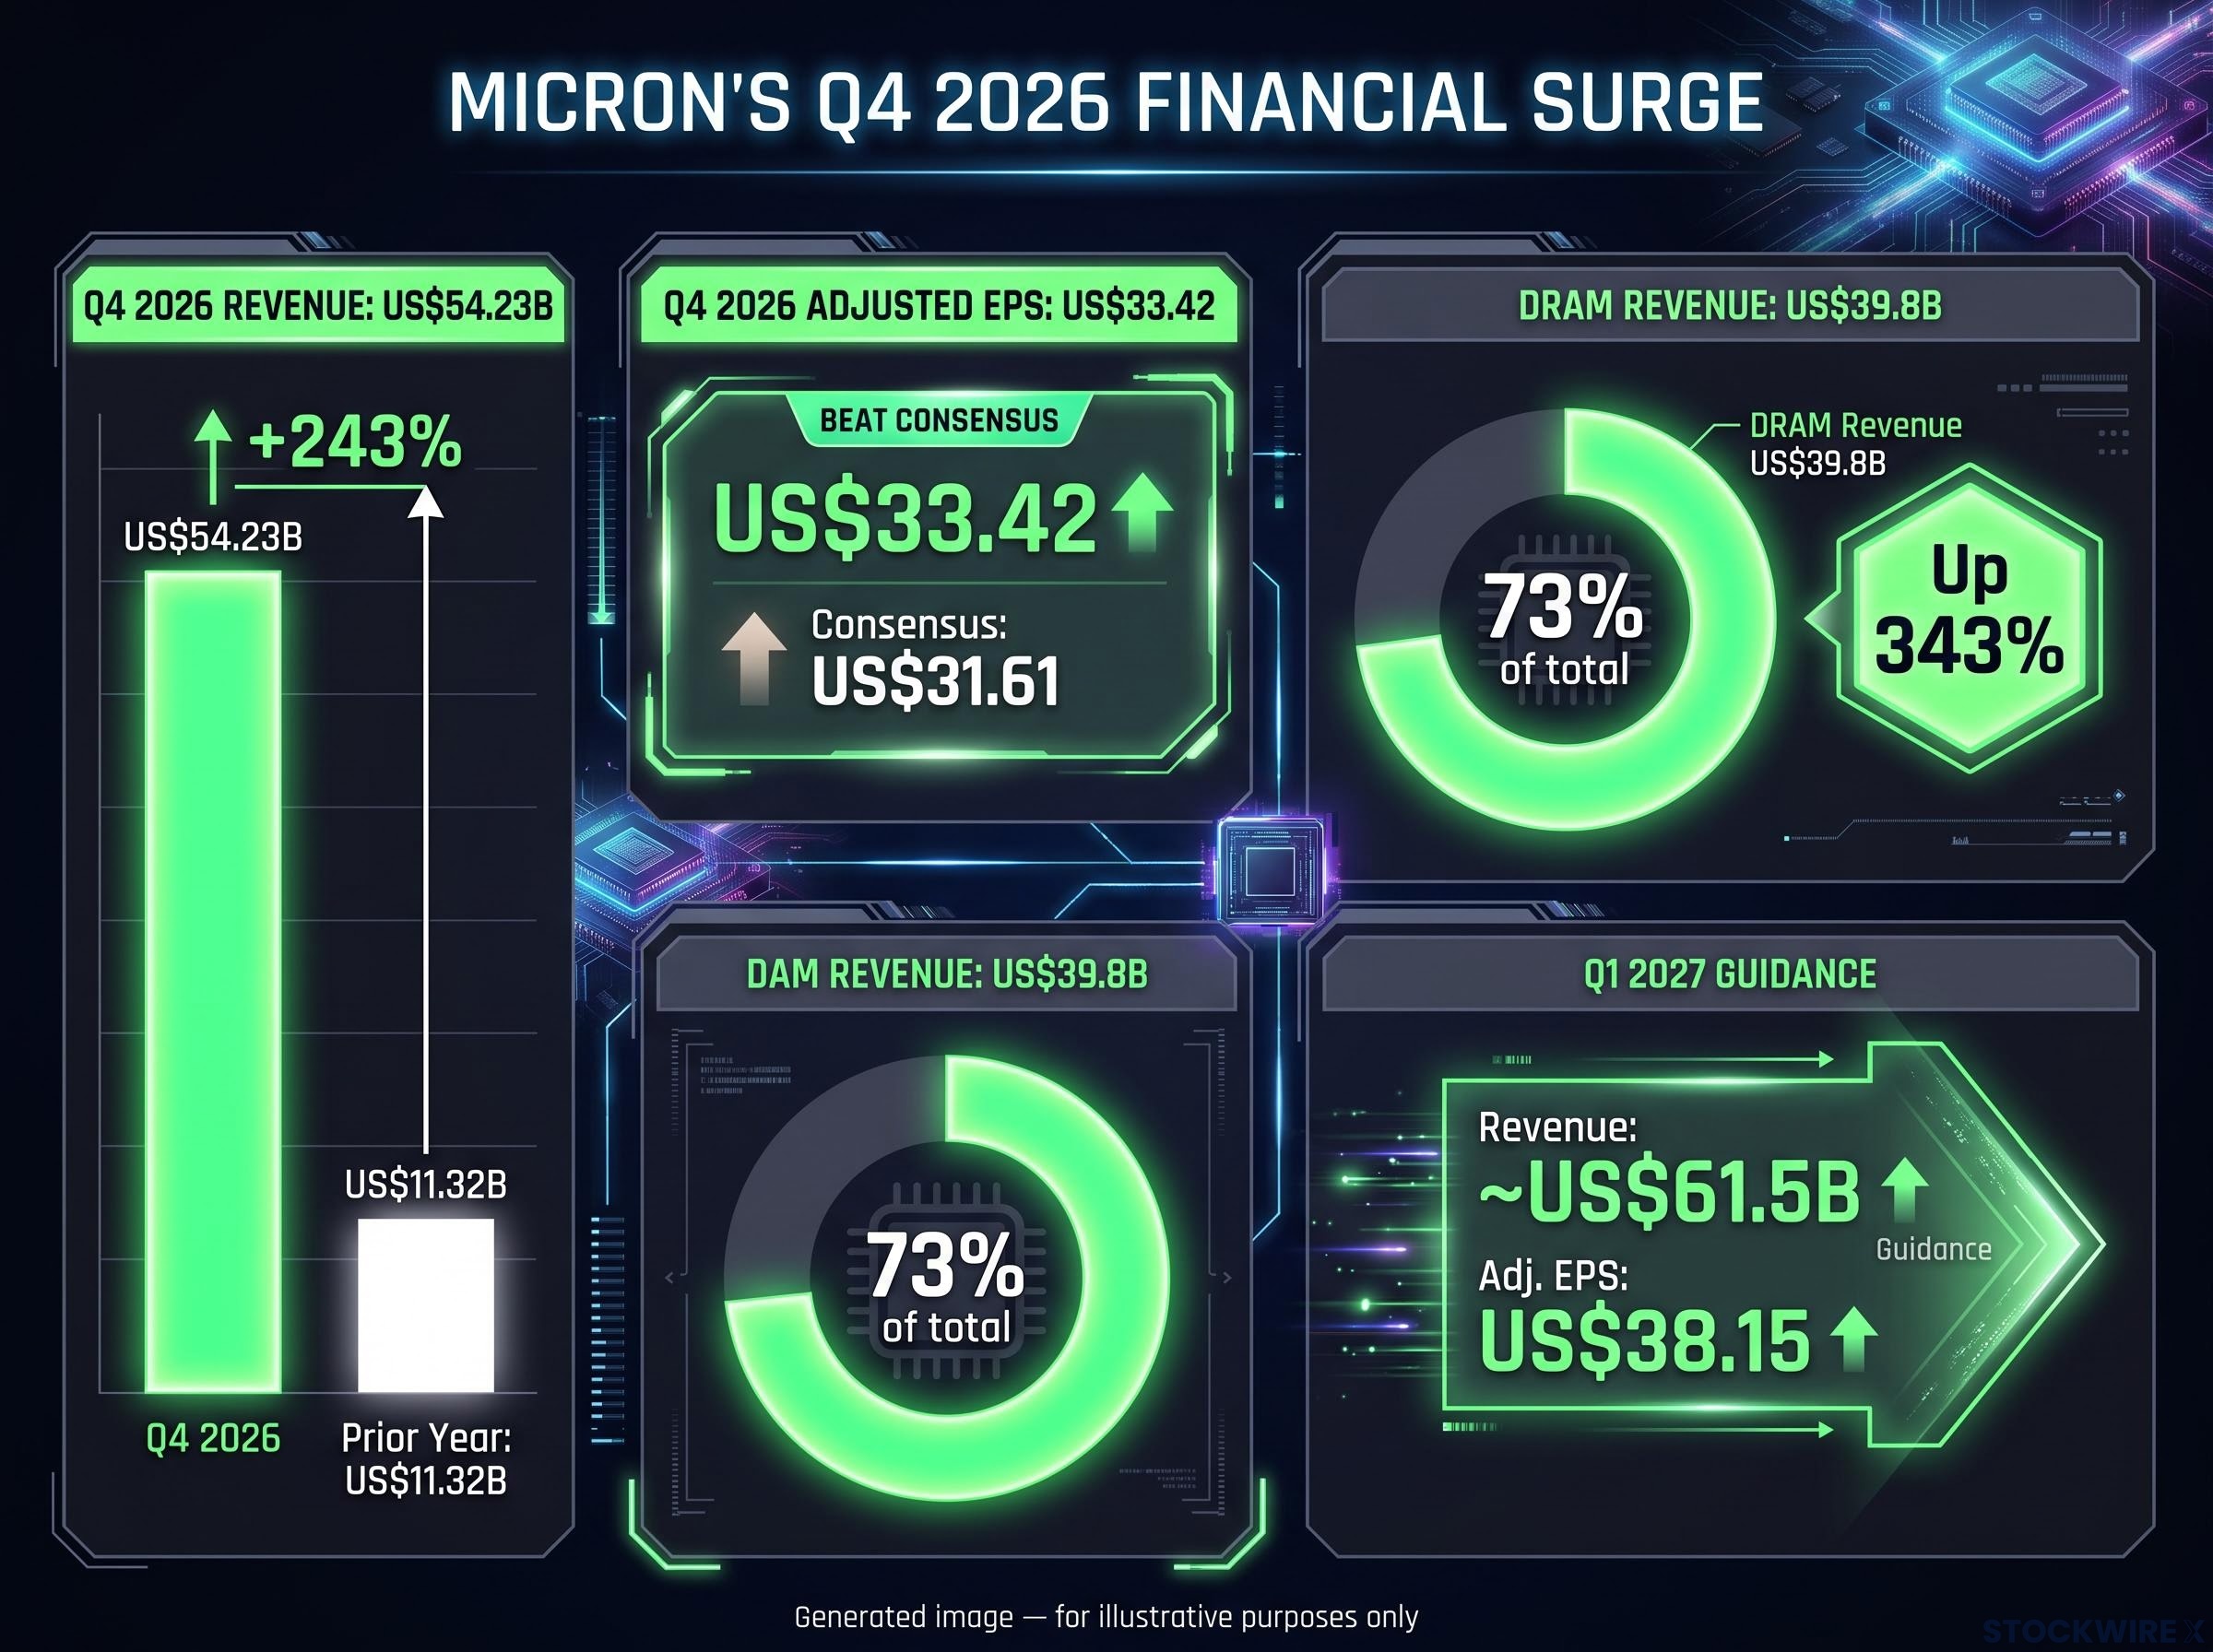
Micron’s latest numbers are extraordinary. Fiscal Q4 2026 revenue reached US$54.23B, against US$11.32B a year earlier, with adjusted earnings per share of US$33.42 beating the US$31.61 consensus. DRAM revenue hit US$39.8B, up 343% and 73% of the total.
Guidance for fiscal Q1 2027 points to about US$61.5B in revenue and adjusted EPS of US$38.15.
Why the multiple looks low
The data needs careful handling. The original source cited a forward P/E of 5.2 and a share price down about 13.4% over the year; StockAnalysis showed 4.98x on 18 October, while MarketBeat recorded a 12-month gain of 357.78% on 19 October. The low-multiple direction is consistent, but the 12-month figures conflict sharply, likely reflecting different dates and price bases.
That low multiple has two readings. It may be a peak-denominator effect, or it may reflect genuine doubt about whether contracts and AI demand will last.
| Structural-change view | Continuing-cycle view | |
|---|---|---|
| Evidence | Co-designed HBM, multi-year agreements, management view (August 2026) that tightness could persist beyond 2027 | High prices attract capacity from Micron, SK Hynix, Samsung and Chinese producers |
| Implication | Elevated earnings last longer, justifying a higher multiple | Today’s earnings are a peak; the 5x multiple is a trap |
Both views carry weight. The balanced reading is that AI has changed the duration and composition of the cycle without abolishing it.
UBS’s free cash flow yield estimate of 29% for 2027-2030 illustrates the risk, since it assumes near-peak pricing holds for four years, something the memory cycle has rarely allowed.
What could break the thesis
- AI-spending slowdown: the main unhedged exposure, since a data-centre pause could strand committed capacity.
- Capex overbuilding: collective expansion after years of high margins.
- Conventional oversupply: strong HBM alongside glutted DRAM and NAND.
- Customer concentration: a handful of hyperscalers and GPU makers drive demand.
- Chinese capacity: CXMT’s growth adds supply.
- Contract limits: take-or-pay protects volumes, not peak prices.
For you, 5x only becomes a bargain if the contracted 35% of revenue through 2030 proves durable and the remaining 65% does not drag the average down. Past performance does not guarantee future results, and projections remain subject to market conditions.
What the new contracts change for memory valuations, and what they leave open
Multi-year agreements raise visibility and soften the cycle’s swings. They do not remove it.
Three signposts will tell you which reading is winning:
- The share of revenue under enforceable agreements, starting with Micron’s 35%.
- The pace of announced DRAM and NAND capacity additions.
- CXMT’s final Q3 results on 31 October 2026.
The opportunity depends on contract quality and normalised earnings, not the headline multiple. A low P/E backed by binding minimums and price floors is a different proposition from one resting on peak pricing alone.
Investors wanting a de-risking sequence for cyclical chip holdings can use our detailed coverage of the semiconductor supply wave, which sets out a five-indicator framework for trimming positions before multiples compress.
This article is for informational purposes only and should not be considered financial advice. Investors should conduct their own research and consult with financial professionals before making investment decisions.