Brent crude fell $4.64 in a single session on 23 May 2026, a 4.48% drop to $98.90 per barrel, as hopes for a US-Iran nuclear agreement collapsed and fears over Middle East shipping risk surged back to the surface. The selloff represents more than one day of poor headlines. It captures a market forced to reprice the probability of a diplomatic resolution that traders had partially baked into oil prices over the preceding weeks. With the Strait of Hormuz handling roughly a fifth of the world’s seaborne crude, any signal of prolonged tensions carries outsized consequences for global supply chains.
What follows explains what broke down in the negotiations, why the Strait of Hormuz matters so much to energy pricing, what cross-asset signals reveal about how markets are interpreting the risk, and what leading analysts see ahead for crude under this geopolitical overhang.
Brent and WTI both shed more than 4% as diplomatic hopes evaporate
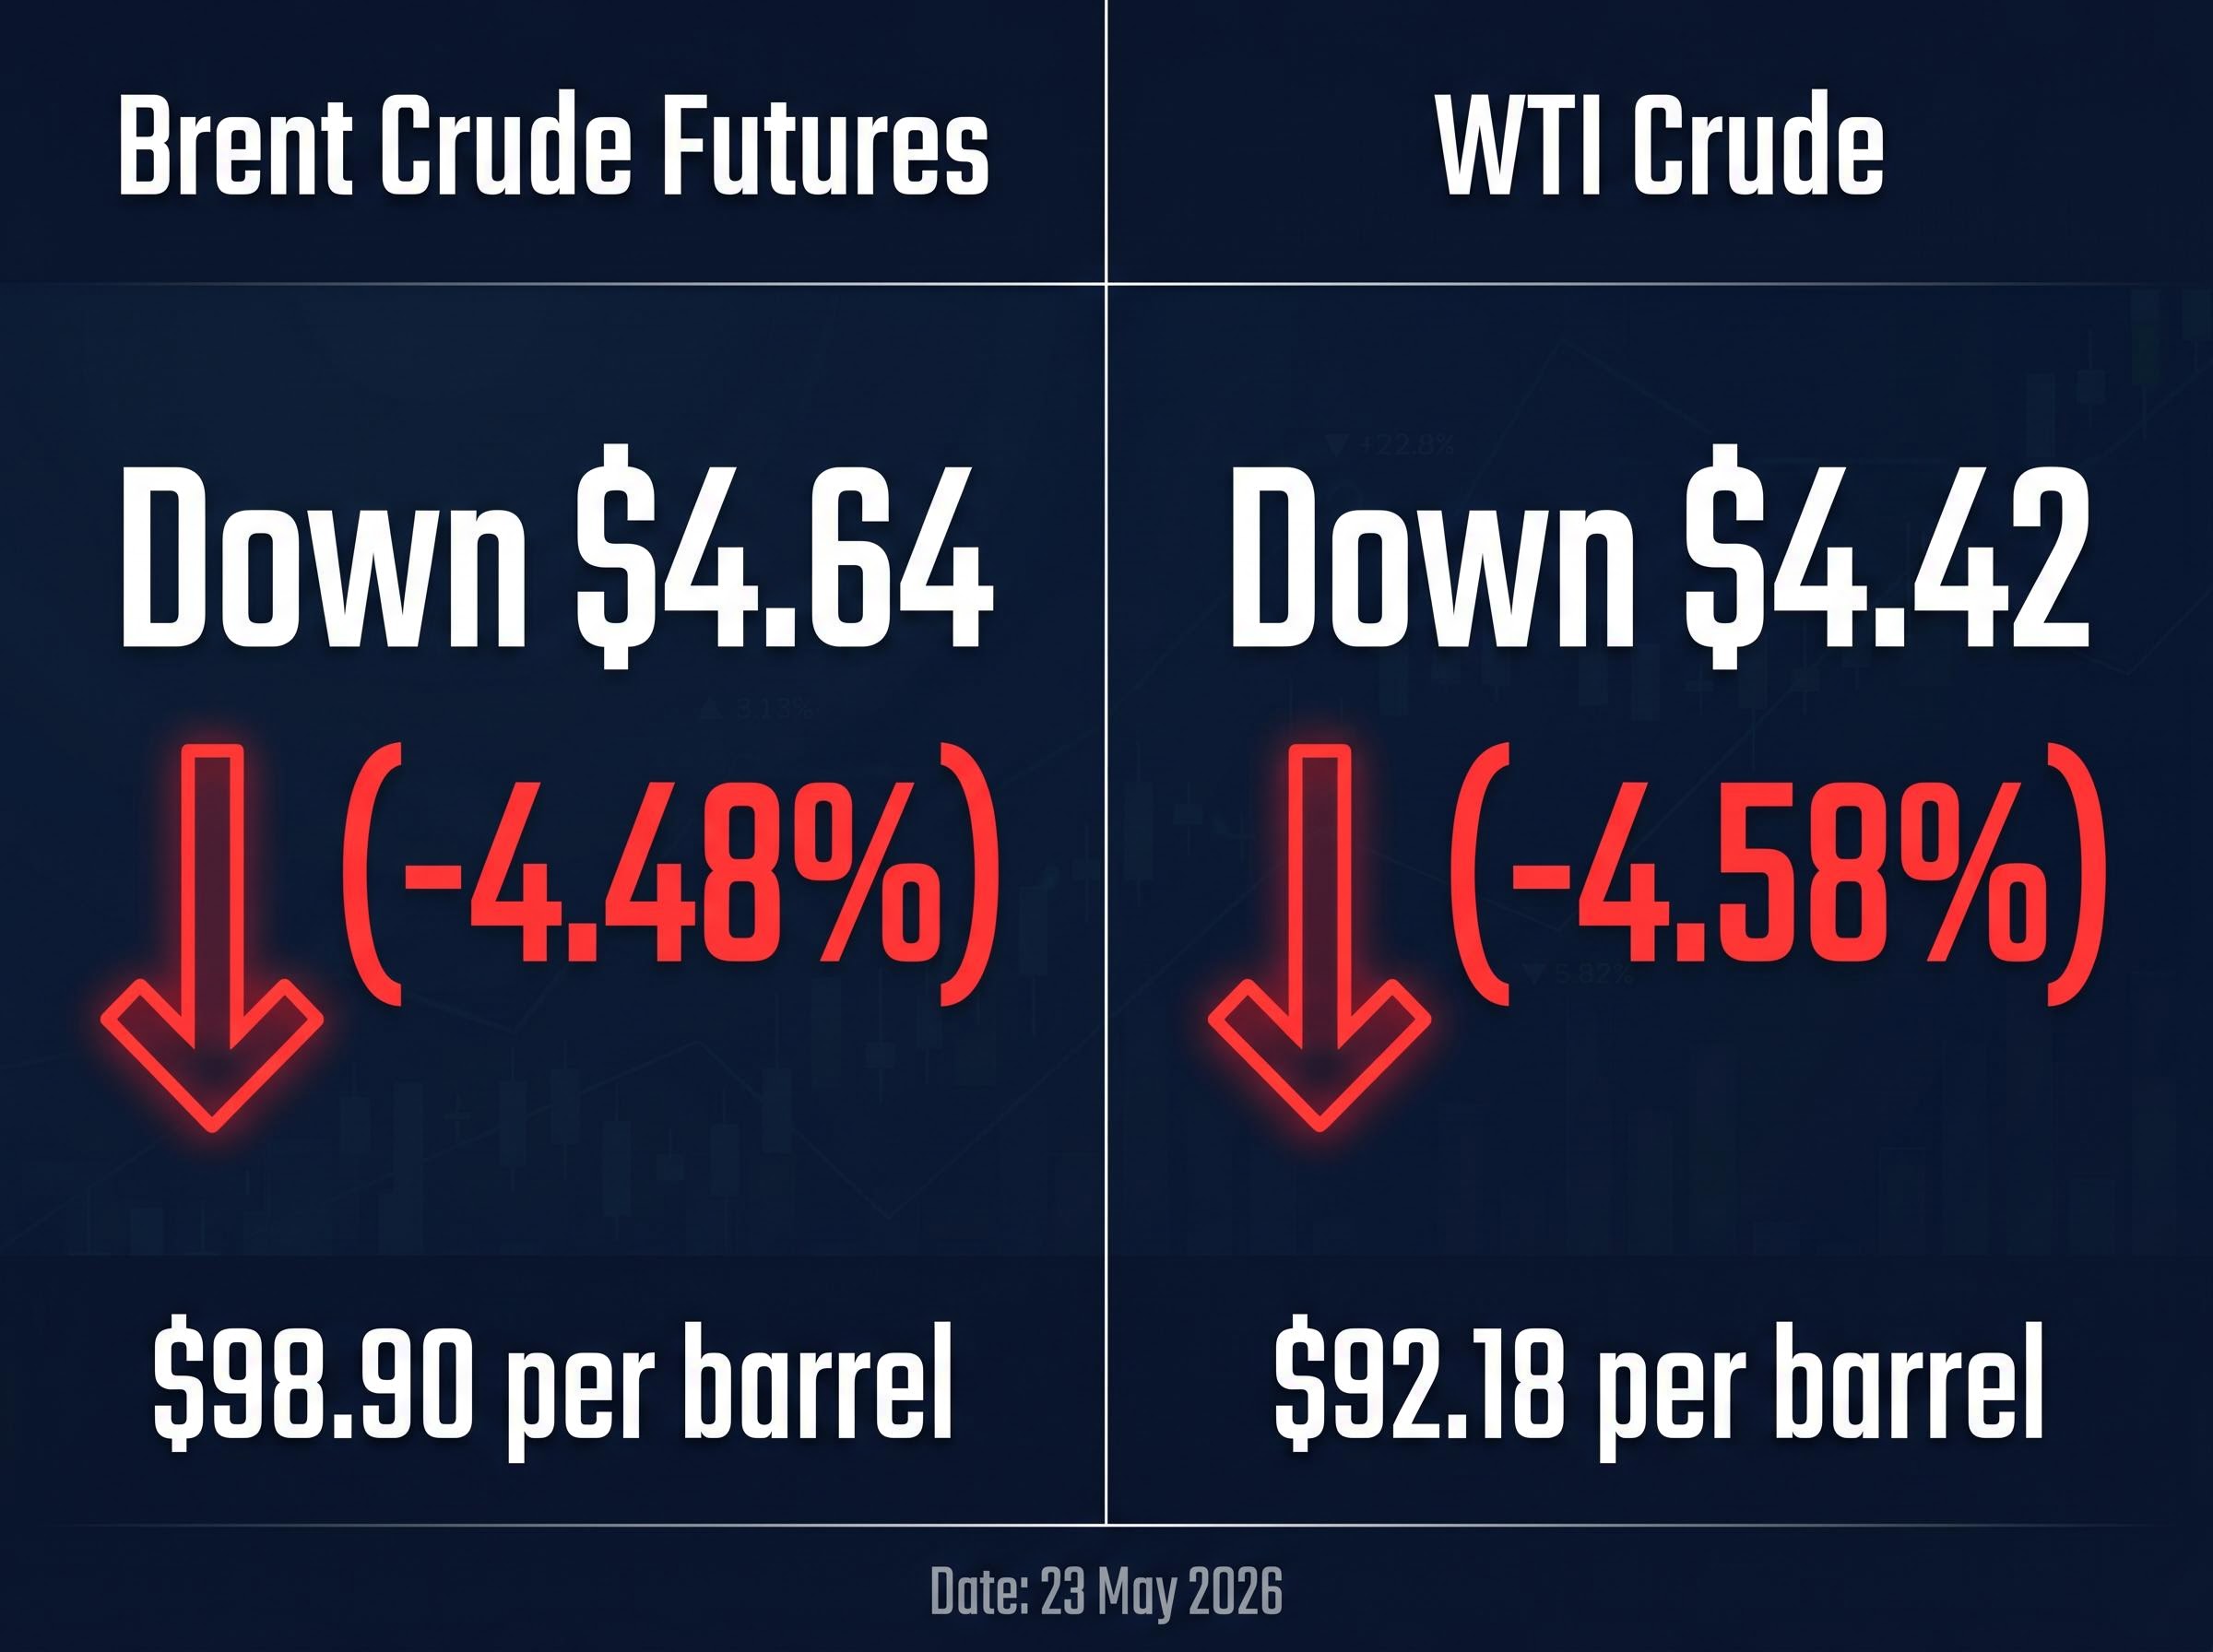
The numbers landed hard. Both global crude benchmarks posted their largest single-session declines in months:
- Brent crude futures: down $4.64 (4.48%) to $98.90 per barrel at 2203 GMT, 23 May 2026
- WTI crude: down $4.42 (4.58%) to $92.18 per barrel at the same timestamp
A move of that magnitude in a single session signals how much speculative optimism had already been built into the price. The proximate trigger was a statement from President Trump indicating Washington would not be rushed into finalising an agreement he described as not yet fully negotiated.
“Washington will not be rushed into a bad deal. No agreement is better than a weak agreement.” — President Trump, 24 May 2026
The implication was immediate. Traders who had positioned for a deal, one that would have eased sanctions on Iranian oil exports and structurally increased global supply, began unwinding those positions. Analysts at S&P Global Commodity Insights characterised the selloff as “a paring back of speculative length rather than a reassessment of long-term supply tightness.” The distinction matters: the market did not decide oil is less scarce. It decided a deal is less likely.
The deal premium built into crude was most visible on 7 May 2026, when Brent fell approximately 7.6% in a single session after reports of a US-Iran framework emerged, dropping from $116.55 to $101.88 per barrel and simultaneously driving a 7.73% surge in the Gold Miners ETF as falling Treasury yields triggered a broad commodity rotation outside energy.
When big ASX news breaks, our subscribers know first
What the nuclear talks were trying to resolve, and where they fell apart
Negotiations between Washington and Tehran stalled on four structural disputes, each of which involves a genuine conflict of interest rather than a procedural delay. Understanding what is unresolved tells investors how far the market remains from the scenario, a signed deal and sanctions relief on Iranian oil exports, that would structurally reprice crude lower.
The four sticking points, as reported by Reuters, the Financial Times, and the Wall Street Journal in late May 2026:
- Scope and sequencing of sanctions relief: Disagreement persists over how quickly and how broadly Washington would lift sanctions on Iran’s oil exports, banking sector, and Revolutionary Guard-linked entities, and whether relief would be front-loaded or phased.
- Monitoring, verification, and snap inspections: Iran has resisted Western demands for expanded International Atomic Energy Agency (IAEA) access, including more intrusive inspections at certain nuclear sites.
- Advanced centrifuge dismantlement and enrichment caps: Disputes remain over mothballing or dismantling advanced IR-6 and IR-8 centrifuges and over the permitted level and stockpile of enriched uranium Iran would be allowed to maintain.
- Ballistic missiles and regional proxy activity: The US and European negotiators have pushed for language on Iran’s missile programme and support for regional proxies. Tehran has rejected tying these issues to the nuclear file entirely.
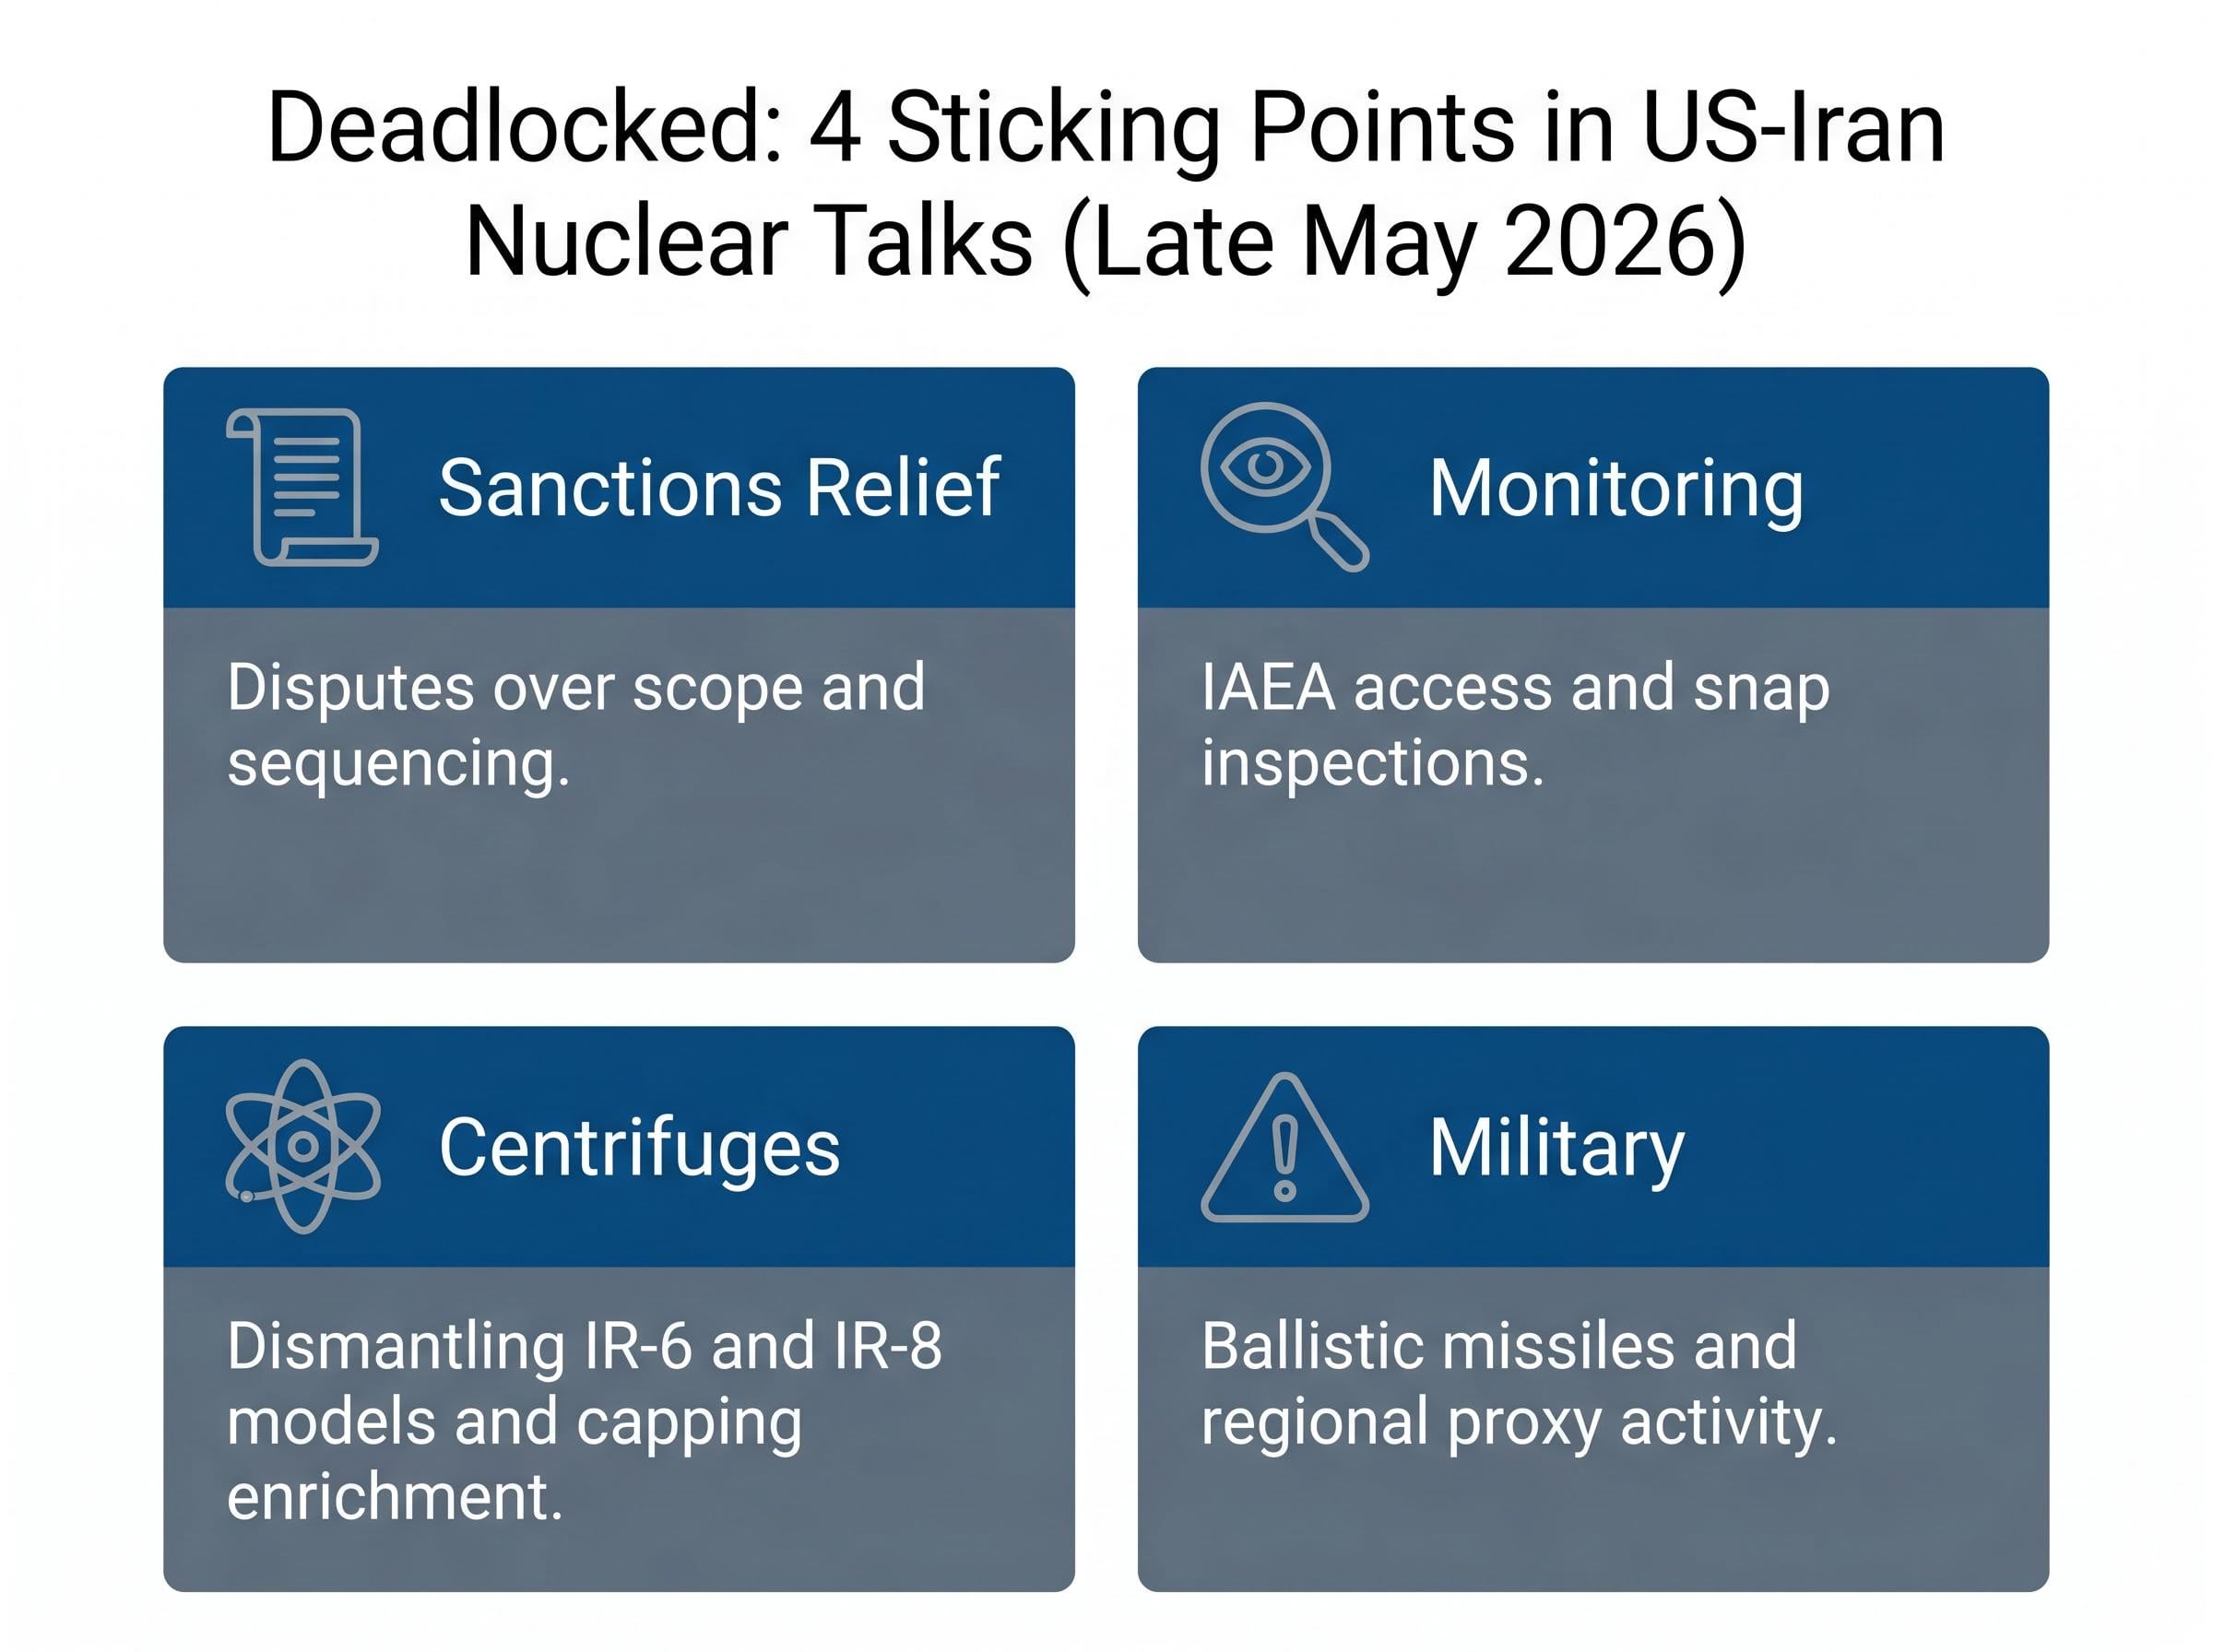
Negotiators remain in contact, but no signing date has been set. The talks are described as “deadlocked” as of late May 2026. Each of these four disputes involves a dimension where the two sides’ core positions are structurally opposed, not simply unfinished. That is why the impasse feels earned, and why traders moved so aggressively to unwind their deal premium.
Why the Strait of Hormuz sits at the centre of every oil price risk calculation
The Strait of Hormuz is a narrow waterway between Iran and Oman, roughly 33 kilometres wide at its narrowest navigable point. Approximately one-fifth of the world’s seaborne crude transits through it daily. There is no practical alternative route for most of that volume; pipelines that bypass the strait carry a fraction of what the tankers move, and they cannot be scaled quickly.
That geography is why Helima Croft, head of global commodity strategy at RBC Capital Markets, has described the strait as the “single most critical chokepoint in the global oil market,” noting that “risk premia can expand rapidly on any sign of Iranian interference with shipping.”
In recent weeks, several incidents have elevated the perceived threat without triggering an actual disruption to flows:
| Incident | Date | Source | Market Interpretation |
|---|---|---|---|
| Revolutionary Guard naval drills near Hormuz (missile and drone launches) | 21 May 2026 | Reuters | Signal of capability and intent; heightened risk perception |
| US Navy near-miss (Iranian fast boats made “unsafe and unprofessional manoeuvres”) | 22 May 2026 | Associated Press | Elevated military tension; miscalculation risk |
| Maritime security advisories for vessels transiting the strait | 23 May 2026 | Lloyd’s List | Insurance cost increases; potential route delays |
Physical flows remained broadly uninterrupted as of late May 2026. The IEA confirmed in its May 2026 Oil Market Report that there had been “no major disruption to physical supply flows.” The price drop, then, was about repricing risk rather than responding to an actual supply cut.
“Even a temporary disruption of Hormuz exports would be a shock far greater than any single OPEC+ decision.” — Amrita Sen, co-founder and head of research, Energy Aspects
That asymmetry, between the probability of disruption and its potential magnitude, is what keeps the geopolitical premium embedded in every barrel.
The Hormuz risk premium does not simply dissolve when physical flows are uninterrupted; VLCC daily hire rates tracking near $110,000 per day and the near-total withdrawal of commercial war-risk insurance suggest the market is pricing a structural elevation rather than a temporary spike, with the IEA projecting a two-year recovery timeline even under a best-case resolution.
Gold up, yields down, equities lower: what cross-asset signals say about market fear
The crude selloff did not happen in isolation. Across equities, safe havens, and fixed income, the Friday 23 May session produced a coherent risk-off signal. Each asset class moved in the direction consistent with a single underlying anxiety: rising geopolitical risk and retreating growth confidence.
The cross-asset transmission from Iran talks follows a consistent sequential pattern: energy price moves arrive first, long-duration bond yields reprice as inflation expectations shift, and rate-sensitive equity sectors react last, a sequence that played out with particular clarity in mid-May 2026 when 30-year Treasury yields retreated from 19-year highs in a single session.
| Asset | Friday Move | Monday Move |
|---|---|---|
| Brent crude | Down 4.48% to $98.90 | Session data pending |
| S&P 500 | Down 0.7% | Up 0.3% |
| Gold | Up approx. 0.9% to ~$2,420/oz | Little changed |
| Silver | Up approx. 1.6% | Data pending |
| US 10-year Treasury yield | Down ~4 bps to ~3.95% | Up 2 bps to 3.97% |
Monday’s partial reversal, the S&P 500 up 0.3%, the Nasdaq up 0.5%, the 10-year yield recovering 2 basis points, was technical in character rather than a genuine shift in sentiment. Gold held its gains rather than giving them back, and equities recovered only a fraction of Friday’s decline.
“The geopolitical premium is likely to remain sticky as long as U.S.-Iran tensions stay elevated.” — Bob McNally, president, Rapidan Energy Group
That stickiness is the signal. When gold holds, yields stay low, and equities only partially bounce, the market is telling investors it has not moved past the risk. It has absorbed one session of it and is waiting for the next headline.
What analysts see ahead for oil prices while the diplomatic standoff holds
The spectrum of institutional views ranges from contained volatility to historic disruption. That spread itself is the story: no consensus exists, which is precisely why crude remains difficult to price with conviction.
- IEA (May 2026 Oil Market Report): Hormuz tensions pose an “upside risk to prices” but no major physical disruption to date; base case assumes no prolonged interruption
- EIA (STEO, 7 May 2026): “Uncertainty around the Iran situation and potential supply disruptions” cited as a primary forecast risk; baseline assumes no large-scale Hormuz closure
- J.P. Morgan: Lowered H2 2026 Brent forecast but said tensions “justify a modest geopolitical risk premium”; expects “ample non-OPEC supply growth and OPEC+ spare capacity should cap sustained rallies”
- Goldman Sachs (April 2026): Characterised a coordinated US-Israeli attack on Iran as potentially the “largest energy supply disruption in history”; baseline scenario assumes 4-6 week conflict duration before normalisation
- Ed Morse, Citigroup: “Absent an outright closure of the Strait of Hormuz, price spikes driven by war headlines are likely to prove transitory”
Base case: rangebound prices with elevated volatility
The IEA, EIA, and J.P. Morgan positions converge on a shared assumption: physical flows continue, OPEC+ spare capacity provides a structural buffer, and prices trade within a volatile but bounded range. The geopolitical risk premium is acknowledged as justified but is not expected to produce a sustained breakout absent an actual supply curtailment.
Tail risk: what a Hormuz disruption would actually mean
Goldman Sachs and Ed Morse at Citigroup occupy the other end of the distribution. No major institution is treating a Hormuz closure as a base case. But Morse warned that “any attack on tankers or key export infrastructure could change the balance of risks overnight.” The asymmetry of the tail risk, low probability, extreme magnitude, is what keeps the premium alive even when physical flows continue unimpeded.
For investors wanting to map each institutional projection to specific Hormuz reopening timelines, our dedicated guide to oil price forecast scenarios covers the Goldman Sachs $110-$142 range, the EIA reopening baseline, and the probability weights Goldman assigns to normalisation by mid-June, with worked comparisons across the base case and prolonged closure outcomes.
The deal that could reprice oil markets is real but not close
The oil price drop on 23 May 2026 is a rational repricing. Traders had built a deal premium into crude on the assumption that negotiations were progressing toward sanctions relief on Iranian oil exports. That assumption collapsed when the specific sticking points, centrifuge caps, inspection access, sanctions sequencing, ballistic missiles, proved too structurally difficult for a near-term resolution.
The alternative to a deal is not stability. It is heightened confrontation in and around the Strait of Hormuz, where the Iranian Revolutionary Guard and the US Navy are already exchanging provocative manoeuvres. Amrita Sen at Energy Aspects captured the tension precisely: the market is “oscillating between relief over uninterrupted Hormuz flows and anxiety over miscalculation in the Gulf.”
Brent closed at $98.90. The centrifuge and sanctions-sequencing disputes are the proximate indicators to watch. Movement on either would signal whether talks are heading toward resolution or deeper deadlock.
This article is for informational purposes only and should not be considered financial advice. Investors should conduct their own research and consult with financial professionals before making investment decisions. These statements are speculative and subject to change based on market developments.