CURE and CLNE: the ASX ETFs Returning 25% in 2026
8 hrs ago

WTI crude oil dropped nearly 5% in a single session on 20-21 May 2026, falling to approximately $99.08 per barrel, and the catalyst was not a production decision from OPEC. It was a diplomatic development in the Middle East now threading through every major asset class simultaneously. US-Iran peace talks entered what President Trump described as their concluding phase in mid-May, generating a coherent cross-asset reaction: oil fell, long-end Treasury yields retreated from multi-decade highs, and airline stocks surged more than 6.5%. The story is not confined to crude. It is about how a single geopolitical development is recalibrating inflation expectations, Federal Reserve rate-path pricing, and sector rotation across US equity markets at the same time. What follows traces each channel of that transmission, from the Strait of Hormuz to the 30-year Treasury yield to the FOMC meeting on 16-17 June, so that the connections between a diplomatic headline and portfolio-level consequences become visible.
The Strait of Hormuz is a narrow passage between Iran and Oman, roughly 33 kilometres wide at its narrowest navigable point, through which a substantial share of the world’s seaborne crude oil transits daily. When that passage is constrained, the effect on global oil pricing is disproportionate to the volume disrupted, because there is no viable alternative route for tankers departing Persian Gulf loading terminals.
The current disruption illustrates the point:
President Trump stated that talks with Iran were in their concluding phase. The language moved markets. But two developments suggest that resolution is not yet guaranteed. The Islamic Revolutionary Guard Corps (IRGC) issued an explicit warning of retaliatory strikes across the Middle East if US military operations resume. Separately, a US Senate war powers resolution has been advancing to prevent further executive-authorised strikes. The diplomatic signal is optimistic; the institutional signals are hedged.
The session of 20-21 May 2026 produced one of the sharpest single-day moves in crude in weeks. WTI fell approximately 4.95% to $99.08 per barrel. Brent dropped roughly 5% in the same session.
The spot decline was significant. The futures curve shift may be more so.
The premium of front-month Brent over six-month contracts narrowed to approximately $20 per barrel, down from highs above $35 per barrel the prior month. That narrowing is a structural signal. When near-term contracts trade at a steep premium to longer-dated ones, the market is pricing acute, immediate supply anxiety. When that premium compresses, the market is pricing the near-term risk as easing, even before a resolution is formally confirmed.
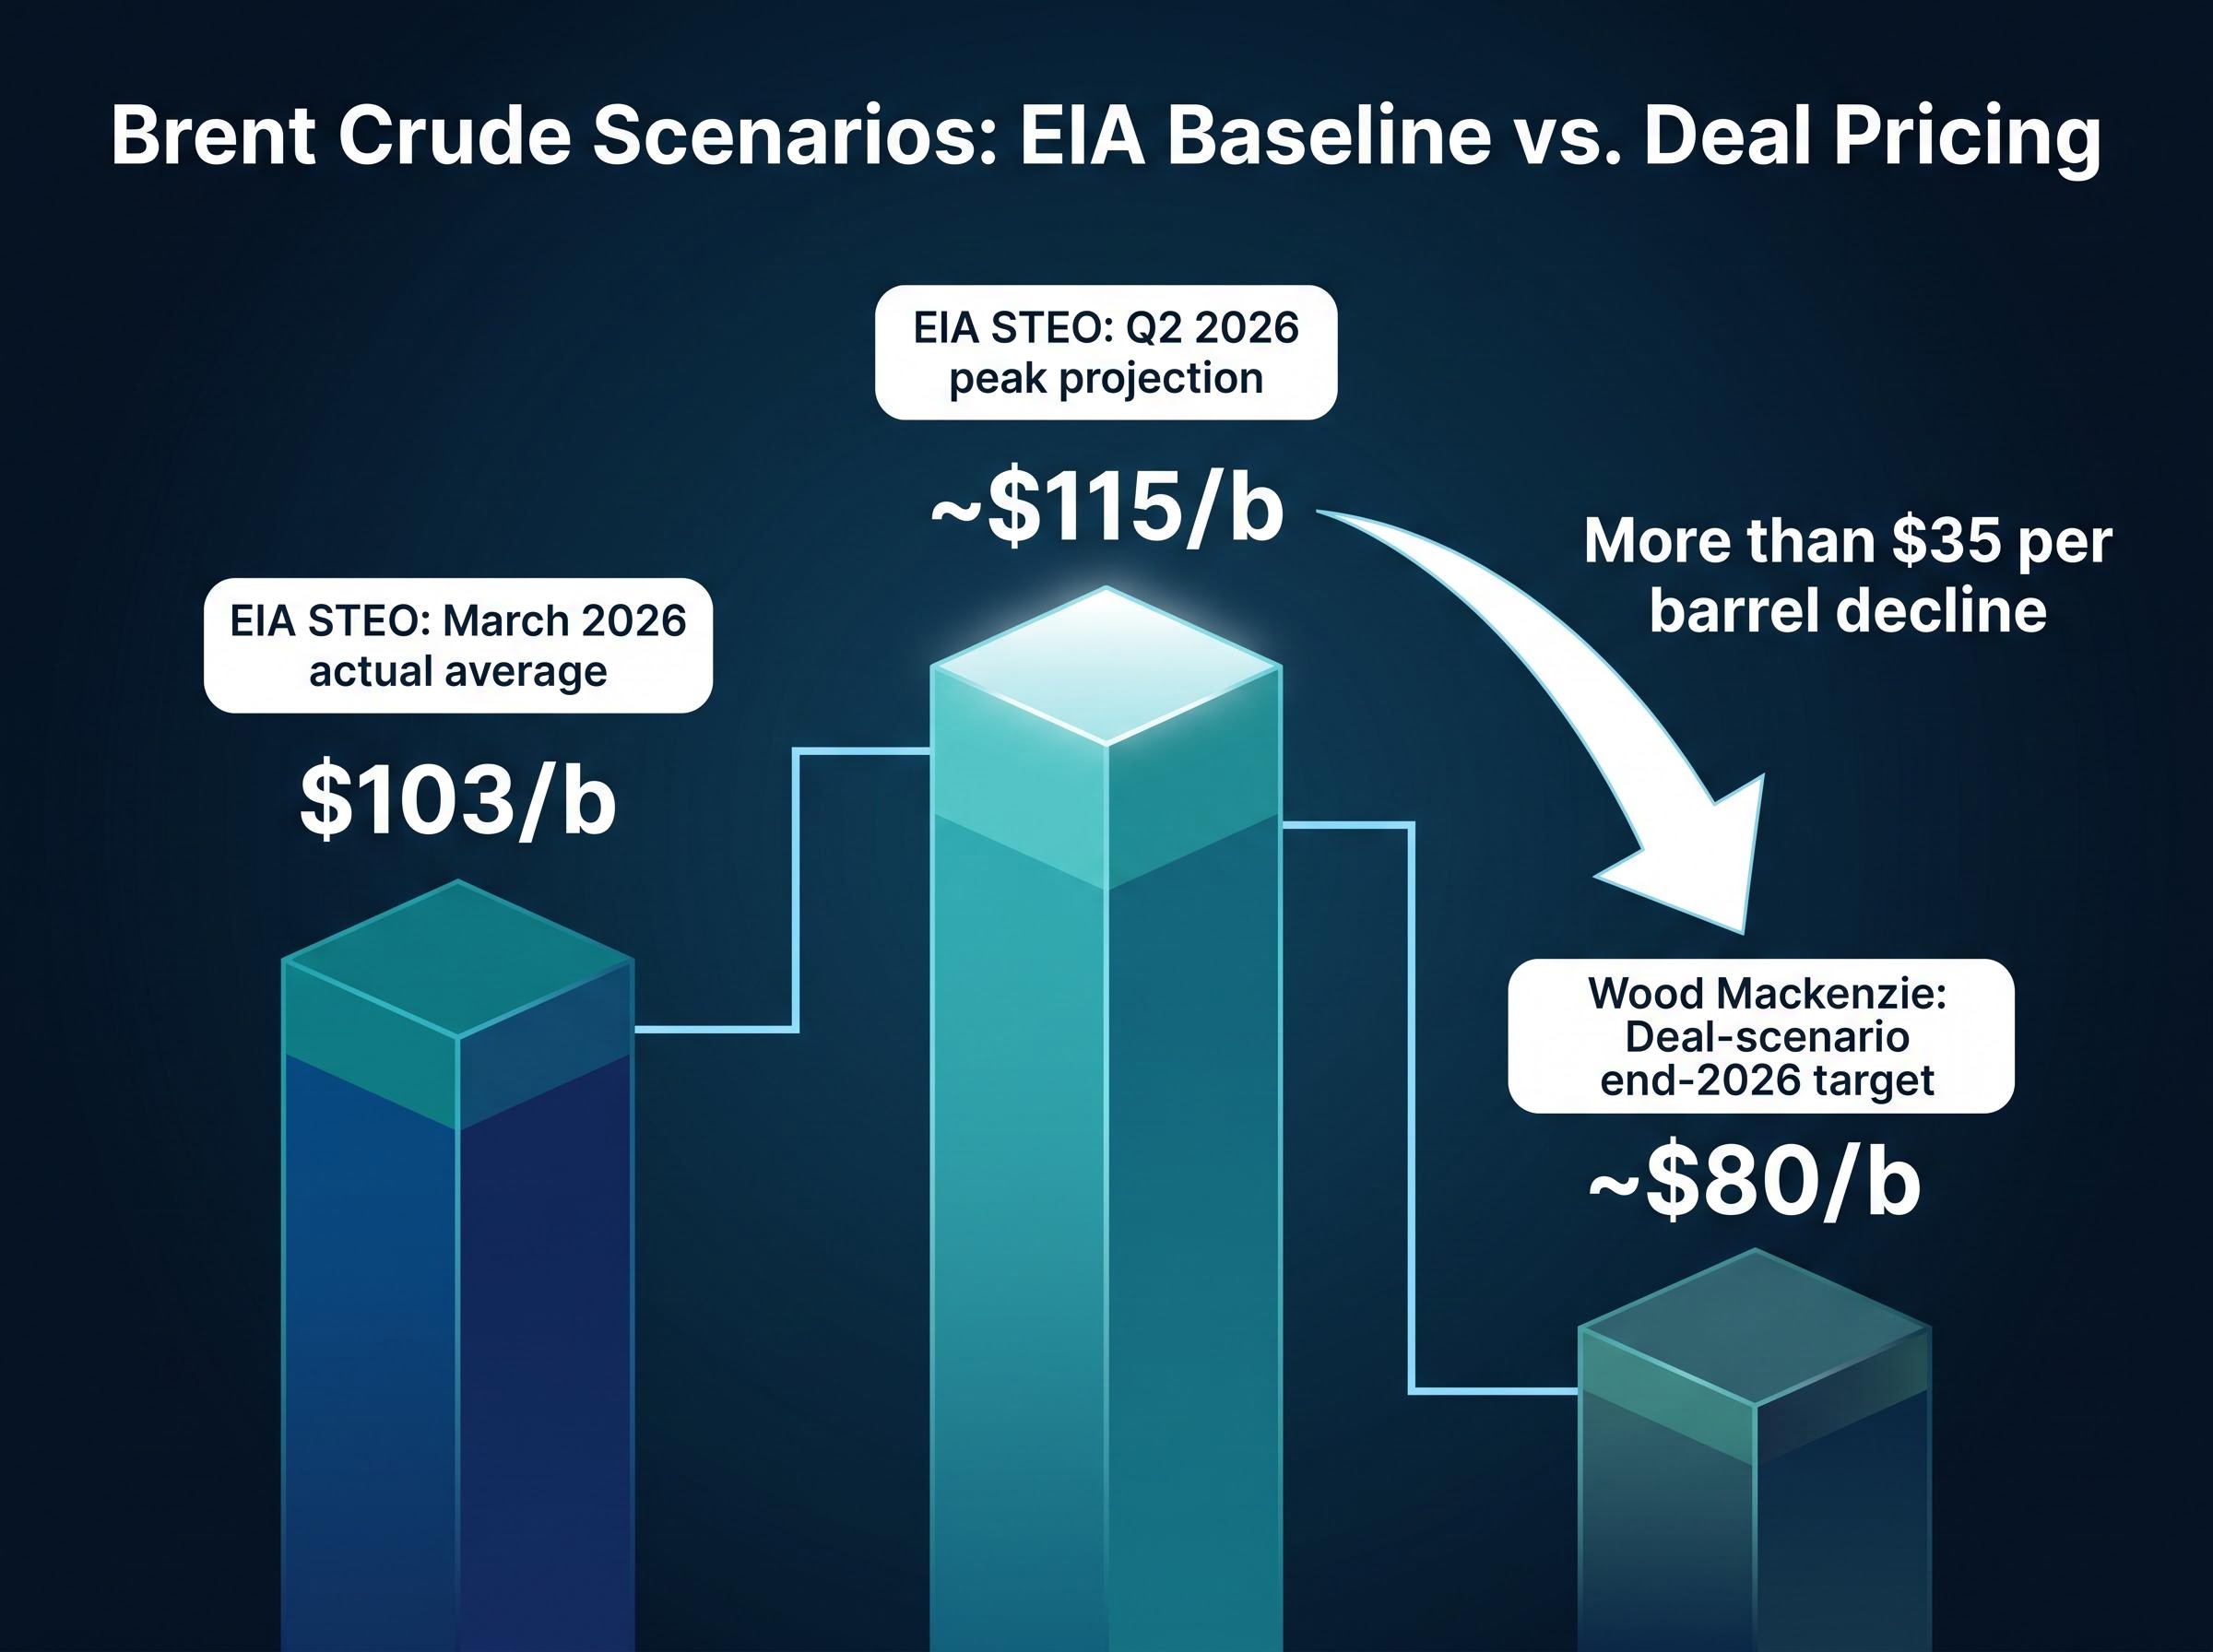
Wood Mackenzie’s scenario modelling adds a forward dimension: if a deal reopens the Strait of Hormuz by June, spot Brent could ease to approximately $80 per barrel by end-2026. That figure sits well below the Energy Information Administration’s (EIA) recent readings.
| Scenario | Brent Price Estimate | Source |
|---|---|---|
| March 2026 actual average | $103/b | EIA STEO |
| Q2 2026 peak projection | ~$115/b | EIA STEO |
| Deal-scenario end-2026 target | ~$80/b | Wood Mackenzie |
Wood Mackenzie projects Brent could fall to approximately $80 per barrel by the end of 2026 if a rapid peace deal reopens the Strait of Hormuz by June, a decline of more than $35 per barrel from EIA’s Q2 2026 peak estimate.
The gap between the EIA’s current-conditions projection and Wood Mackenzie’s deal scenario is where the analytical tension lives. The market is beginning to price toward the latter, but the former remains the baseline until a deal is confirmed.
The oil-to-interest-rate connection runs through a specific chain of cause and effect. For readers less familiar with the transmission mechanism, the sequence works as follows:
That third step is where the current market tension sits. As of this period, markets were pricing less than a 10% probability of any rate cut in 2026. New Fed Chair Kevin Warsh is preparing for his first FOMC meeting on 16-17 June. A sustained oil decline shifts the inflation component of the calculus that will inform that meeting’s policy language.
Minutes from the 29 April FOMC meeting revealed that policymakers discussed the possibility of rate increases if inflation stayed persistently elevated. The discussion was framed as a risk-scenario acknowledgement rather than a policy commitment, but it signals how high the inflation-vigilance threshold remains at the Fed.
President Trump stated he would allow Warsh to exercise independent judgement, introducing additional uncertainty about the political context of any policy shift. The direction of oil prices in the coming weeks will determine whether the June meeting’s debate centres on the timing of cuts or the risk of hikes, two very different conversations for every asset class that prices off the US rate path.
The 30-year Treasury yield reached a 19-year high of 5.19% on 19 May 2026 before retreating as Iran-deal optimism filtered through to inflation expectations.
That peak figure is the section’s anchor. The 30-year yield is priced on long-run inflation expectations, meaning a credible deflationary supply shock in energy carries disproportionate weight at the far end of the curve. A sustained decline in oil does not merely reduce next month’s CPI print; it compresses the inflation premium that bond buyers demand for lending to the US government over three decades.
The 10-year Treasury yield fell to approximately 4.572%, a decline of around 2.04%, retreating from a recent 16-month high of 4.70%. Both moves reflected the same logic: the market’s real-time repricing of the inflation outlook in response to the diplomatic signal.
The US retreat is notable partly because it occurred against a backdrop of persistent sovereign debt stress elsewhere:
For bond investors, the US yield retreat suggests the geopolitical premium embedded in long-duration Treasuries is beginning to decompress, even as sovereign yields elsewhere continue to climb.
The Global Jets ETF gained approximately 6.57% in the session, closing at 26.44, the single largest sectoral beneficiary of the crude oil decline.
Fuel represents one of the largest operating costs for commercial airlines. A sustained drop in oil translates directly to margin expansion for carriers, and the market priced that in within hours.
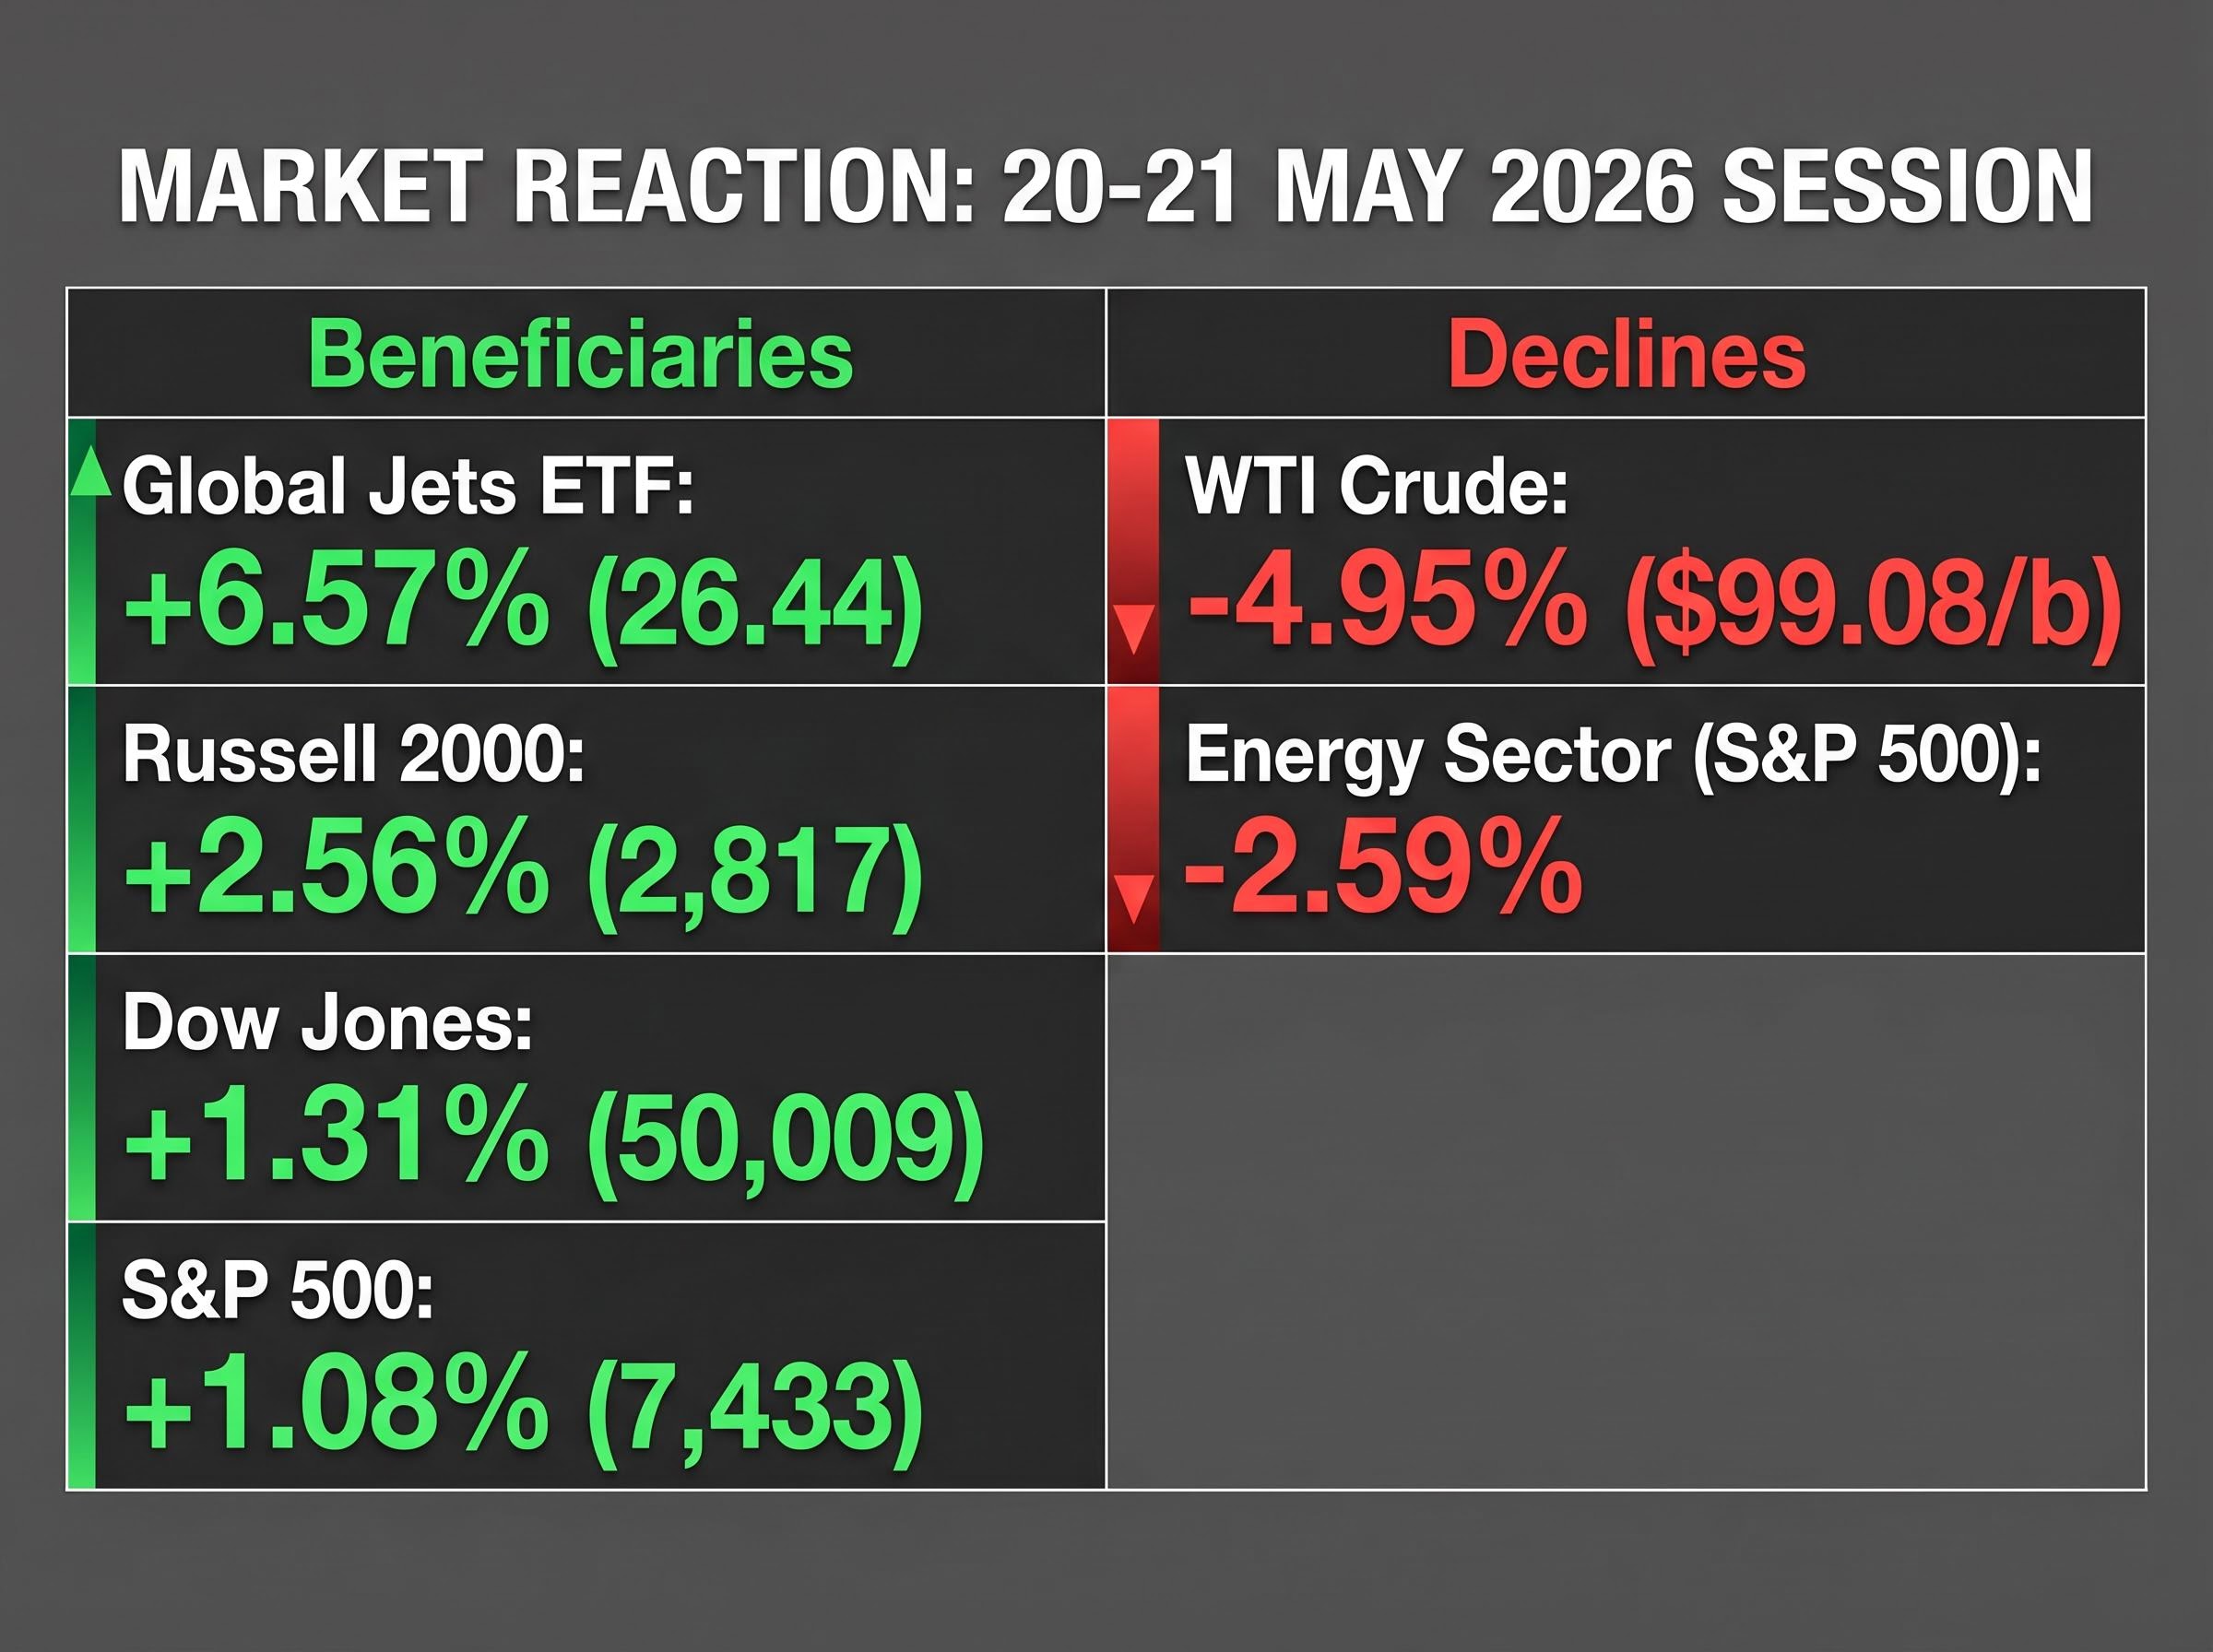
The broader equity market reaction confirmed the relief was wide rather than narrow. The S&P 500 gained approximately 1.08% to close at 7,433, ending a three-session losing streak. The Dow Jones advanced 1.31% to 50,009, reclaiming the 50,000 level. The Russell 2000 climbed approximately 2.56% to 2,817, a signal that mid- and small-cap companies, often more sensitive to domestic energy costs, were absorbing the deal optimism alongside their large-cap counterparts.
The sector divergence was the market’s most direct expression of where the economic benefits and costs of a deal would land:
| Instrument | Move | Direction |
|---|---|---|
| Global Jets ETF | +6.57% | Beneficiary |
| Semiconductor ETF | +4.74% | Beneficiary |
| Copper Miners ETF | +3.70% | Beneficiary |
| Solar ETF | +3.20% | Beneficiary |
| Consumer Discretionary (S&P 500) | +2.50% | Beneficiary |
| Information Technology (S&P 500) | +1.87% | Beneficiary |
| Energy (S&P 500) | -2.59% | Headwind |
The VIX declined approximately 3.43% to 17.44, confirming the risk-on character of the session. The Energy sector’s 2.59% decline reflected the direct revenue hit to US shale exploration and production companies, oilfield services firms, and integrated oil producers from a potential $20+ per barrel decline in Brent.
The cross-asset scenario is straightforward to construct if a deal is confirmed and the Strait reopens by June. Wood Mackenzie’s $80 per barrel Brent scenario would represent a more than $35 per barrel decline from the EIA’s Q2 2026 peak projection, a deflationary impulse large enough to materially shift headline CPI and give the Fed genuine optionality on the rate path for the second half of 2026.
According to Wolfe Research (via CNBC), Nasdaq 100 futures carried the largest net short position since the 2023 low during this period. A confirmed deal could trigger significant short-covering that amplifies the equity rally beyond what fundamentals alone would justify.
But several conditions could prevent or reverse the current market pricing:
Three concrete signposts will determine whether the current pricing holds. First, Strait of Hormuz daily vessel traffic recovering toward the 130 vessels per day baseline would confirm that the physical constraint is easing, not merely that diplomatic language has shifted. Second, the 16-17 June FOMC statement’s language on energy and inflation will reveal whether policymakers view the oil decline as durable enough to influence the rate outlook. Third, any formal deal announcement, or breakdown statement, from either government will resolve the binary uncertainty the market is currently straddling.
Brent futures curve compression, specifically the front-month premium falling further below $20 per barrel, would signal that markets are pricing the deal as increasingly likely before any formal announcement arrives.
A single diplomatic development has simultaneously moved oil nearly 5% in a session, pulled long-end Treasury yields back from 19-year highs, driven a 6.5% rally in airline equities, and shifted the implicit probability distribution around the Fed’s June decision. The connections between these moves are not coincidental; they are the same macro mechanism observed at different points in the transmission chain.
The market is currently pricing significant optimism about a deal that has not been confirmed. That means the risk runs in both directions. A concluded agreement could accelerate the deflationary repricing, compress yields further, and force a short-covering rally across equity futures simultaneously. A breakdown in talks could reverse all three channels with comparable speed.
The Brent futures curve, the Strait vessel count, and the June FOMC language are the three sequenced checkpoints for whether the current market pricing survives contact with reality. Monitoring those three signals, rather than reacting to individual headlines, is the clearest framework for interpreting whatever comes next.
This article is for informational purposes only and should not be considered financial advice. Investors should conduct their own research and consult with financial professionals before making investment decisions. Forward-looking statements regarding oil prices, Federal Reserve decisions, and deal outcomes are speculative and subject to change based on market developments and geopolitical conditions.
Progress in US-Iran peace talks caused WTI crude to fall nearly 5% in a single session to approximately $99.08 per barrel, with Wood Mackenzie projecting Brent could reach around $80 per barrel by end-2026 if a deal reopens the Strait of Hormuz by June.
The Strait of Hormuz is a 33-kilometre-wide passage through which a substantial share of the world's seaborne crude transits daily, meaning any disruption has an outsized effect on global oil pricing because there is no viable alternative route for tankers leaving Persian Gulf terminals.
The 30-year Treasury yield retreated from a 19-year high of 5.19% reached on 19 May 2026, while the 10-year yield fell to approximately 4.572%, as markets repriced long-run inflation expectations in response to the prospect of lower energy costs.
Airlines were the largest single-session beneficiary, with the Global Jets ETF gaining approximately 6.57%, while semiconductors, copper miners, solar, and consumer discretionary sectors also posted gains of between 2.5% and 4.74% in the same session.
Three key indicators to monitor are: daily vessel traffic through the Strait of Hormuz recovering toward the pre-conflict baseline of approximately 130 vessels per day, the language in the 16-17 June FOMC statement regarding energy and inflation, and any formal deal announcement or breakdown statement from either government.