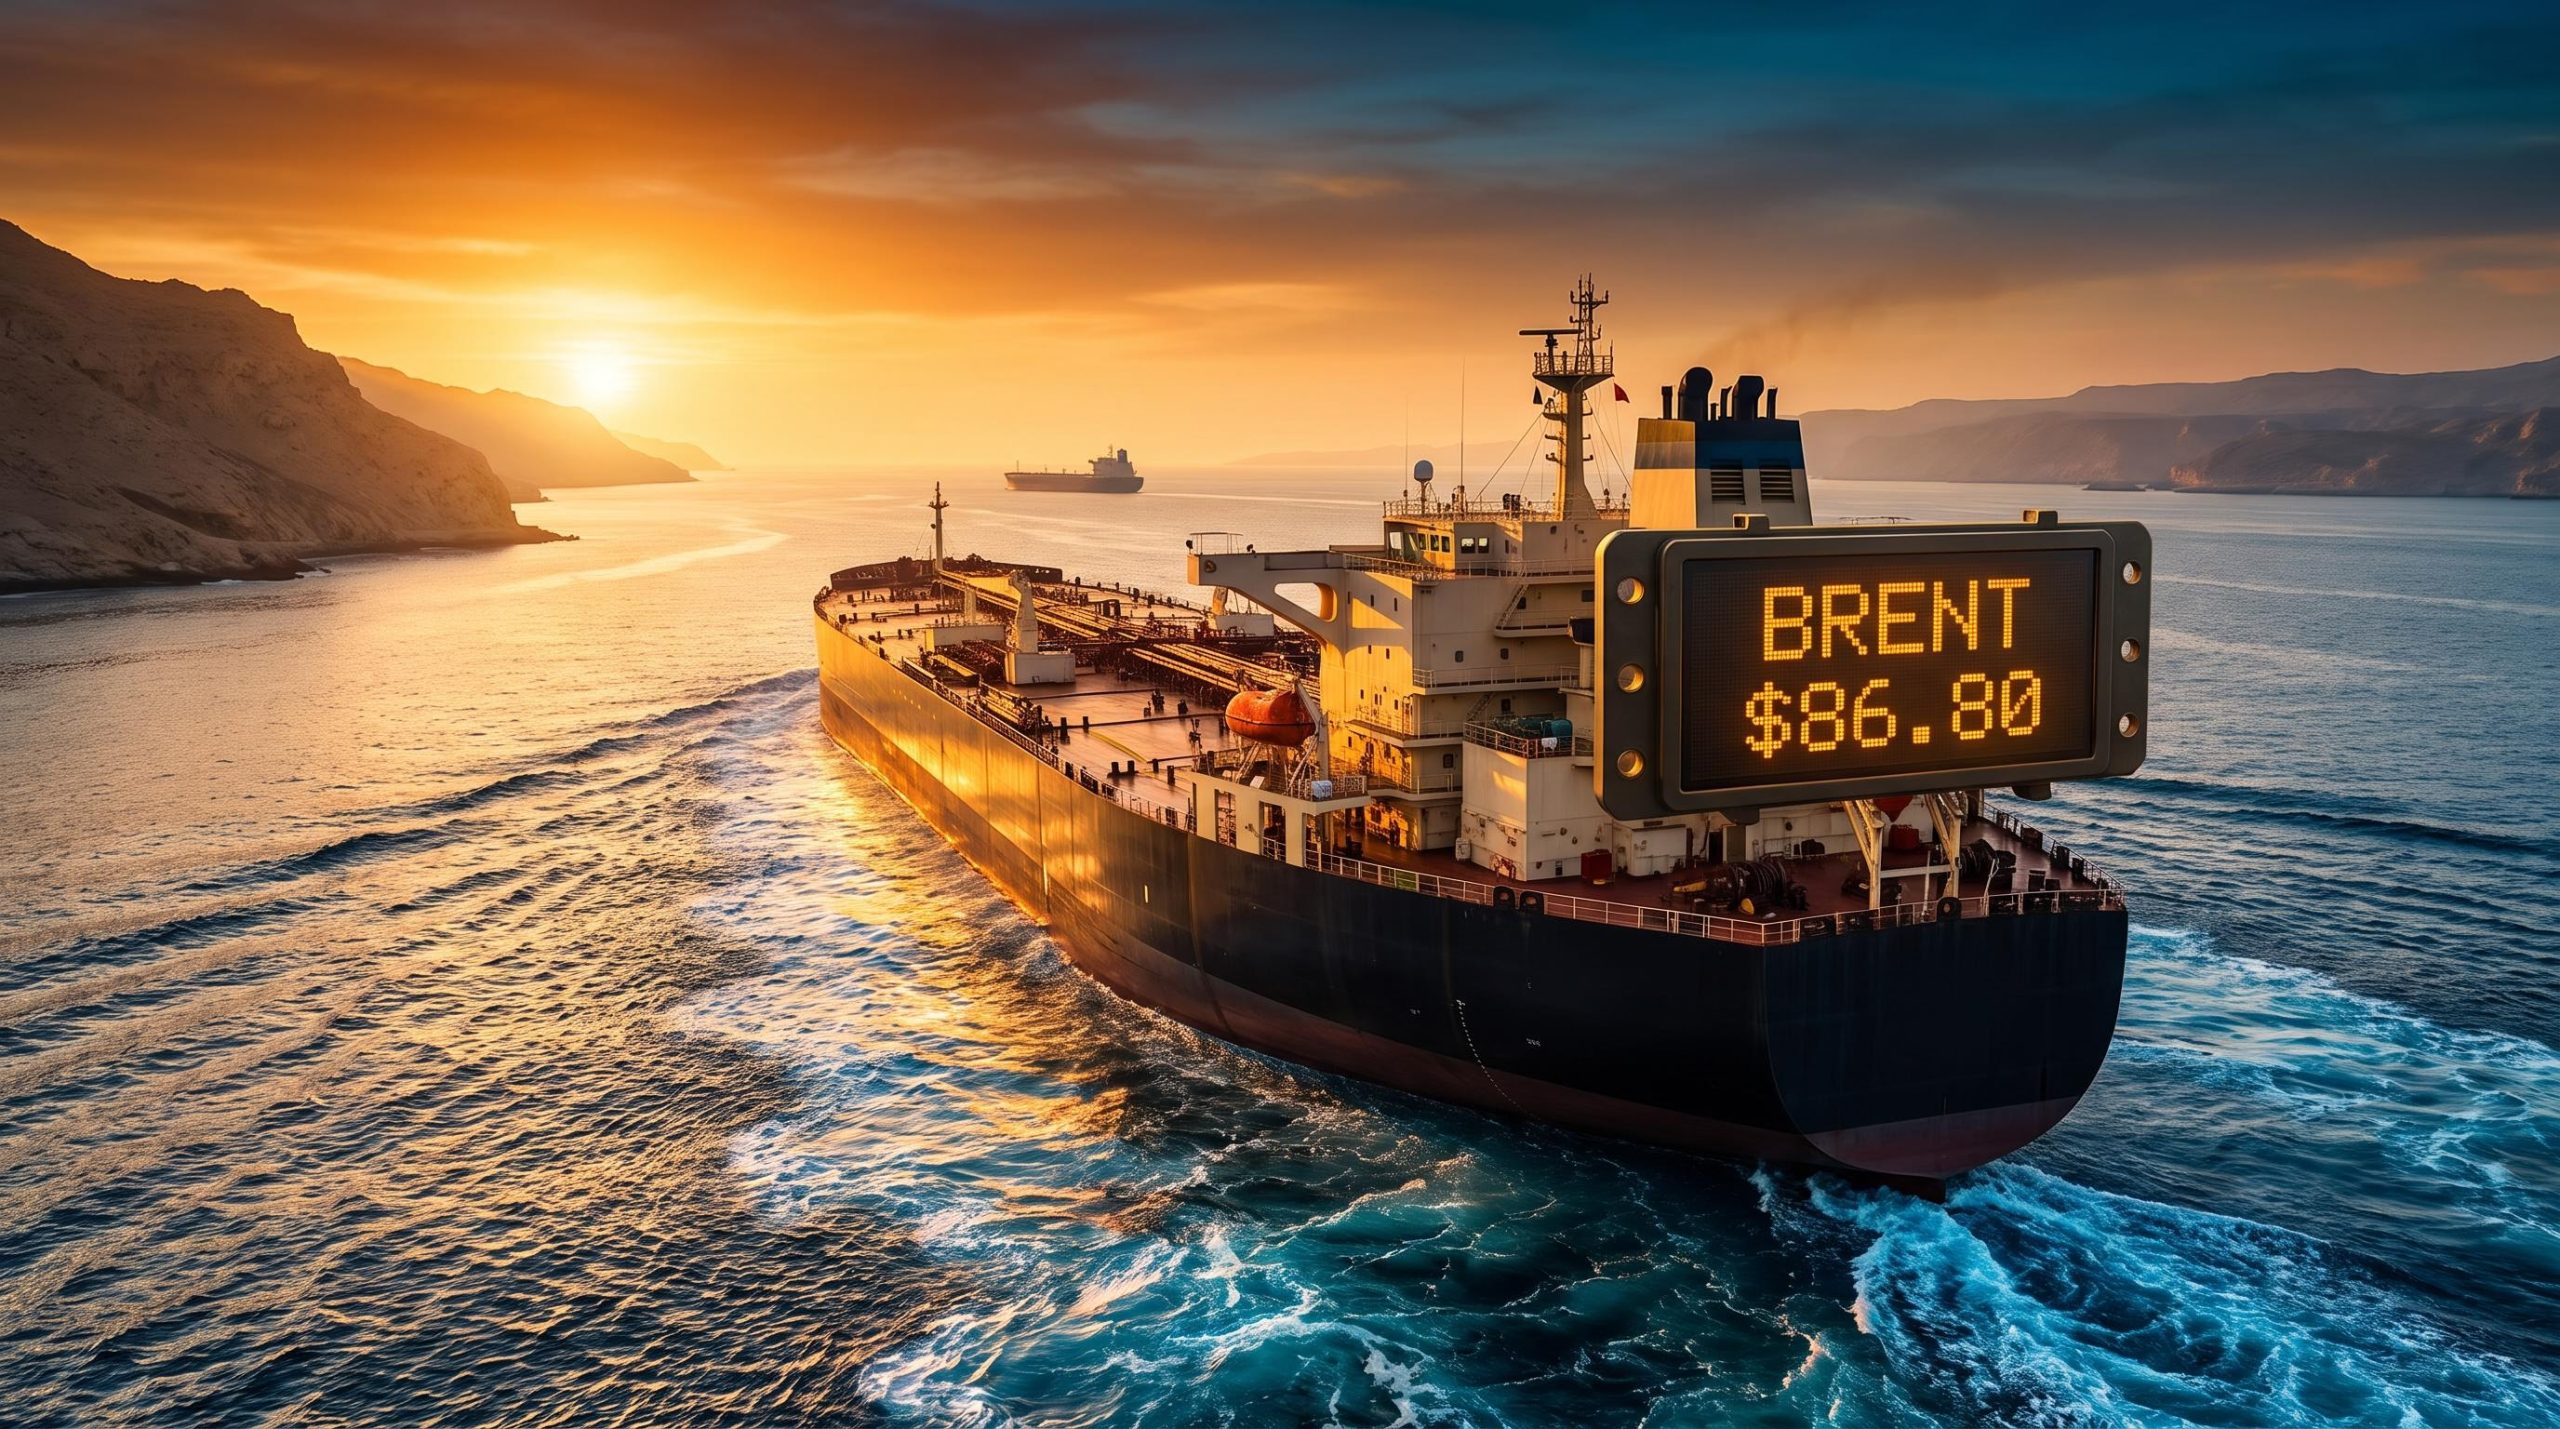
Oil just posted its third straight session of losses, and this time the catalyst was not an inventory report or an OPEC decision. Brent crude fell approximately 2% to around $86.80 per barrel on 26 August 2026, dragged lower by a ministerial meeting in Tehran that most retail investors did not have on their calendar.
Through the Strait of Hormuz passes an estimated 20% of all crude oil and liquefied natural gas (LNG) shipped globally, making it the most consequential maritime bottleneck in the world energy system. When Iran’s foreign minister and his Omani counterpart emerged from talks on 25 August with a signed joint statement on a phased navigation framework, it shifted the probability calculus for traders overnight. What had been background diplomatic noise became a credible, if narrow, technical advance.
Here is how to read this price move accurately, including what it reflects and what it has not yet resolved, so you can position your understanding of both the oil selloff and the Asian equity rally that followed without overreacting to either.
Oil’s three-day retreat and what triggered it
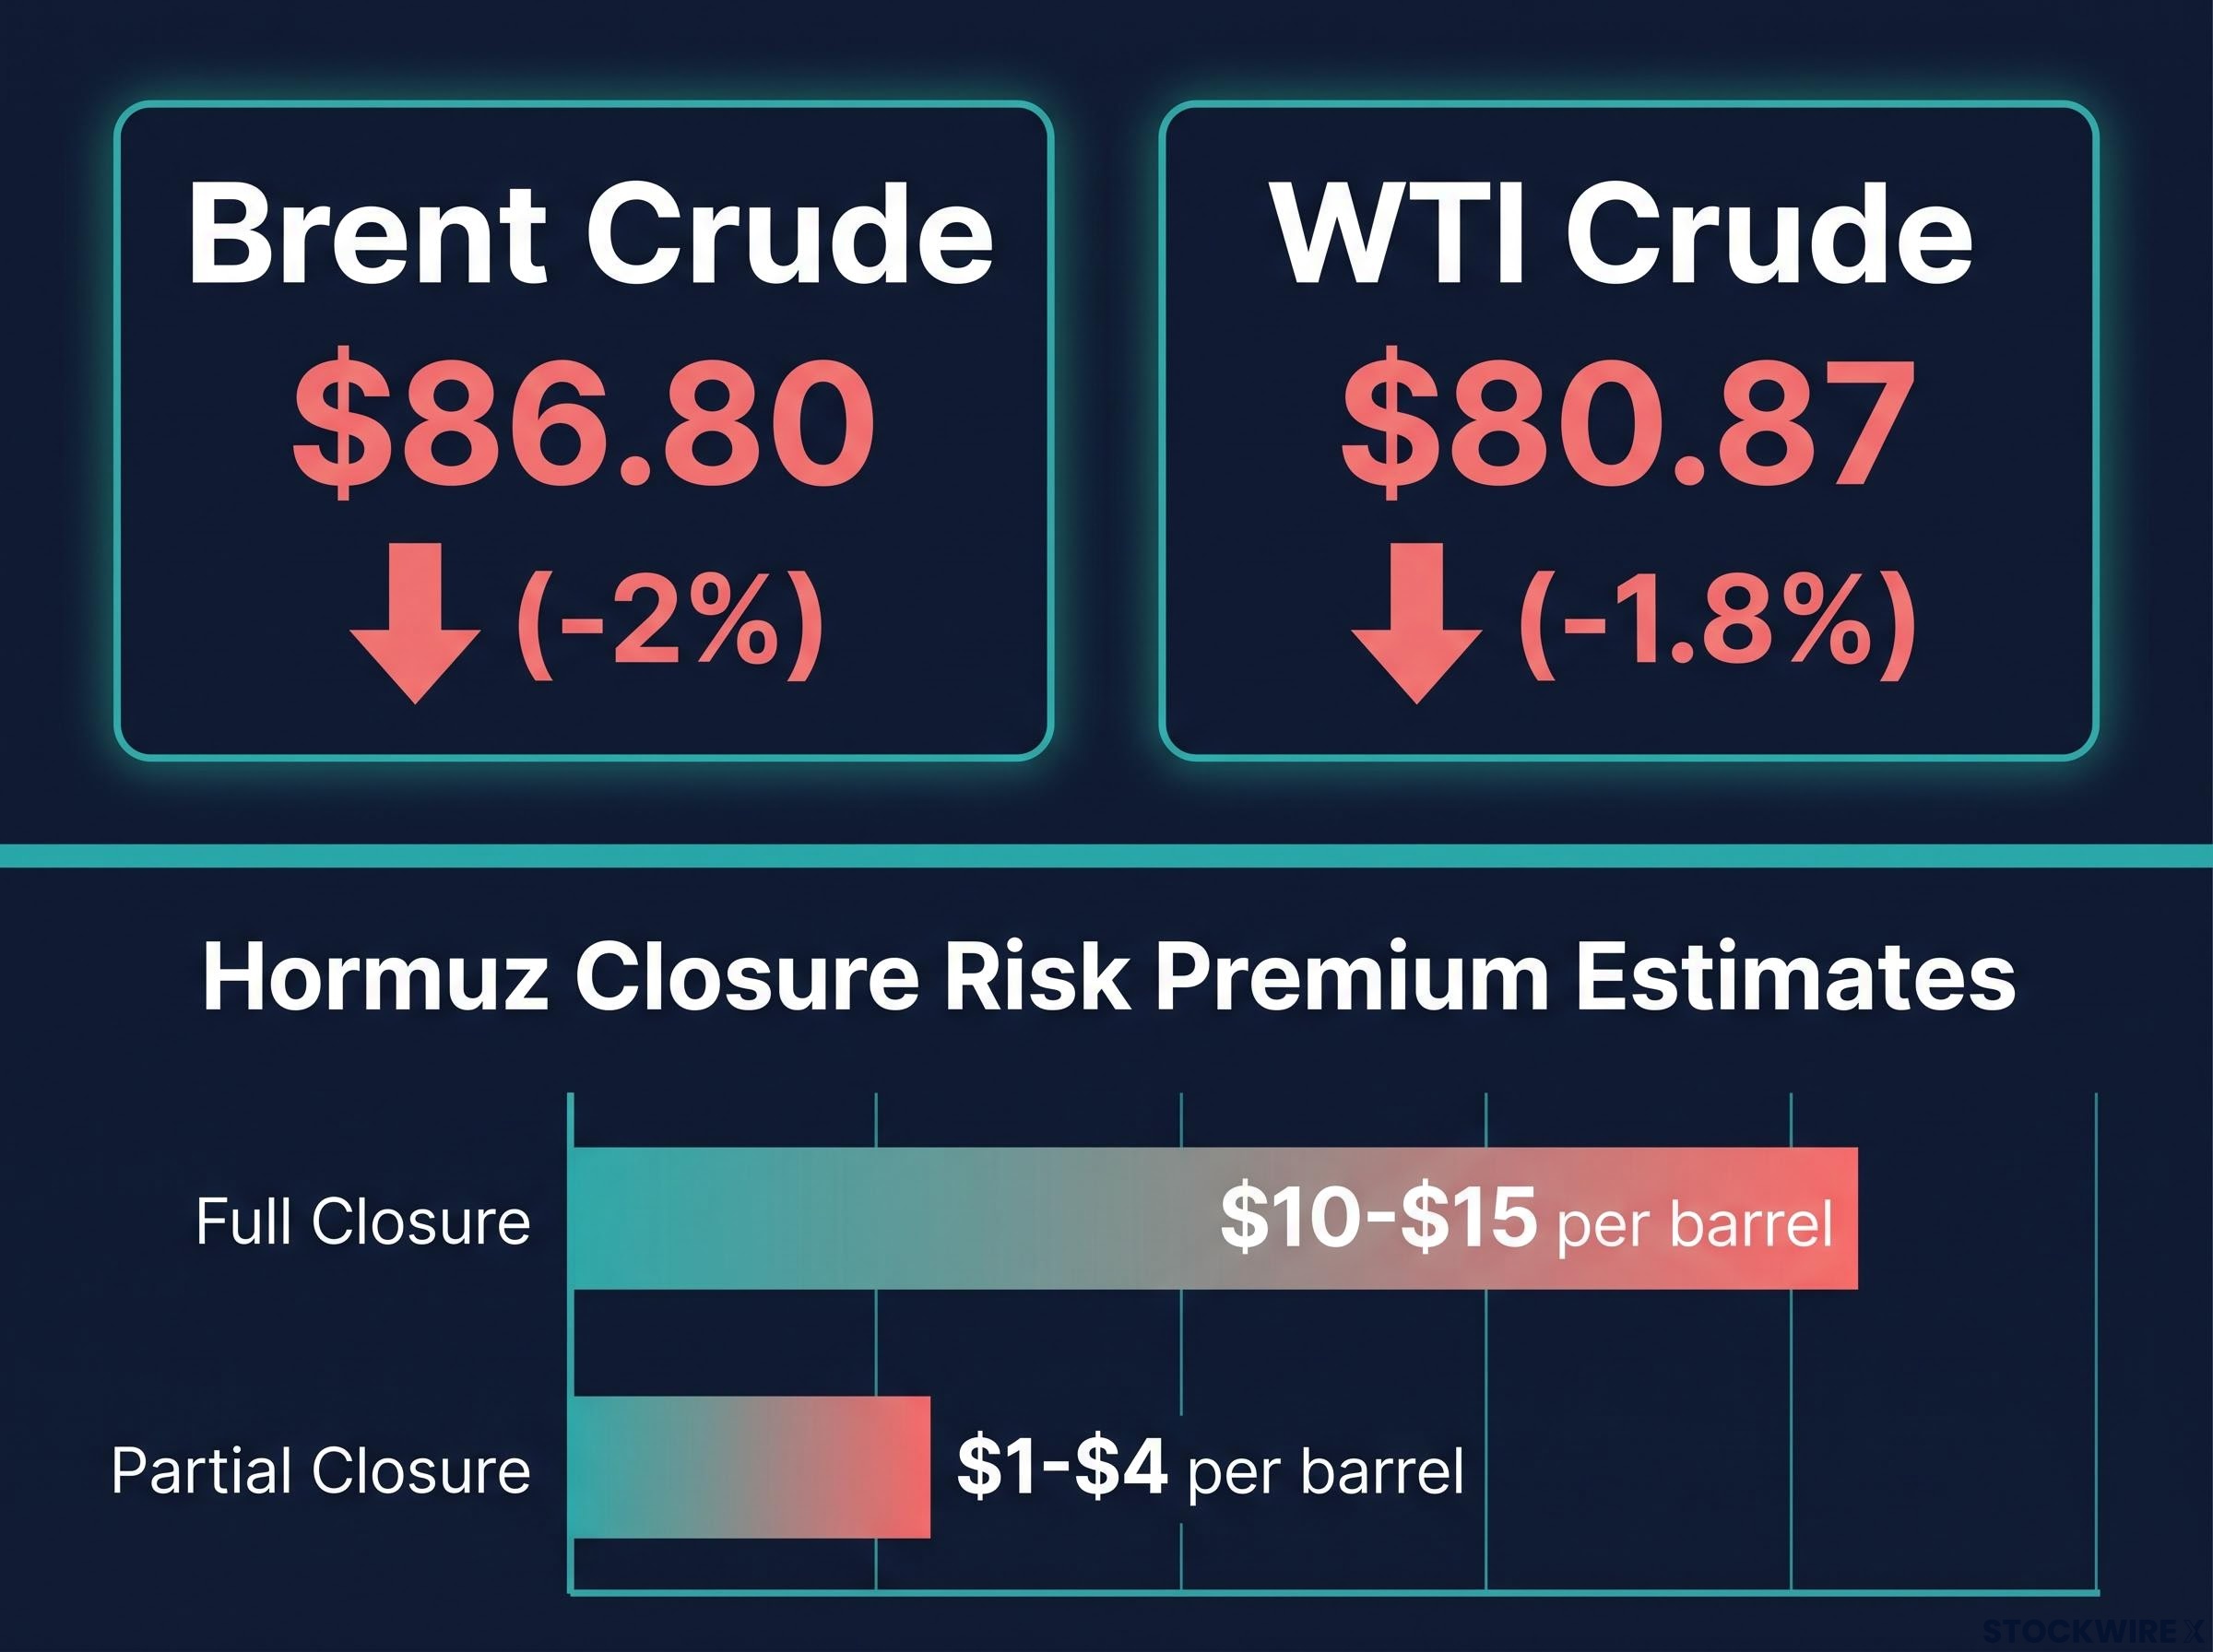
Both Brent and WTI have now recorded losses across three back-to-back trading sessions. The numbers on 26 August:
- Brent crude: approximately -2%, trading near $86.80 per barrel
- WTI crude: approximately -1.8%, trading near $80.87 per barrel
- Session count: third consecutive day of losses
The trigger was specific. On 25 August, Iranian Foreign Minister Abbas Araghchi sat down in Tehran with his Omani counterpart Badr Albusaidi. The meeting produced a joint statement, picked up by the Oman News Agency and the Iranian Foreign Ministry and subsequently reported by Reuters, Bloomberg, and Al Jazeera, that set out a phased framework intended to facilitate safe commercial passage through the Strait of Hormuz.
The Reuters reporting on the Iran-Oman corridor talks confirmed that the joint statement referenced technical progress on corridor geography and mine-clearing, with Gharibabadi’s position on the military status of the strait attributed directly to Iranian foreign ministry statements.
Traders are not pricing in a resolution. They are pricing in a probability shift: the talks produced credible technical progress on corridor geography and mine-clearing, and that is being treated as partial de-escalation. The distinction matters. A probability-weighted risk-premium adjustment behaves differently from a move driven by inventory data or supply decisions, and it can reverse just as quickly if the next round of talks stalls.
Deputy Foreign Minister Kazem Gharibabadi stated explicitly that the temporary Oman route is not a reopening of the Strait of Hormuz. The arrangement covers commercial vessels only; militarily, the strait remains closed.
The third consecutive session of losses is not a demand signal or a supply surplus story. It is a geopolitical premium unwinding on a single diplomatic event, and that tells you exactly how fragile the move could prove to be.
When big ASX news breaks, our subscribers know first
Why 7 miles of water moves global energy markets
Before the conflict, the Strait of Hormuz carried approximately 20% of the world’s traded crude oil and LNG. No other maritime chokepoint comes close in volume. When that corridor narrows or closes, the risk premium baked into crude prices does not move incrementally; it moves in chunks, because the supply at stake is large enough to shift global balances.
Major bank estimates put the price impact of a full one-month closure at $10-$15 per barrel of additional premium, assuming some use of spare pipeline capacity and strategic reserves. For partial closures, analyst estimates suggest $1-$4 per barrel, though this figure remains unverified and should be treated as indicative rather than settled.
The geopolitical risk premium embedded in crude prices does not decompress cleanly on diplomatic headlines: the IEA projects a two-year supply chain recovery timeline even under a best-case resolution, and VLCC daily hire rates, which reached approximately $110,000 per day at peak disruption, are a physical market signal that consistently lags headline agreements by weeks.
| Scenario | Risk premium impact | Notes |
|---|---|---|
| Full closure (one month) | $10-$15 per barrel | Major bank estimates; assumes partial use of spare capacity and reserves |
| Partial closure | $1-$4 per barrel | Analyst estimates; unverified |
| Current arrangement (temporary commercial corridor) | Premium unwinding, not eliminated | Commercial vessels only; military closure remains |
What the temporary corridor actually covers
The proposed corridor is roughly 7 miles wide, operating as a round-trip arrangement. Inbound traffic would use a northern lane through Iranian waters; outbound ships would take a southern lane through Omani waters.
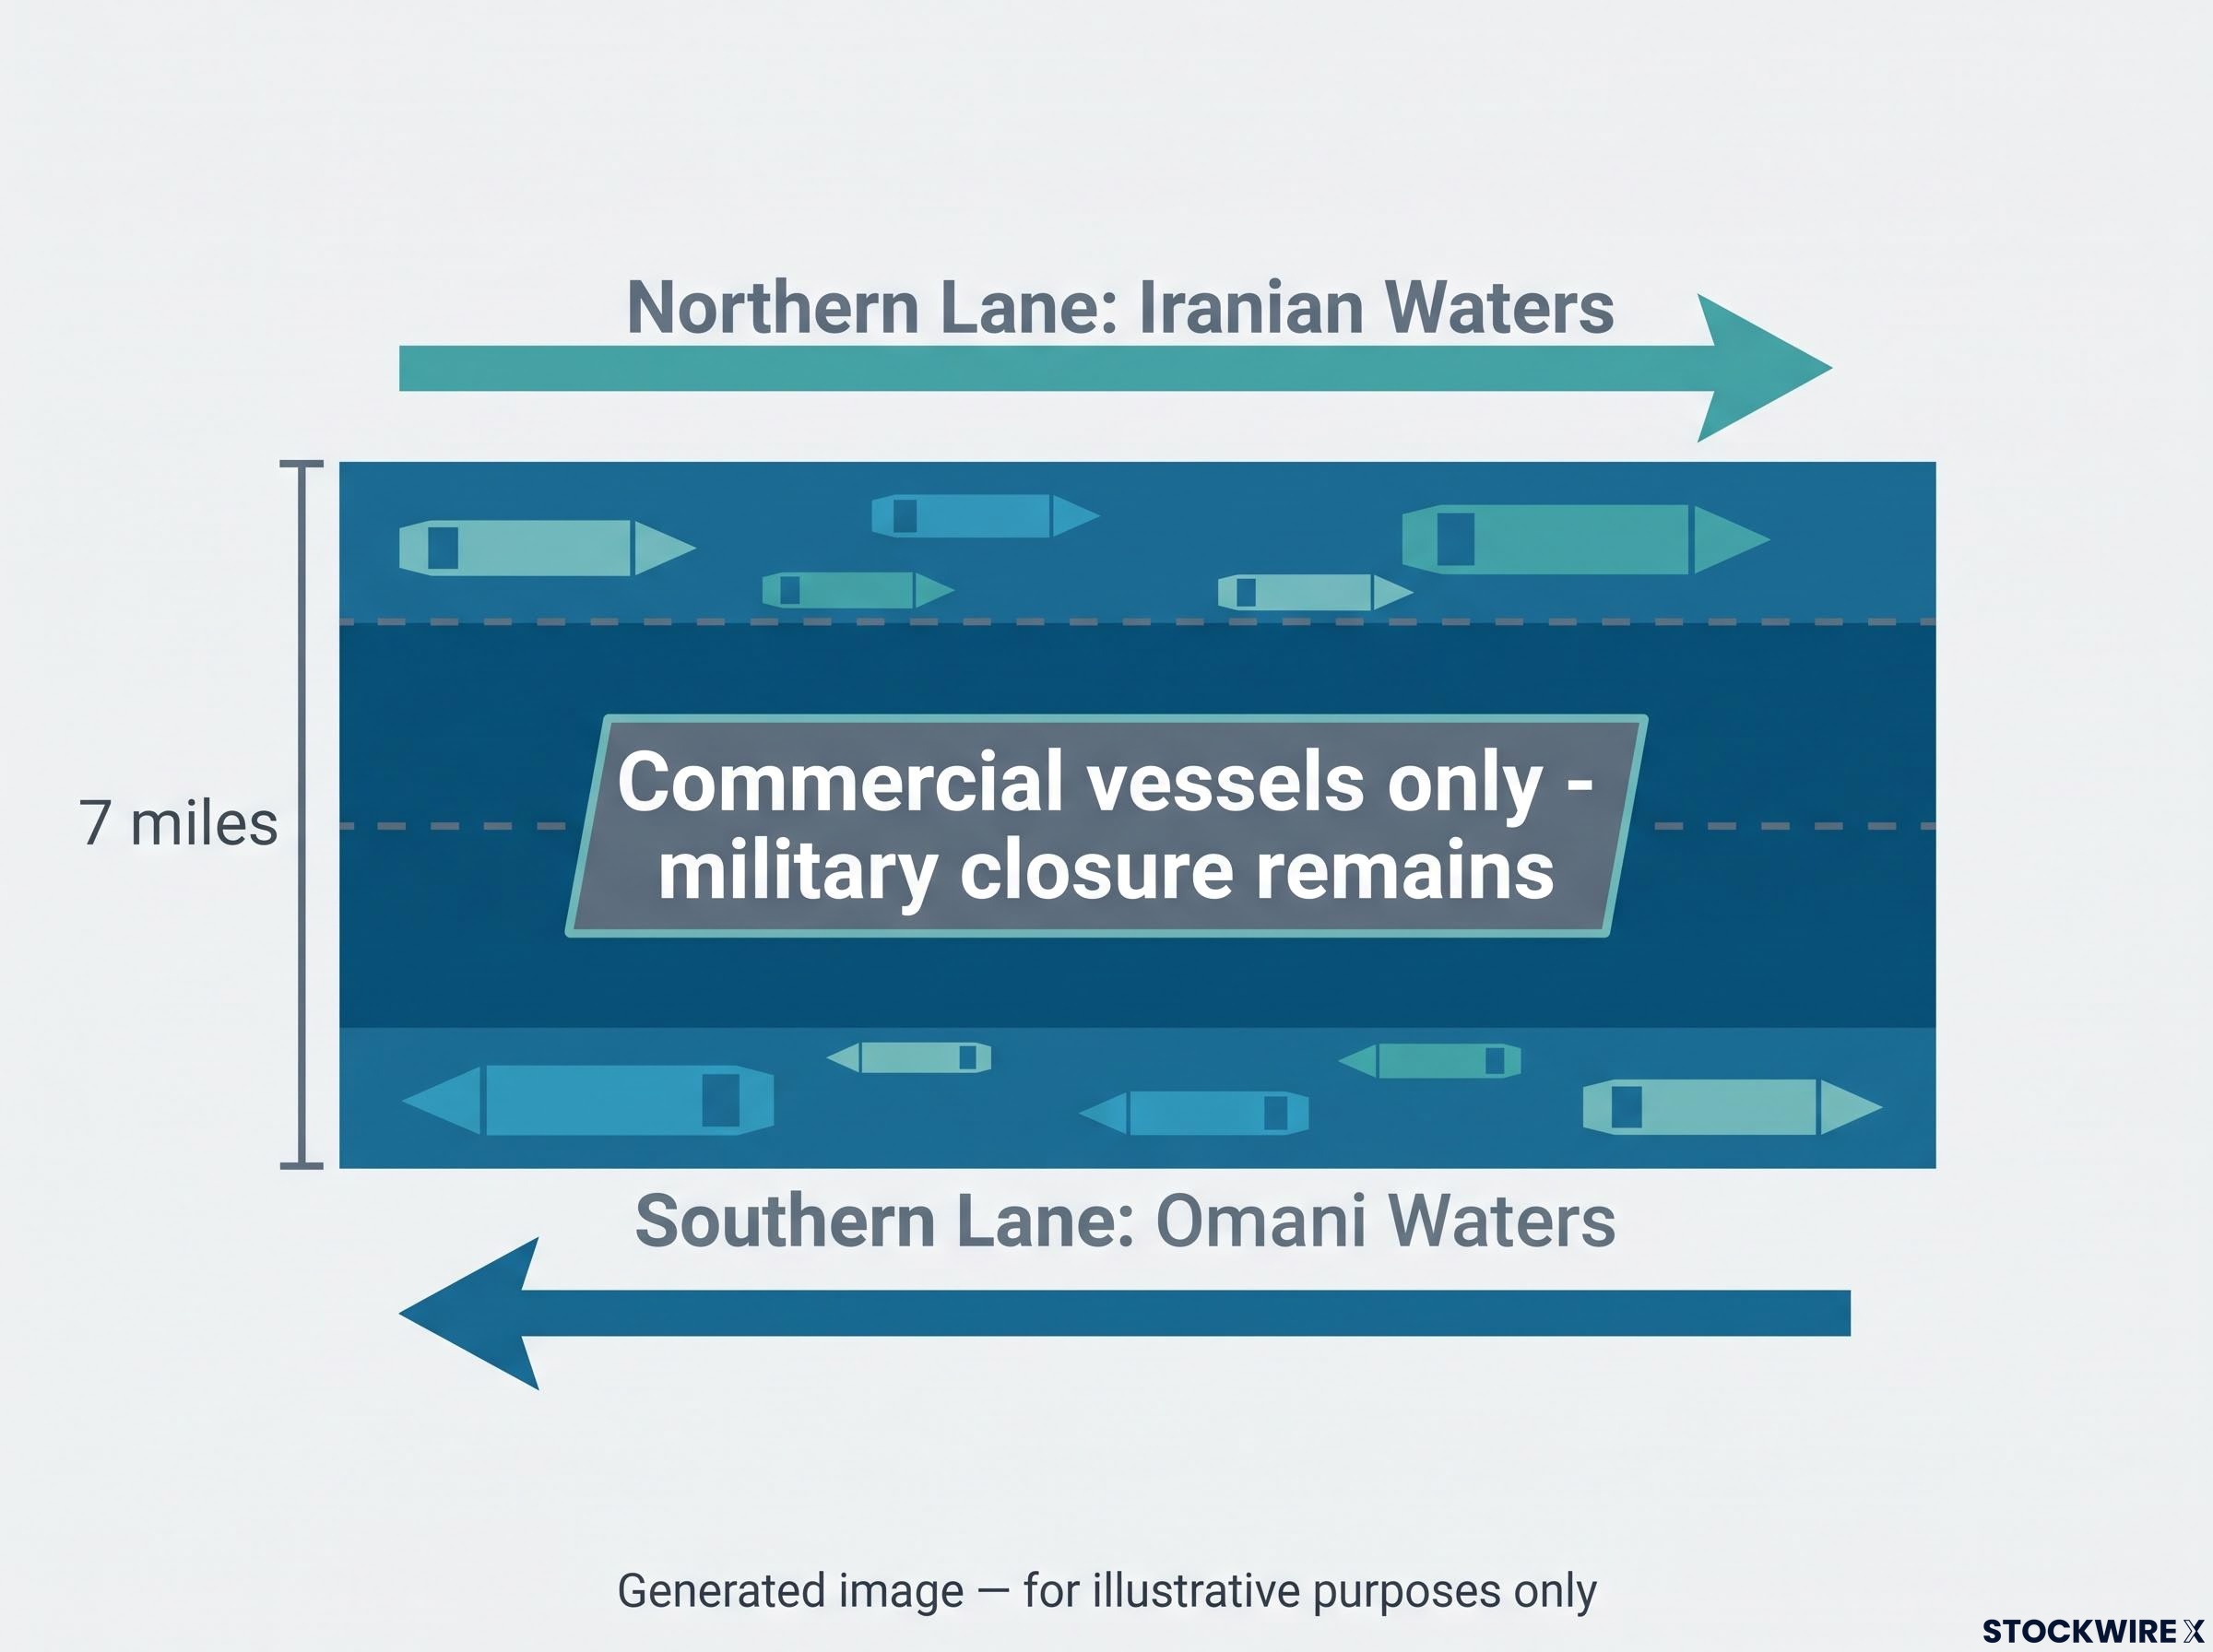
The arrangement is limited to commercial vessels only. The military closure of the strait remains in place. And the 30-60 day window cited in the joint statement is for the next phase of negotiations on a permanent corridor, an administration mechanism, and security services. It is not a confirmed timeline for full resolution.
That scope is precisely why the current oil price relief reflects a narrowly defined improvement. The remaining premium in crude prices is not irrational; it reflects what has not yet been resolved.
Asian markets react: importers up, energy names down
Wednesday’s Asian session saw equity indices move broadly higher, with market participants pointing directly to progress on the Hormuz corridor and the accompanying fall in oil prices as the driver of gains.
| Index | Session move | Level | Driver note |
|---|---|---|---|
| Nikkei 225 | Around +0.7% on the session | Near 66,300 | Import cost relief; broad risk appetite |
| Shanghai Composite | Gained roughly +0.7% | Just above 3,900 | Lower crude eases inflation pressure |
| Hang Seng | Gains in line with Shanghai | — | Broad macro tailwind from oil decline |
| KOSPI | Advanced by over +2% | Near 6,880 | Strongest performer; acute energy import sensitivity |
Data sourced from FXStreet reporting at time of publication.
The structural reasons are straightforward. Net energy importers in Asia benefit directly from lower crude through three channels:
- Reduced fuel import bills, which improve trade balances
- Easing inflation pressure, which gives central banks more room to hold or cut rates
- Lower corporate input costs, particularly for manufacturers and transport operators
But the sector-level picture complicates the headline. Asian oil and gas stocks declined alongside crude, moving inversely to the broader index gains. If you hold diversified Asian equity exposure, this development is a tailwind. If your exposure sits in oil-linked names within those same markets, you are on the other side of the trade.
The KOSPI’s outperformance relative to the Nikkei and Shanghai reflects South Korea’s particularly acute sensitivity to energy import costs. The same catalyst lands differently across markets depending on each economy’s energy dependence, and that variation is worth paying attention to.
The KOSPI’s acute energy sensitivity has been a recurring feature of Hormuz-related equity moves throughout the conflict: when the June 2026 MoU was announced, South Korea’s index led regional gains with a reported rise of approximately 4.6-5.6%, the same outperformance pattern visible in Wednesday’s session against a smaller catalyst.
What still needs to happen before Hormuz fully reopens
The 25 August framework is one step in a multi-phase process, not a final agreement. Talks resumed following a June 2026 US-Iran memorandum of understanding (MOU), a preliminary agreement establishing the conditions under which corridor negotiations could proceed.
Prior framework signals have moved markets before without producing verified reopenings; the June 2026 MoU collapsed before its 60-day window expired, and traders are pricing the August Iran-Oman statement with measurably more caution than they applied to that earlier, more formally structured agreement.
The unresolved conditions fall into three categories:
- US concession requirements: Iran has linked a full reopening of the strait to broader concessions from the United States. Gharibabadi stated this explicitly; the temporary route does not change the military status of the waterway.
- Permanent corridor negotiation timeline: The 30-60 day window covers talks on a permanent corridor, an administration mechanism, traffic management, and security services. A breakdown in this phase would likely reverse the current risk-premium unwind.
- Joint mine-clearing mission status: The two sides agreed in principle to a mine-clearing project, but commencement has not been confirmed.
Gharibabadi’s position is unambiguous: the temporary commercial corridor is not a reopening. The strait will not return to its pre-conflict status without additional conditions being met by the United States.
The gap between diplomatic statements and physical reality is substantial: Hormuz shipping data shows commercial transits running at just 3-14 vessels per day against a pre-war baseline of 120-140, with war-risk insurance premiums approximately 30 times normal rates and maritime unions classifying the waterway as an active war zone.
Oil remains well above early-2026 levels despite the recent declines. The current move is premium reduction, not a return to prior equilibrium. For anyone trying to gauge how durable this relief is, the 30-60 day negotiation window is the single most important number to watch.
This article is for informational purposes only and should not be considered financial advice. Investors should conduct their own research and consult with financial professionals before making investment decisions.
These statements regarding the trajectory of corridor negotiations and oil prices are speculative and subject to change based on market developments and geopolitical conditions.
Reading the Hormuz signal without overreacting to it
The cross-asset picture as of this morning: oil is down on a risk-premium unwind, Asian importers are up, energy names are down, and all of it is conditional on talks that have a 30-60 day clock running. This pattern, importer indices rising while energy names fall on corridor headlines, has appeared repeatedly during earlier phases of the conflict. It is not new. What is new is the specificity of the framework behind it.
The right framing is not whether this is good or bad for markets. It is what has actually changed and what has not. Commercial shipping probability improved. Military risk has not moved. Crude remains elevated. The next decision point is 30-60 days away.
Three variables that will determine the next move in oil
- Permanent corridor negotiations: Whether the next-phase talks produce agreement on administration, traffic management, and security within the stated window.
- US policy response: Any formal US reaction to the Iran-Oman framework will signal whether Washington views this as progress or an insufficient step.
- Mine-clearing mission commencement: Physical clearance work beginning on schedule would be the strongest signal yet that the arrangement is moving beyond paper.
Geopolitical catalysts like this one are priced in fast and can reverse just as fast. These three watchpoints give you a concrete filter for evaluating whether subsequent Hormuz headlines represent genuine progress or noise.