
ASX 200 Surges 138 Points as US-Iran Ceasefire Reports Hit Markets
6 hrs ago

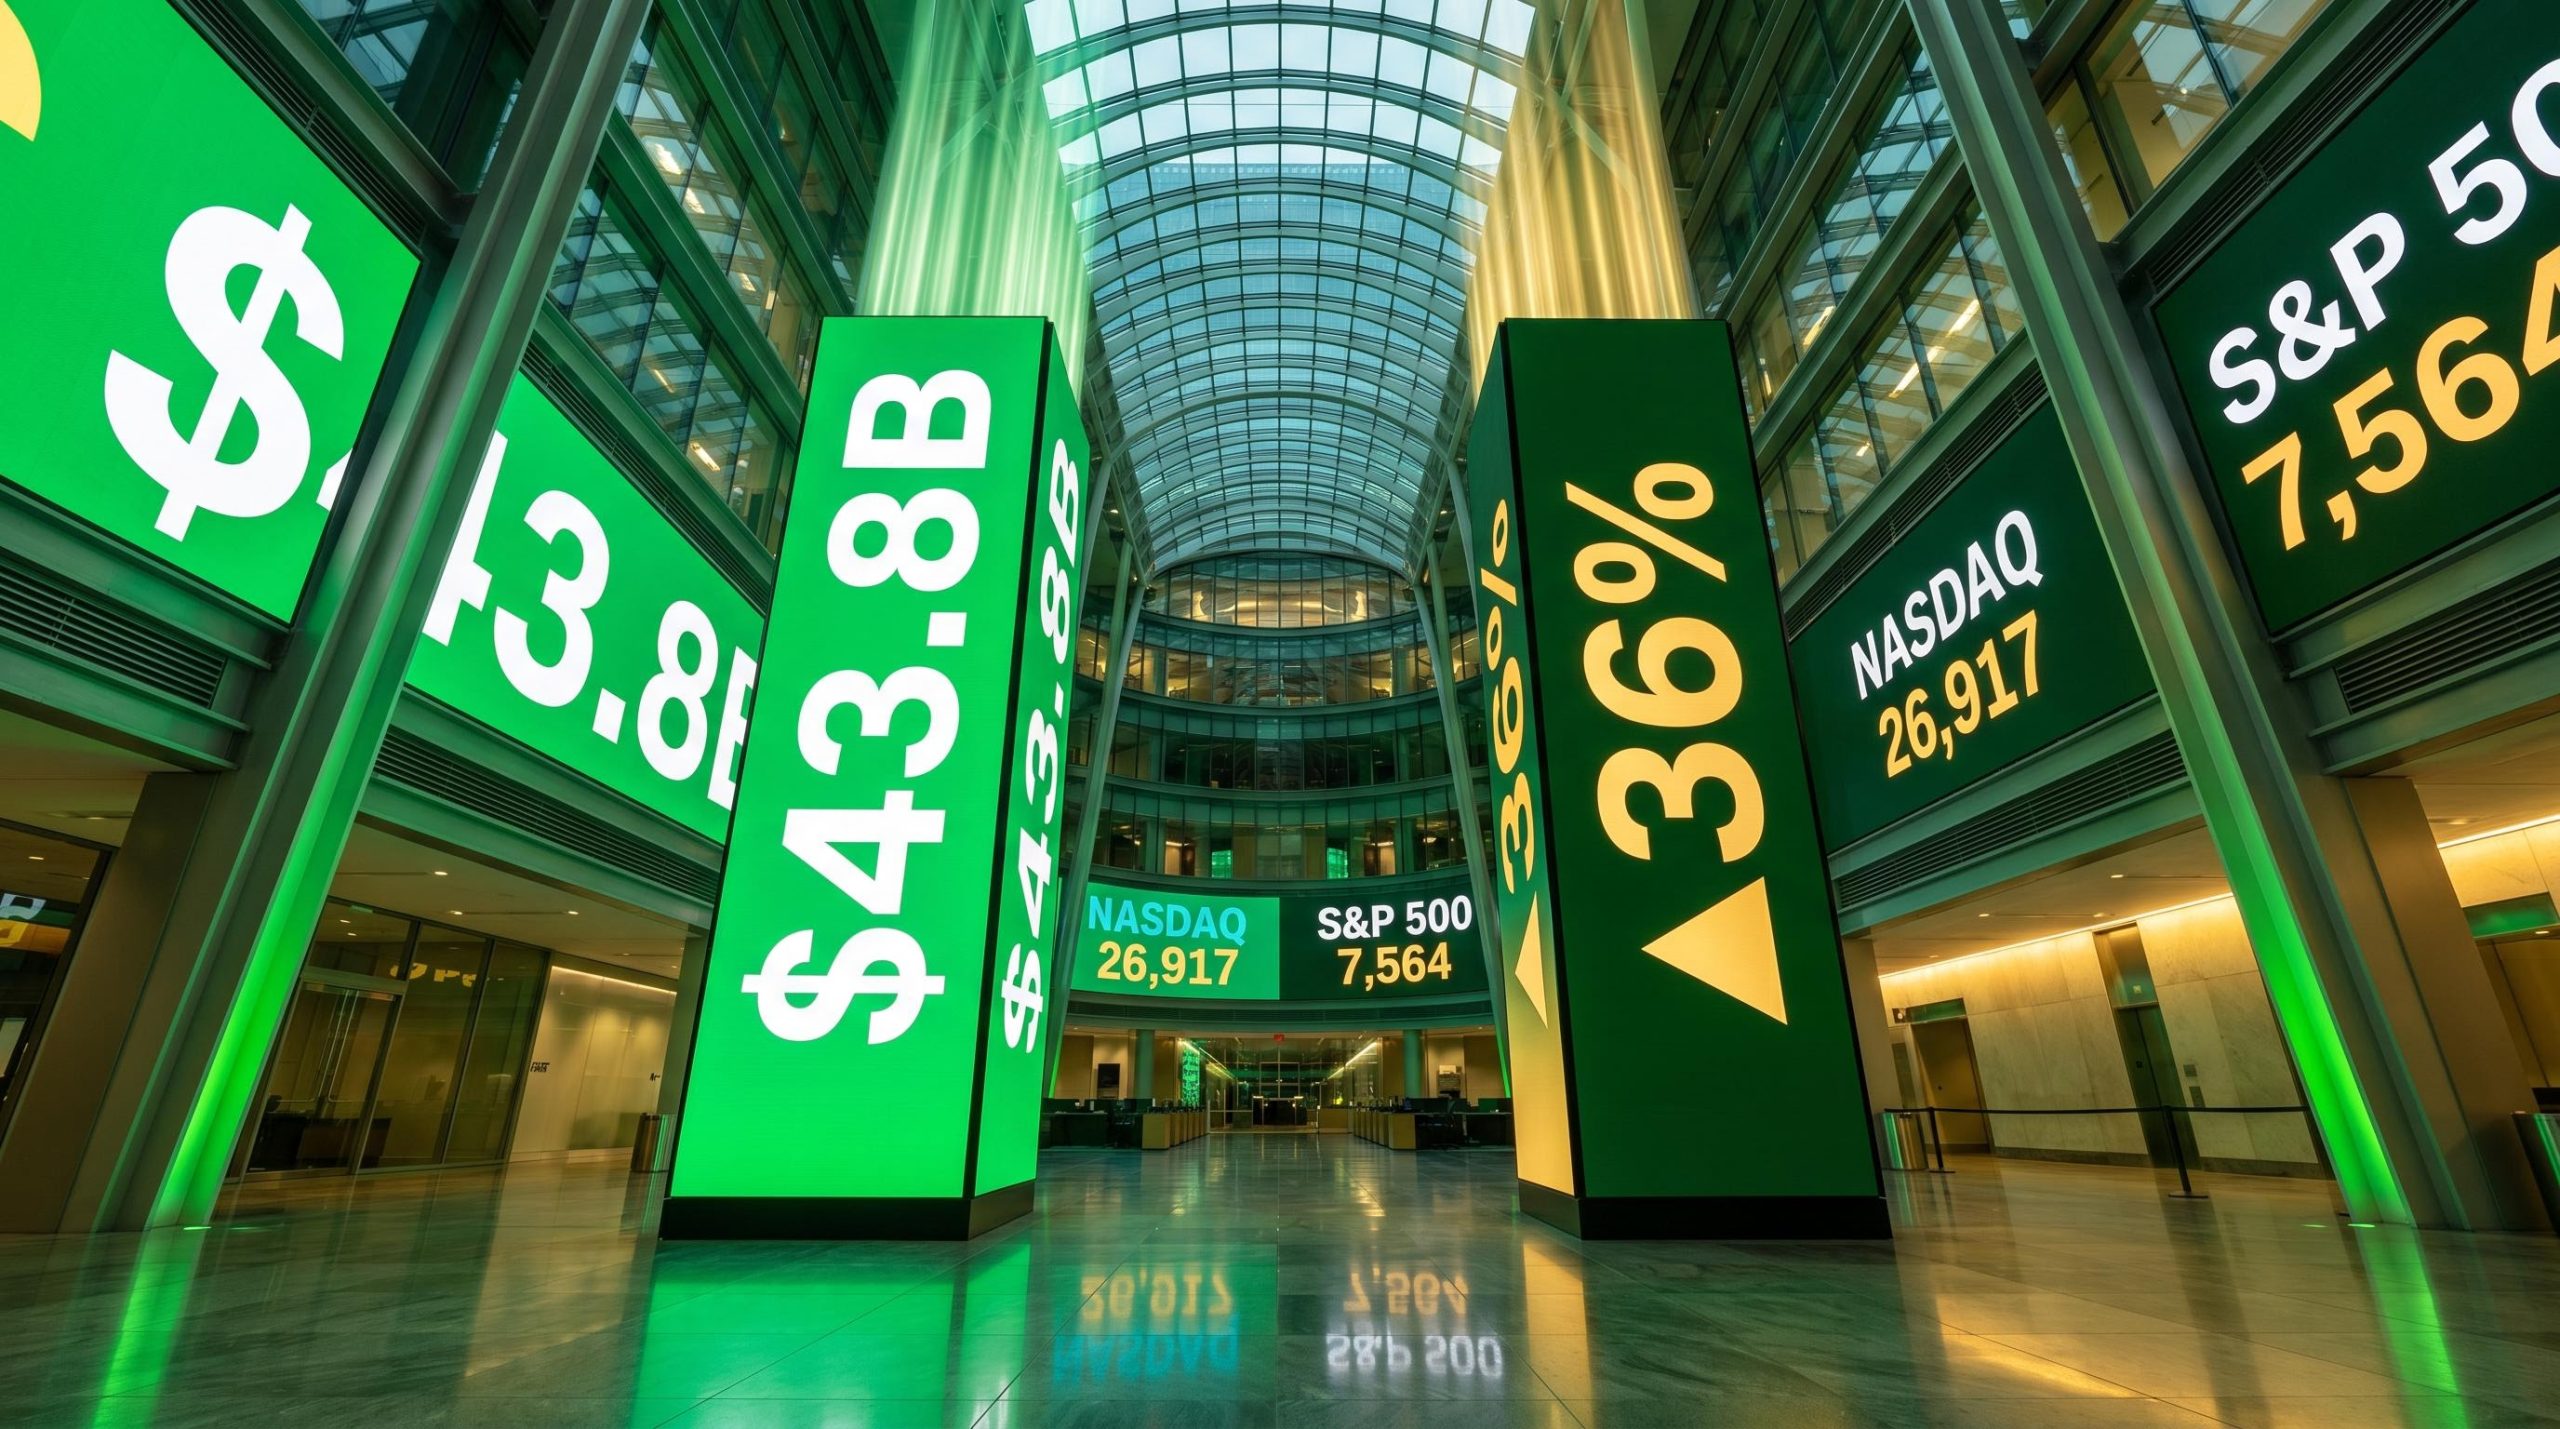
On 29 May 2026, all four major US equity benchmarks closed at simultaneous record highs, propelled by two technology earnings reports that exceeded analyst forecasts by margins wide enough to restart the AI investment trade in a single session. Snowflake delivered 34% product revenue growth and a $6 billion AWS partnership that sent shares up 36%. Dell posted $43.8 billion in quarterly revenue, beating the $35 billion consensus by $8.8 billion, on the back of $24.4 billion in AI-related orders. The results landed as investors debated whether the AI trade had peaked, making the scale of both beats particularly market-moving. What follows is a breakdown of each company’s results, what the Philadelphia Semiconductor Index’s near-75% year-to-date surge signals about where this AI cycle sits historically, and what one prominent positioning warning means for investors watching from the sidelines.
The S&P 500 closed at 7,564, up 0.58%. The Nasdaq Composite led at 26,917, up 0.91%. The Dow Jones Industrial Average reached 50,669, up 0.05%, while the Russell 2000 hit 2,937, up 0.57%.
Simultaneous record closes across all four benchmarks represent a rare breadth event. It is the kind of session that tends to generate headline optimism about broad-based strength.
The underlying concentration tells a different story. The equal-weighted S&P 500 rose 0.37%, lagging the cap-weighted version by 21 basis points. That gap confirms that large-cap technology names, not the broader market, drove the bulk of the session’s gains. The rally is real, but it has a narrow driver.
The 21 basis point lag of the equal-weighted S&P 500 on 29 May is one data point in a pattern that has been building throughout 2026; S&P 500 market breadth analysis from April showed only 23% of index constituents outperforming the benchmark during a month that produced a 98th-percentile headline return, suggesting the concentration dynamic predates this week’s AI earnings catalyst by several weeks.
| Index | Close | Session Change |
|---|---|---|
| S&P 500 | 7,564 | +0.58% |
| Dow Jones Industrial Average | 50,669 | +0.05% |
| Nasdaq Composite | 26,917 | +0.91% |
| Russell 2000 | 2,937 | +0.57% |
| Equal-Weighted S&P 500 | — | +0.37% |
Record closes generate headlines. Positioning dynamics determine what happens next.
Scott Rubner of Citadel observed, via Bloomberg, that the directional pain trade for equities remains to the upside as of 29 May 2026, with many investors feeling insufficiently positioned for the rally.
The pain trade, in plain terms, describes a market moving in the direction that causes maximum discomfort to the largest number of participants. When the pain trade is to the upside, it means that underweight investors face the worst outcome from continued gains, because they are forced to chase higher prices or explain to clients why they missed the move.
This dynamic can become self-reinforcing. Simultaneous all-time highs across four benchmarks create urgency among underpositioned allocators. That urgency drives inflows, which push prices higher, which increases the urgency further. The result is a rally that can extend beyond what fundamentals alone would justify, sustained by positioning mechanics rather than earnings revisions.
Stock market concentration at the index level provides the structural backdrop for that positioning dynamic: five US mega-cap companies now control roughly 30% of total US equity market capitalisation, a figure Wolfe Research describes as without historical precedent, meaning that underpositioned allocators chasing record highs are, in practice, chasing a very small number of names.
For investors deciding whether to add exposure at record highs, understanding that a positioning squeeze may be amplifying the move provides context that pure earnings analysis does not capture.
The numbers came first, and they were emphatic:
A 22% EPS beat and 34% product revenue growth would ordinarily move a cloud stock 5-10%. Snowflake moved 36%.
Snowflake shares surged approximately 36% in a single session following the Q1 FY27 earnings release, according to CNBC.
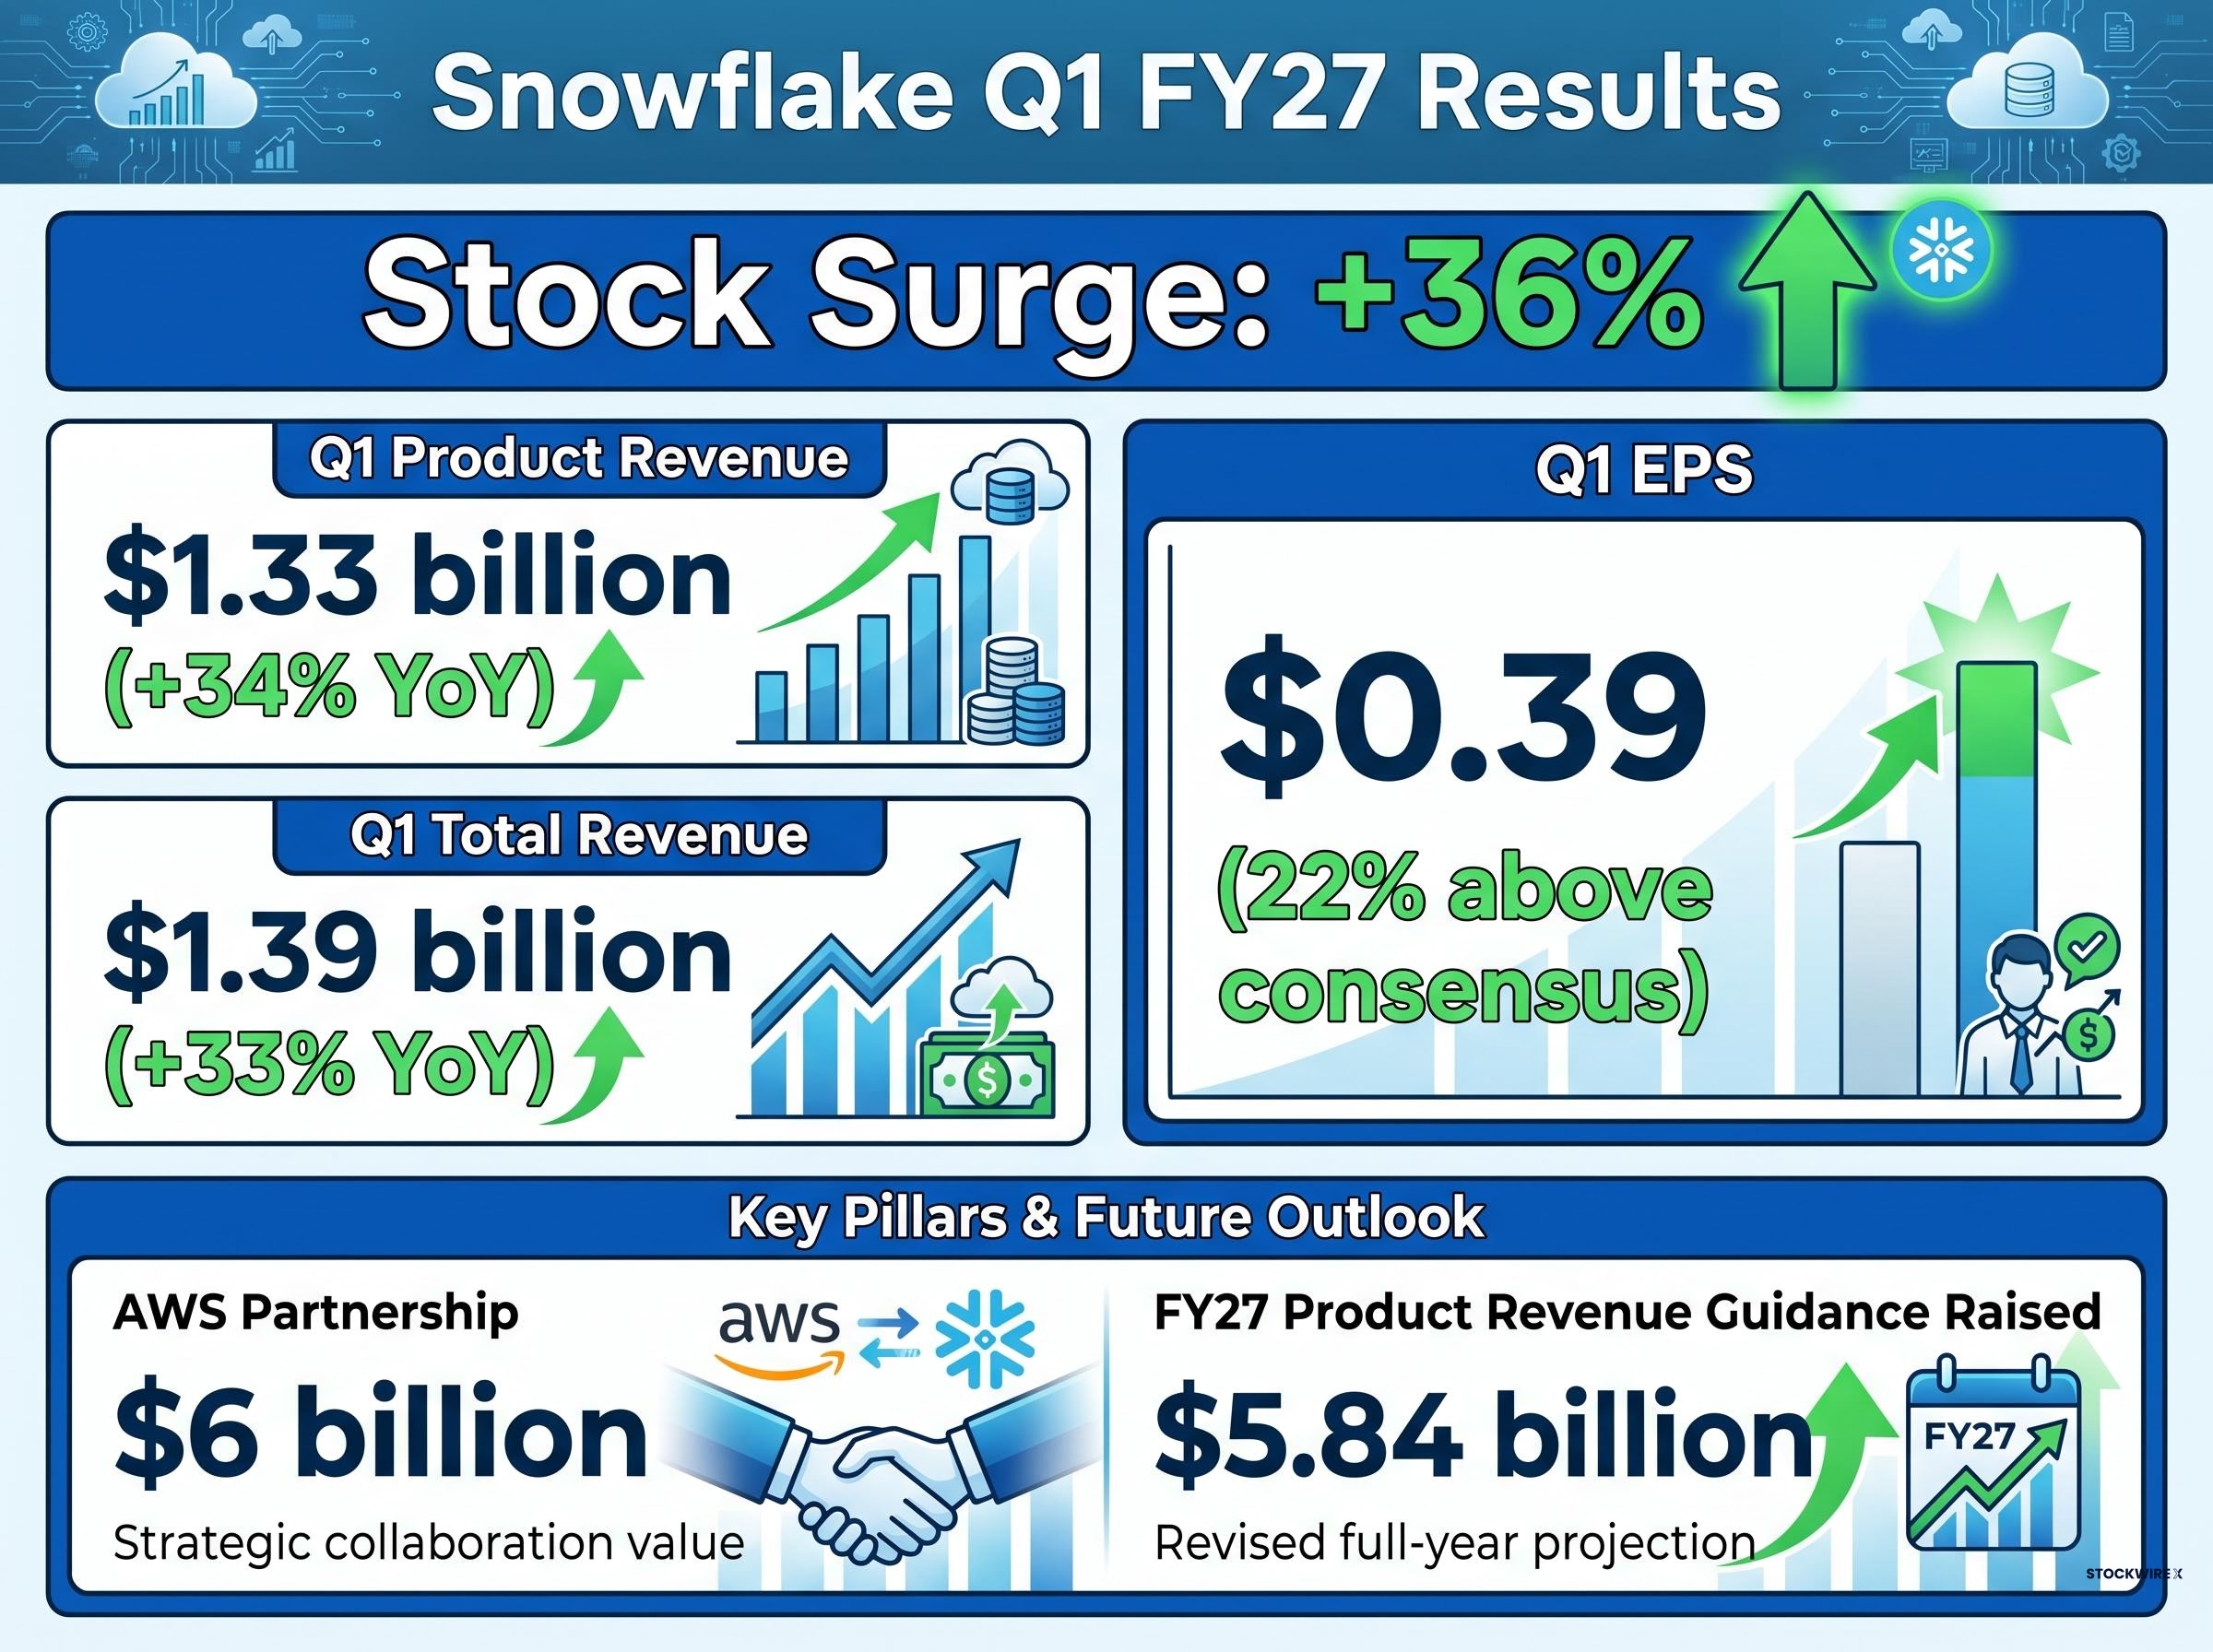
The difference was the $6 billion AWS partnership agreement. Where the revenue beat confirmed the current quarter, the AWS deal validated Snowflake’s positioning in the enterprise AI infrastructure stack over a multi-year horizon. It signalled that hyperscaler partners are committing contracted capital to Snowflake’s cloud data platform, not just routing transactional workloads through it.
The raised full-year guidance of $5.84 billion reinforced the forward signal. For investors tracking AI software and cloud data infrastructure, the combination of a beat, a guidance raise, and a partnership of that scale confirms that enterprise AI workloads are translating into durable, contracted revenue.
Wall Street expected $35 billion. Dell reported $43.8 billion.
That $8.8 billion gap between analyst consensus and actual quarterly revenue is not a routine beat. It is the kind of miss in forecasting that forces a reassessment of the models underpinning AI hardware demand estimates across the sector.
Dell’s Q1 FY27 earnings release confirmed non-GAAP EPS of $4.86, up 214% year-over-year, alongside record quarterly revenue of $43.8 billion, figures that forced a broad reassessment of AI hardware demand models across the analyst community.
The earnings per share told the same story at the bottom line. Dell’s non-GAAP EPS came in at $4.86, up 214% year-over-year, according to the company’s Q1 FY27 earnings 8-K filed with the SEC. Revenue grew 88% year-over-year, making this the company’s largest quarter on record.
| Metric | Analyst Consensus | Dell Reported | Beat |
|---|---|---|---|
| Q1 FY27 Revenue | ~$35B | $43.8B | ~$8.8B (+25%) |
| Non-GAAP EPS | — | $4.86 | +214% YoY |
Then came the pipeline figure.
Dell reported $24.4 billion in AI-related orders during Q1 FY27, providing a forward demand signal that extends well beyond a single quarter.
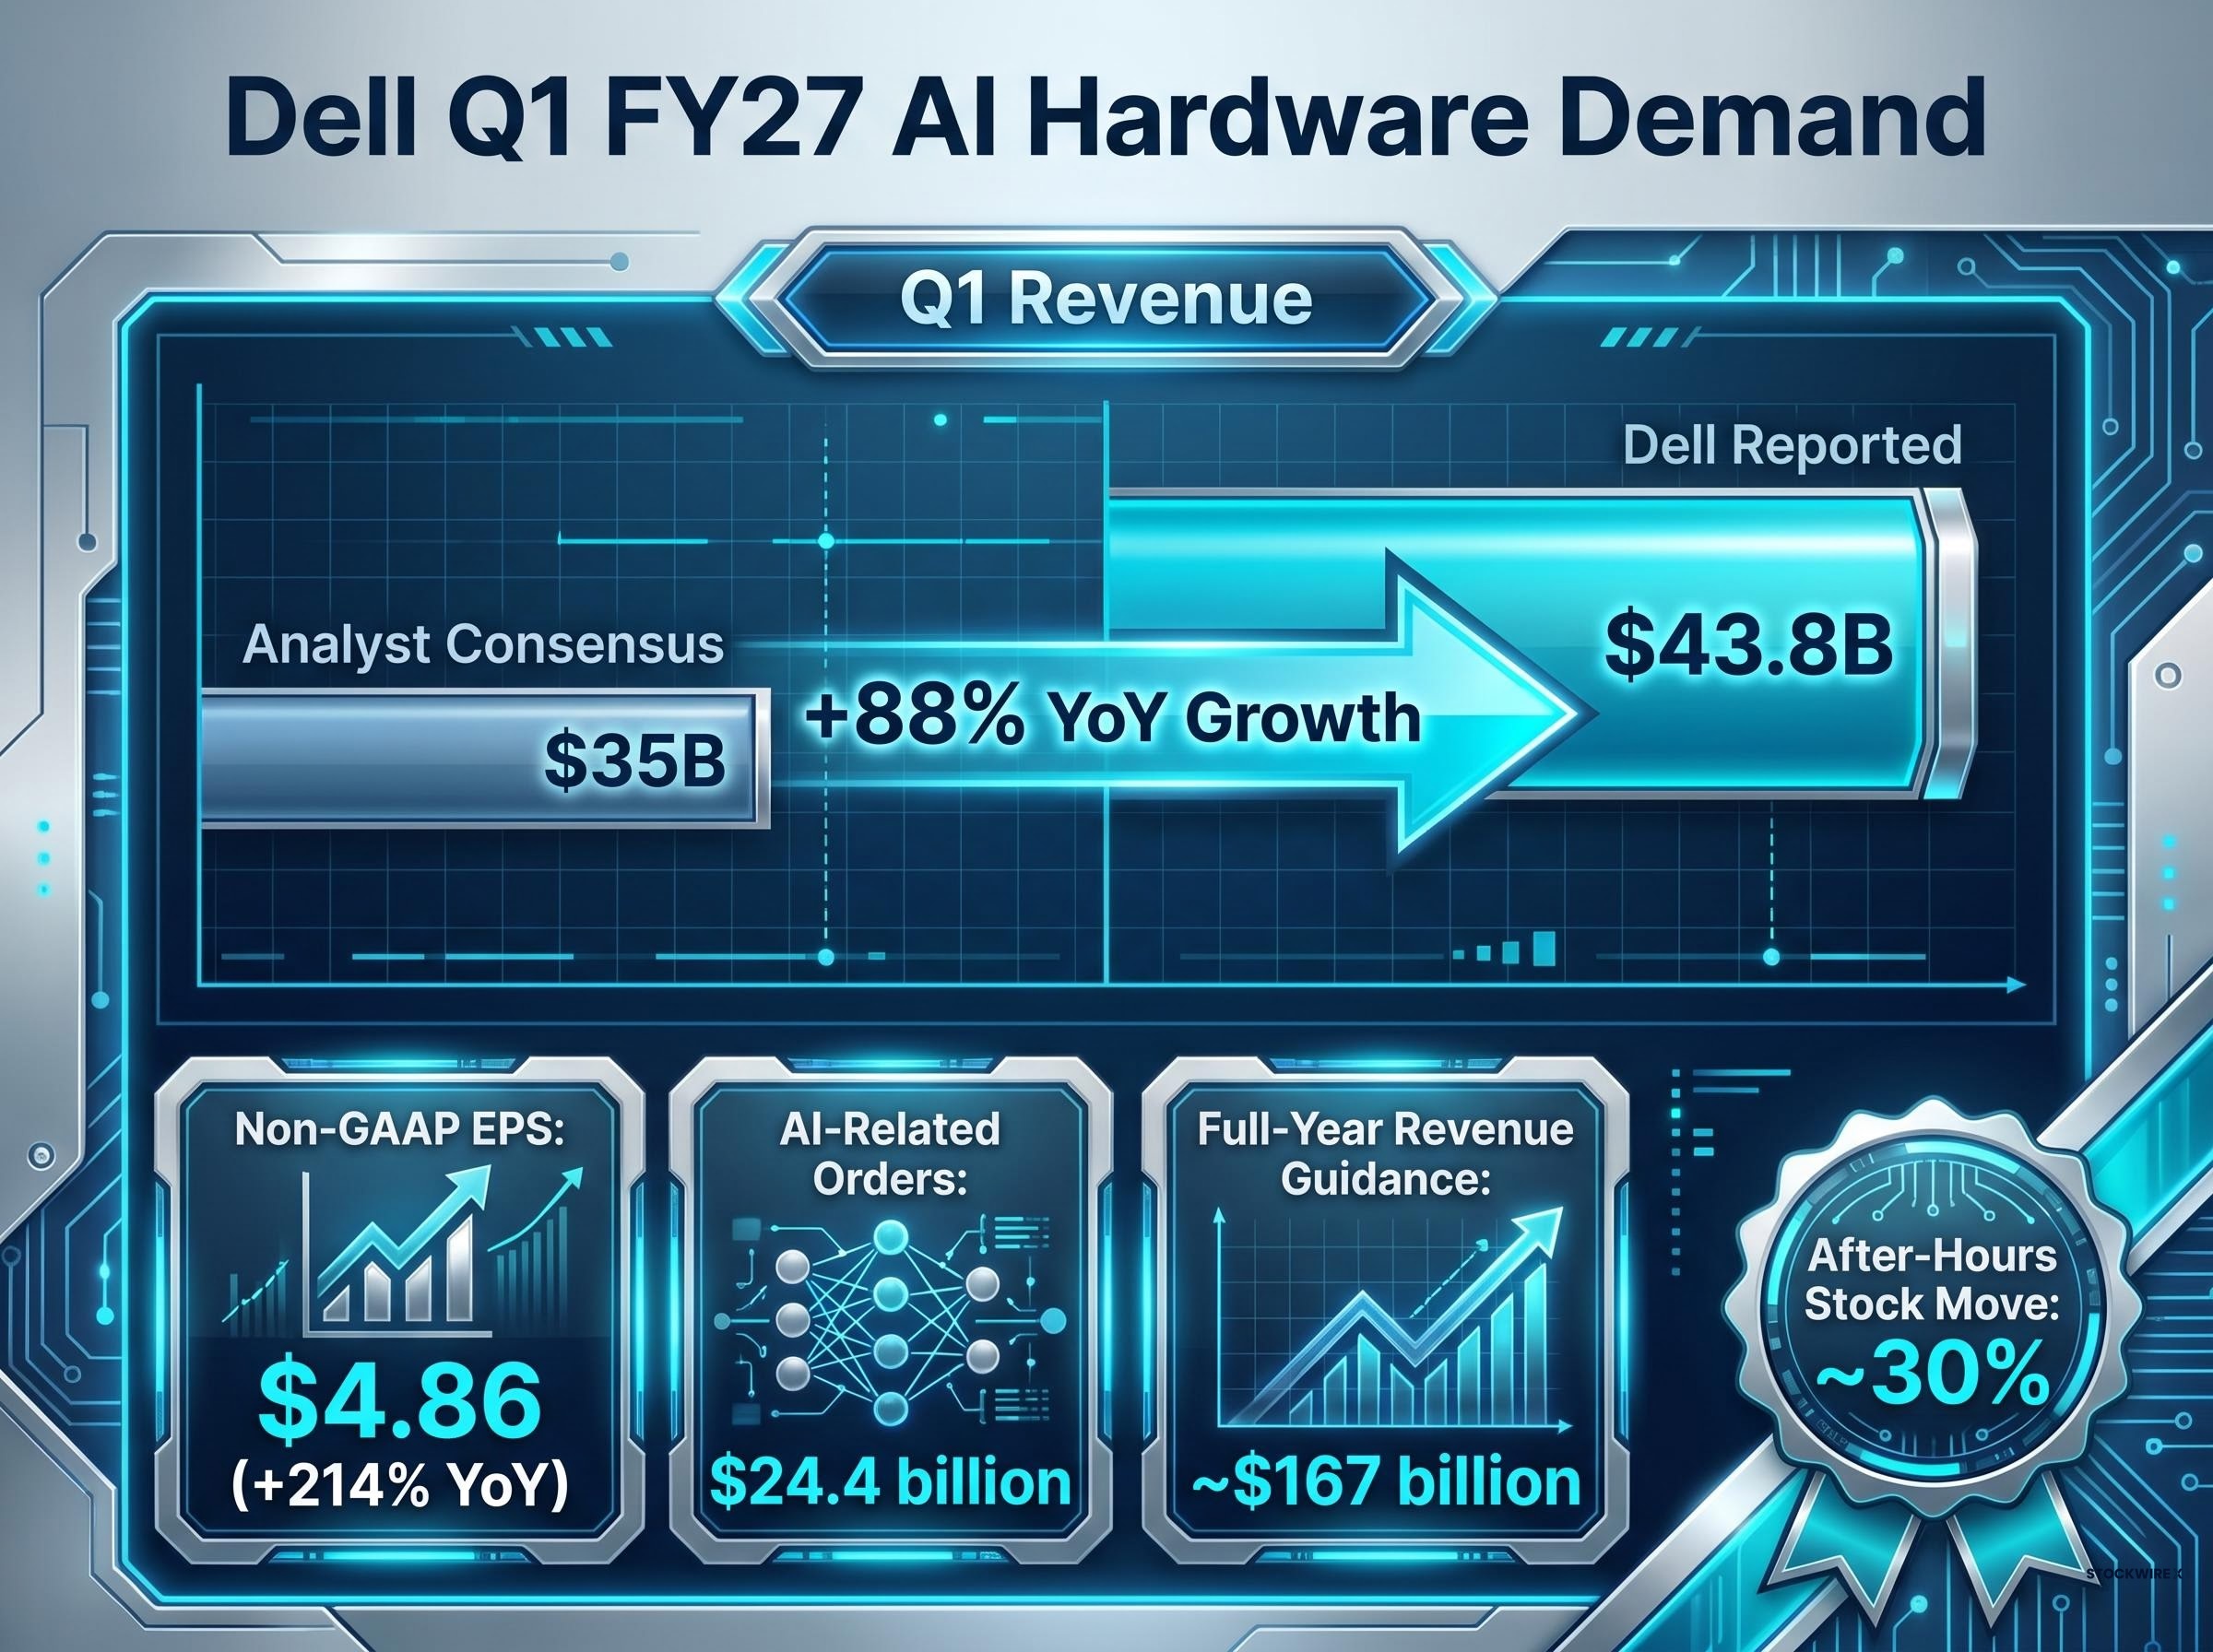
That $24.4 billion order book is what justified the raised full-year guidance of approximately $167 billion in annual revenue. Dell shares climbed approximately 30% in after-hours trading. The AI hardware cycle, based on this data, is accelerating rather than plateauing.
The Philadelphia Semiconductor Index (SOX) tracks the performance of major semiconductor design and manufacturing companies listed in the United States. It includes the firms that produce the chips powering AI training clusters, data centre infrastructure, and the server hardware that companies like Dell sell into enterprise markets.
Semiconductors sit at the foundational layer of the AI infrastructure stack. When chip companies report strong demand, it confirms that the spending cycle feeding cloud platforms (Snowflake) and hardware providers (Dell) has physical supply commitments behind it. The SOX functions, in practice, as the AI cycle’s leading indicator.
As of 29 May 2026, the SOX has surged approximately 75% year-to-date.
The Wall Street Journal characterised the semiconductor sector’s 2026 gains as the strongest since the dotcom era.
That comparison is double-edged. It signals extraordinary momentum, the kind that produces outsized returns for positioned investors. It also references a precedent where outsized sector gains eventually corrected sharply.
The distinction worth noting: the current AI cycle has underlying revenue fundamentals that the dotcom era largely lacked. Dell’s $24.4 billion in AI orders and Snowflake’s 34% product revenue growth represent verifiable enterprise demand, not speculative projection. The comparison is contextual, not predictive, but it warrants attention from investors sizing positions at these levels.
The dotcom comparison holds differently depending on which part of the sector you examine: semiconductor stock valuations in 2026 range from Micron at under 9x forward earnings to Intel at approximately 101x, nearly three times Intel’s own dot-com-era peak, which means the WSJ’s characterisation of the SOX’s gains as the strongest since the dotcom era describes a sector where bubble conditions and genuine earnings strength coexist within the same index.
The core data signals from this earnings cycle converge on a single conclusion:
Analyst price-target revisions, named institutional commentary on Dell’s demand sustainability, and post-record positioning flow data remain pending as of publication and are expected to emerge in the coming days.
The forward question is whether the AI hardware and software cycles are entering a compounding phase, where each strong earnings report draws forward the next wave of enterprise spending commitments, or whether record-high valuations have already priced in that scenario. The evidence from this week’s results supports the former reading, but the concentration of gains in large-cap names and the historical weight of the dotcom comparison suggest the question remains open.
For investors wanting to stress-test the acceleration thesis against the risk case, our full explainer on the semiconductor capex-to-revenue lag examines the 18-24 month timing gap identified by Morningstar between committed capex and measurable revenue, alongside Gartner’s estimate that only 20% of current AI agent pilots are scalable to production by 2027, providing a structured framework for evaluating how much of the SOX’s 75% year-to-date gain reflects priced-in fundamentals versus priced-in expectations.
This article is for informational purposes only and should not be considered financial advice. Investors should conduct their own research and consult with financial professionals before making investment decisions.
Simultaneous all-time highs across all four major US benchmarks, anchored by Snowflake’s 34% revenue growth and Dell’s 88% quarterly surge, confirm that the AI trade in mid-2026 is built on verifiable enterprise revenue rather than speculative projection. The concentration caveat remains: large-cap names are doing the work, and the 21 basis point equal-weighted underperformance signals that the rally’s breadth should be monitored alongside its headline numbers.
The next AI-sector data points to watch are follow-on analyst guidance revisions, enterprise capital expenditure commentary from hyperscalers in the weeks ahead, and whether the SOX can sustain its year-to-date gains through the next earnings cycle.
Past performance does not guarantee future results. Financial projections are subject to market conditions and various risk factors.
—
The Philadelphia Semiconductor Index (SOX) tracks major US-listed semiconductor design and manufacturing companies, and it functions as a leading indicator for the AI investment cycle because chips power the data centres, AI training clusters, and server hardware that AI infrastructure depends on. As of 29 May 2026, the SOX had surged approximately 75% year-to-date, a pace the Wall Street Journal described as the strongest since the dotcom era.
Dell reported Q1 FY27 revenue of $43.8 billion against a Wall Street consensus of approximately $35 billion, a beat of roughly $8.8 billion or 25%. The company also reported non-GAAP EPS of $4.86, up 214% year-over-year, alongside $24.4 billion in AI-related orders during the quarter.
Snowflake's 36% single-session gain was driven by a combination of 34% product revenue growth, a 22% EPS beat versus consensus, a full-year guidance raise to $5.84 billion, and a $6 billion AWS partnership that signalled multi-year contracted demand from a major hyperscaler for its cloud data platform.
The pain trade refers to the market direction that causes maximum discomfort to the most participants; when it is to the upside, as Citadel's Scott Rubner observed on 29 May 2026, underweight investors face pressure to chase higher prices or risk underperforming, which can become self-reinforcing as inflows push prices further up.
The rally was heavily concentrated in large-cap technology names: the equal-weighted S&P 500 rose only 0.37% compared to the cap-weighted S&P 500's 0.58% gain, a 21 basis point gap confirming that broad market participation was limited even as all four major benchmarks closed at record highs.