
UK wages are still climbing faster than the Bank of England would like, the pound is sliding anyway, and the central bank is expected to sit on its hands when the Monetary Policy Committee (MPC) meets this Thursday, 17 September 2026. That combination is the puzzle at the heart of sterling right now.
The proximate trigger is the labour market data released on 14 September 2026, which showed hiring cooling while pay pressure lingers. Behind it sits the structural backdrop: a Bank Rate expected to stay at 3.75% for a fifth straight meeting, which strips sterling of any near-term policy support.
This is a UK-domestic story, not a dollar-strength story. The pressure on the pound is being generated at home, in the interaction between softening jobs data and a central bank with no clear direction to give.
Here is what the data actually tells you about where sterling goes from the BoE meeting this week, and why the institutional forecasters disagree so sharply on its next move. By the time you finish this, you will know the key levels, the key risks, and where the major banks have planted their flags.
Why the jobs data released this week is putting fresh pressure on the pound
The headline number is a decade low. UK job vacancies fell to 702,000 in the three months to August 2026, according to the Office for National Statistics (ONS), down 8,000 or 1.1% on the previous quarter.
Strip out the pandemic distortion, and you have to go back to September-November 2014 to find vacancies this low, when the count sat at 703,000. That is a hiring engine running noticeably cooler than it has for most of the past ten years.
But the vacancy count alone undersells the shift. The cleaner signal sits in the ratio of unemployed people to available jobs, and that has quietly deteriorated.
The clearest sign of rising slack There are now 2.5 unemployed people per vacancy, up from 2.3 a year earlier. That widening gap, more than the headline vacancy figure, is what tells you the labour market is loosening rather than just flattening out.
Here is the picture the ONS data paints:
- Vacancies: 702,000 (June-August 2026), down 8,000 on the quarter
- Unemployment rate: 4.9% in the three months to mid-2026
- Unemployed per vacancy: 2.5, up from 2.3 a year earlier
- Regular pay growth (excluding bonuses): 3.5% year-on-year to July 2026
- Total pay growth (including bonuses): approximately 3.9-4.1%
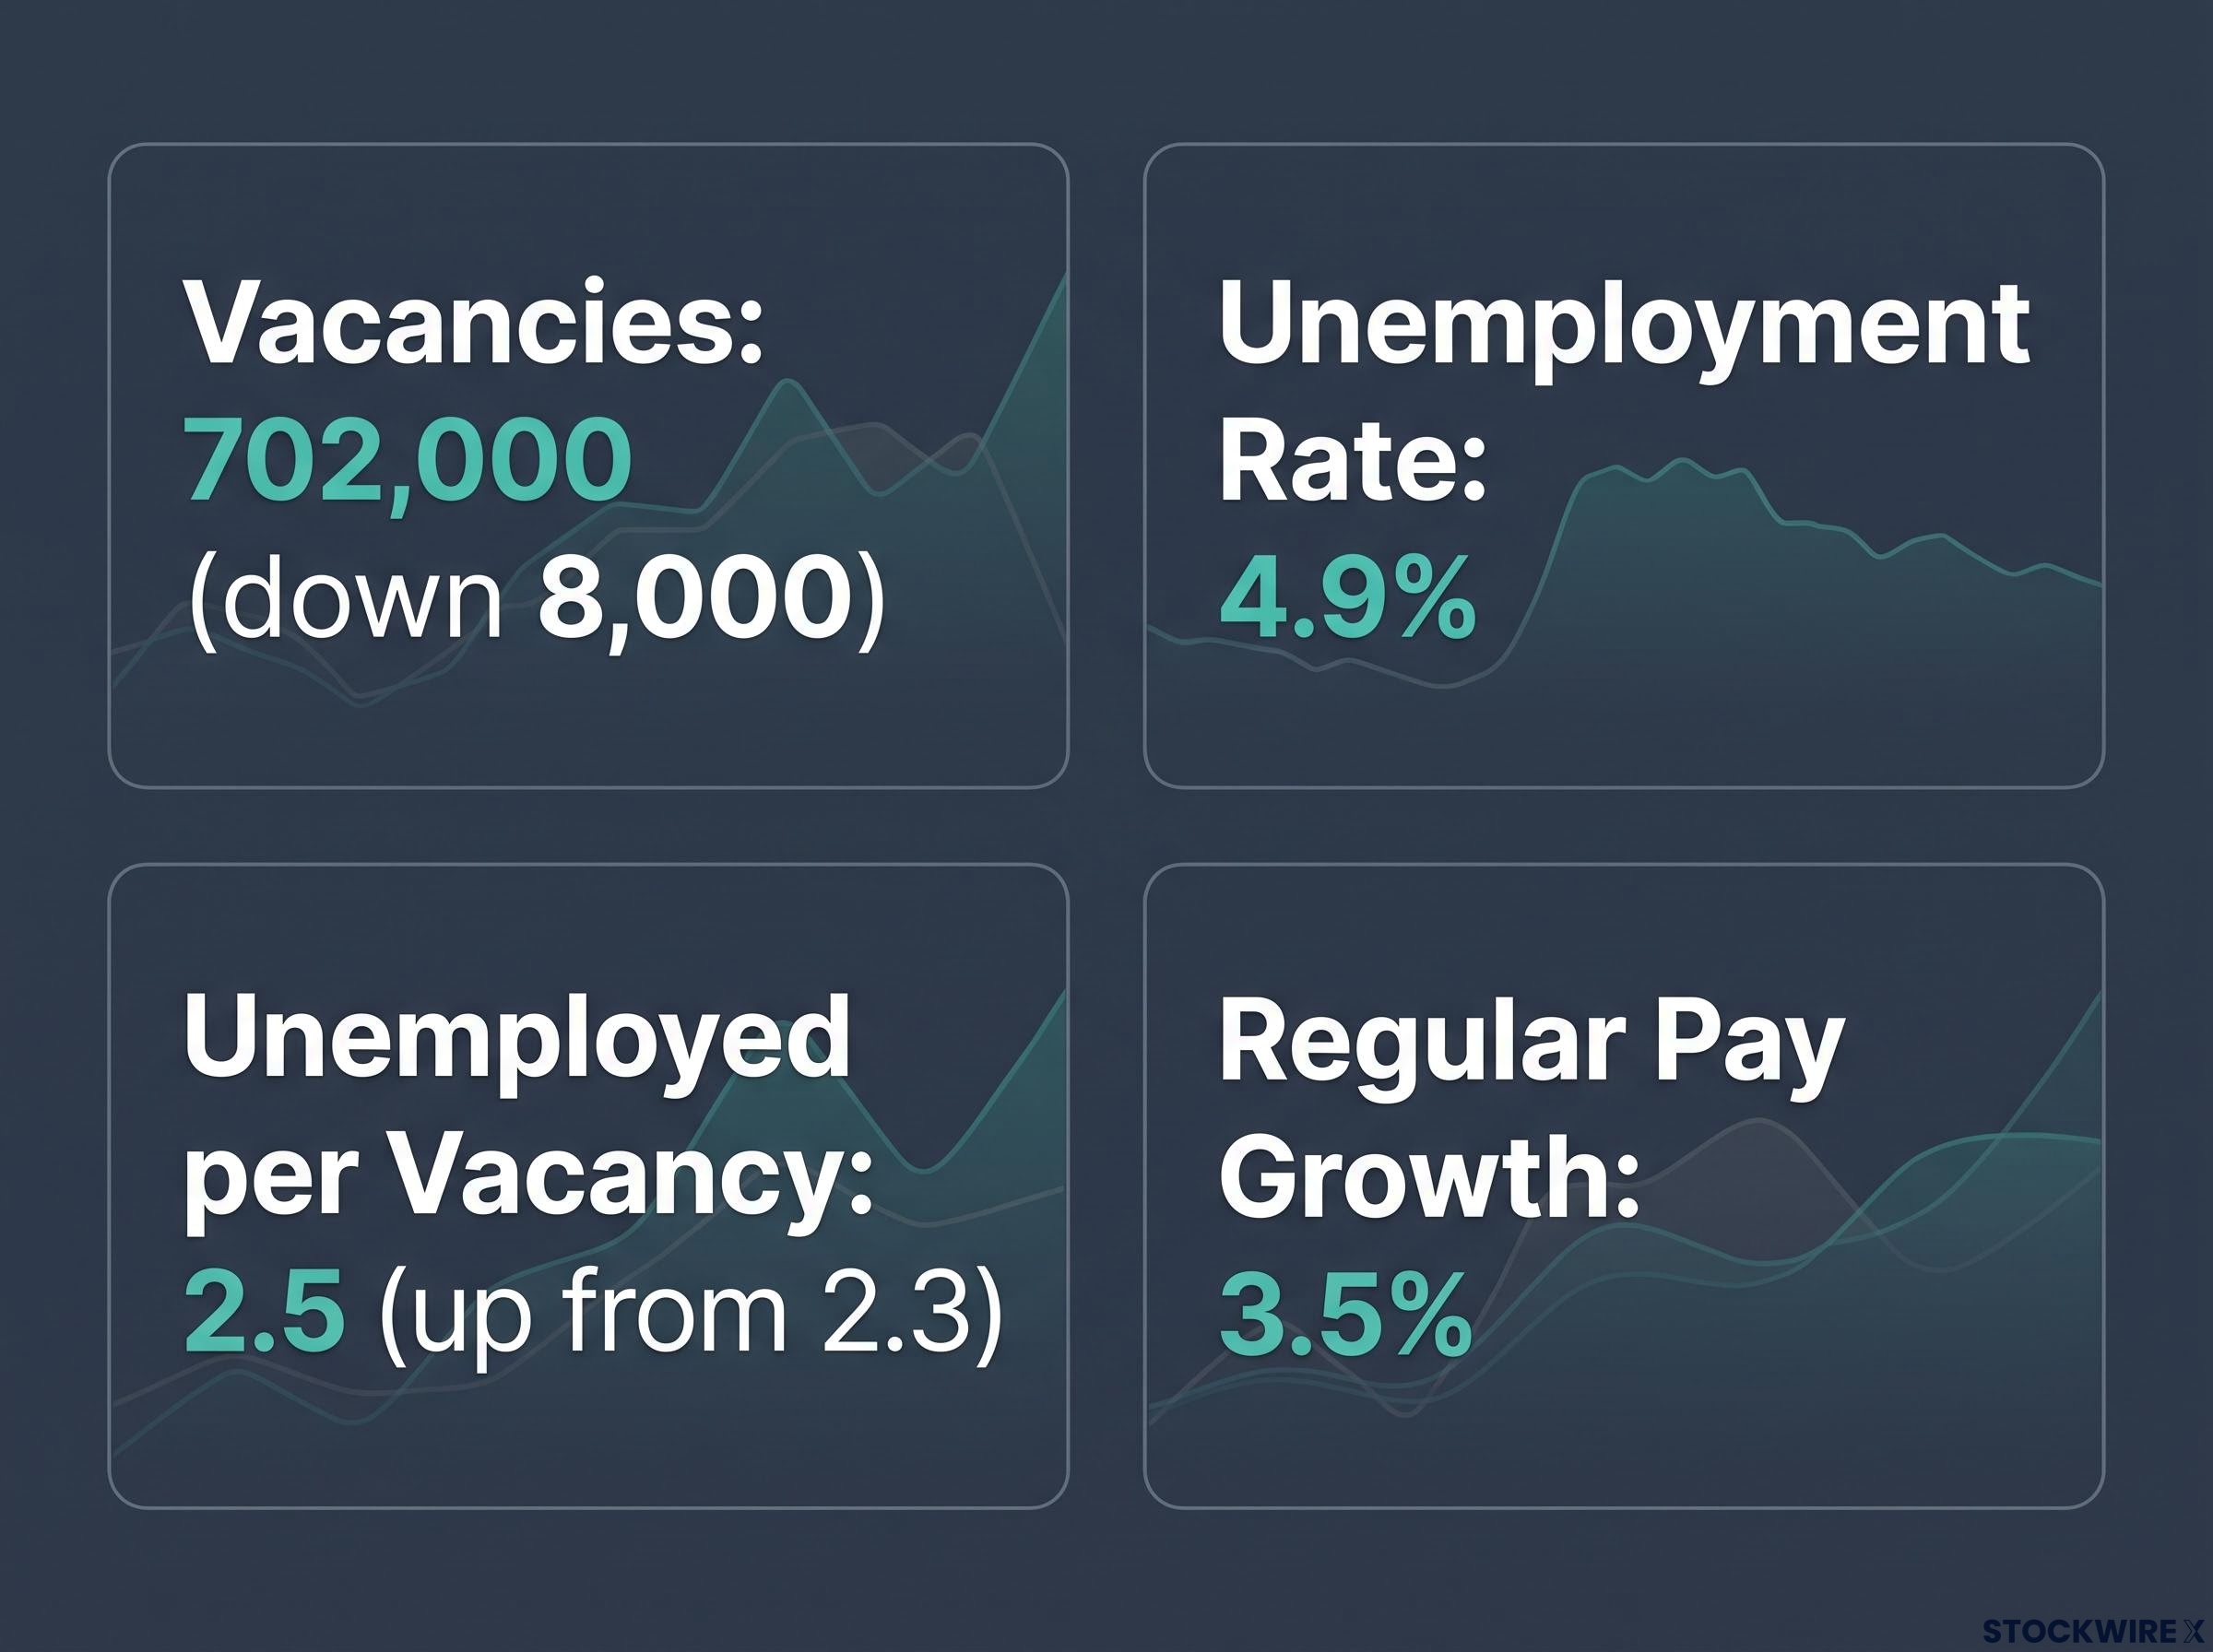
Taken together, the cooling in hiring is running ahead of the cooling in wages. That is precisely why the market reaction was not a clean sell-off: the data argues neither convincingly for the BoE to ease nor for it to tighten.
The bifurcated wage signals now running through the UK labour market, private-sector pay cooling to 2.9% while public-sector growth runs at 6.3%, complicate the MPC’s read of whether aggregate wage pressure is genuinely abating or simply shifting between sectors.
Wage growth: the complication that prevents a clean BoE pivot
Regular pay grew 3.5% in the year to July 2026. That sounds moderate until you set it against the Bank’s 2% inflation target, which over the medium term implies wage growth closer to that figure plus productivity gains, not comfortably above it.
The nuance is real pay. After adjusting for inflation, regular pay growth lands at roughly 0.5-0.8%, meaning workers are barely getting ahead in purchasing-power terms.
That softness in real terms takes some of the inflationary heat out of the nominal figure, but it does not eliminate it. For the MPC, 3.5% nominal wage growth is exactly the kind of number that keeps a central bank cautious rather than decisive.
When big ASX news breaks, our subscribers know first
What the Bank of England’s holding pattern actually means for sterling
The MPC last moved in July, and it was not a comfortable decision. The committee voted 6-3 to hold at 3.75%, with three members pushing for a hike to 4.0%.
The hawkish bloc inside the MPC has grown from a single dissenter in April 2026 to three members by July, with Pill, Greene, and Mann all voting for a rise to 4.0%, a trajectory that makes the September vote split a more consequential signal than the rate decision itself.
That split matters. A hold is not the same as a settled consensus, and a divided committee tells you the argument inside the Bank is live rather than resolved.
The majority’s case for holding rests on three pillars. Inflation is running at roughly 2.9%, above target but not spiralling; the 150 basis points of cuts delivered since August 2024 are still feeding through the economy; and the MPC judges its own policy stance to remain restrictive, meaning it is still actively bearing down on demand.
Against that, the hawkish minority, which included BoE chief economist Huw Pill, pointed to stronger-than-expected Q2 2026 GDP growth of 0.4% as evidence the economy is not sliding into a downturn that would justify keeping rates where they are. Pill argued the resilience supported a higher rate. He was outvoted.
The complication for the doves is that July CPI re-accelerated to 3.1% from 2.9% in June, which took the near-term case for further cuts off the table.
| Meeting | Decision | Vote split | CPI at the time | Rationale |
|---|---|---|---|---|
| July 2026 | Hold at 3.75% | 6-3 (three for 4.0%) | ~2.9% | Restrictive policy still passing through; hawks cited 0.4% Q2 GDP |
| 17 September 2026 (expected) | Hold at 3.75% | Not yet known | July re-acceleration to 3.1% | Monitoring mode; strong majority in Reuters poll expects no change |
A Reuters poll of economists shows a strong majority expecting no change for the rest of 2026, and Thursday’s hold would be the fifth in a row.
The Bank’s own framing The MPC has signalled that rates are “about the right level” to return inflation to the 2% target over the medium term.
For sterling, this is the crux. A central bank stuck in monitoring mode, with a committee that cannot agree and above-target inflation blocking the case for cuts, offers the pound no directional catalyst. What that tells you is that GBP is left exposed to whatever pressure arrives from outside, because the domestic policy engine is idling in neutral.
Reading the GBP/USD chart when fundamentals give no clear direction
The chart is telling the same story as the fundamentals, and it is a story of hesitation. As of 11-15 September 2026, GBP/USD has been trading around 1.3472-1.3478, drifting just below a cluster of short-term moving averages sitting at roughly 1.3479-1.3489.
Above that, the longer-term averages stack up as further resistance near 1.3500, 1.3516, and 1.3524. Price is pinned beneath a ceiling, without the momentum to break through it.
That momentum reading comes from the Relative Strength Index, or RSI, a 14-period gauge of whether buying or selling pressure is building. It has pulled back into the low-40s.
The low-40s reading signals fading bullish momentum rather than an outright collapse. What that tells you is that the market has not committed to a directional break in either direction. Treat the current zone as a decision point, not a confirmed trend.
A corrective pullback framework using moving average clusters, RSI context, and support zone confirmation helps separate the current hesitation from a structural trend break, particularly when price is trading in the kind of compressed decision band GBP/USD has occupied heading into the September BoE meeting.
The near-term posture Daily-chart analysis characterises the technical picture as neutral-to-mildly bearish, with price supported by a rising trend line but lacking upward conviction.
Support and resistance: the levels that matter most around this week’s BoE decision
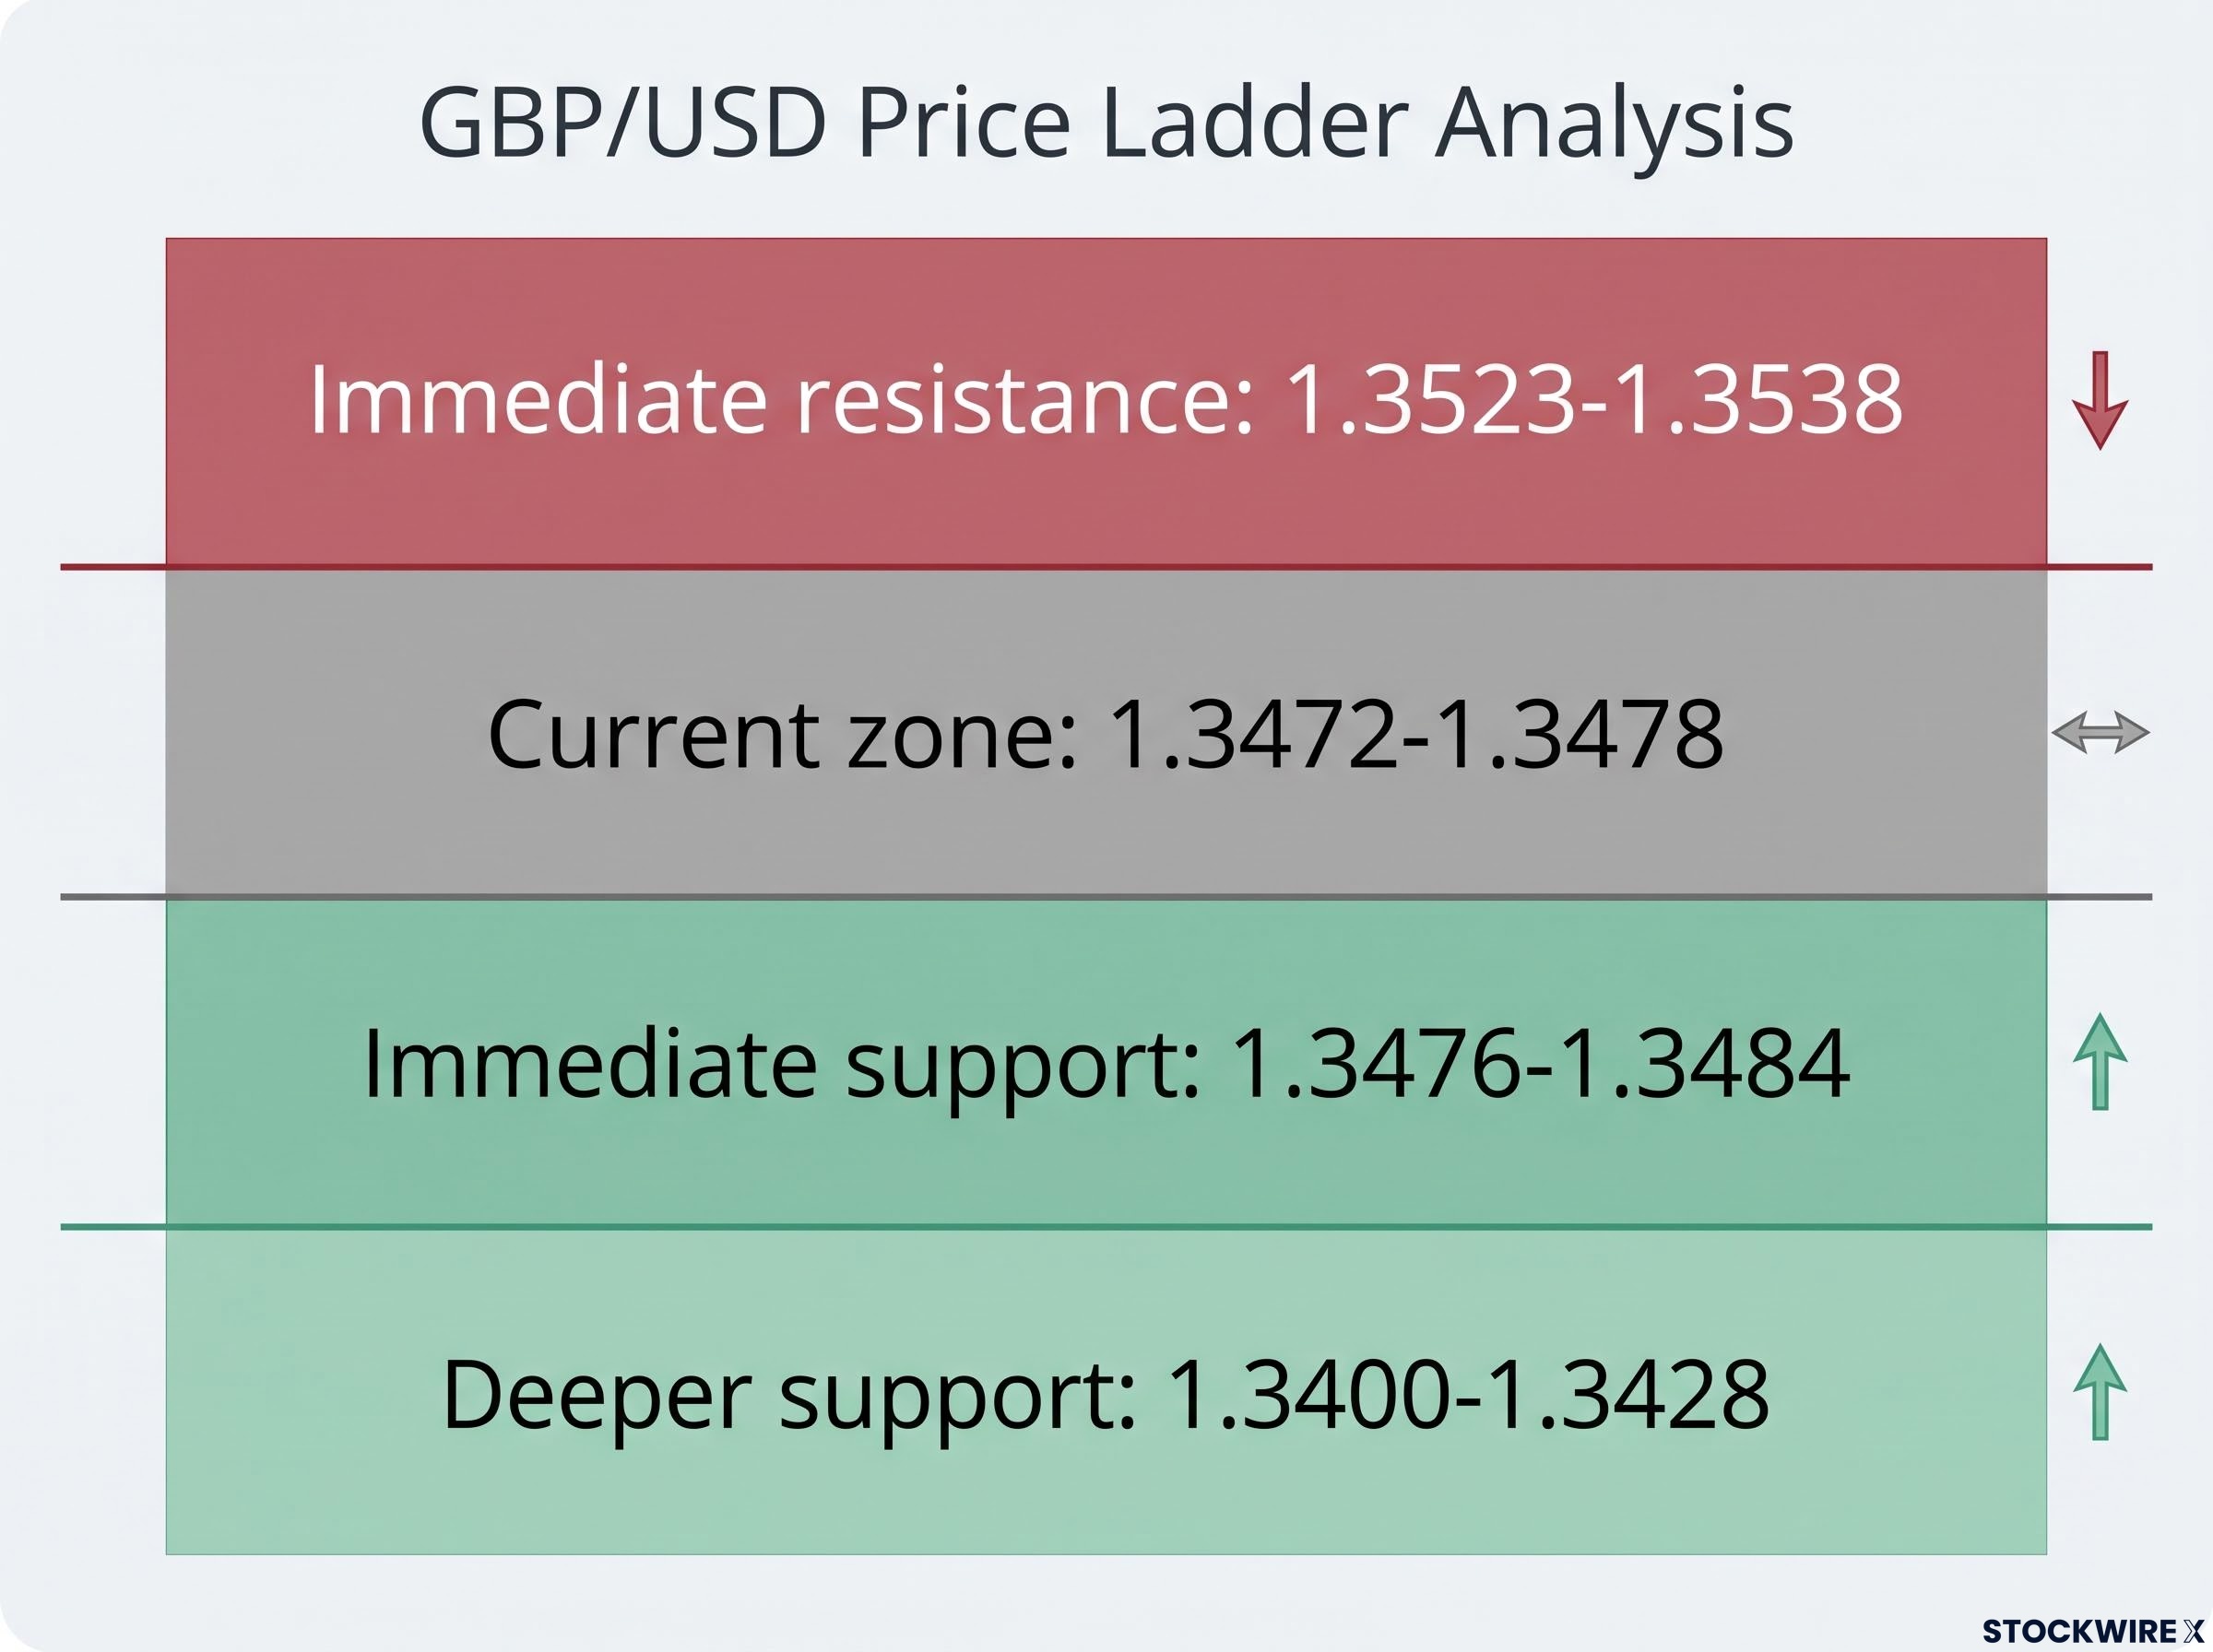
The levels below current price mark where a slide would gather pace:
- Immediate support (1.3476-1.3484): the rising trend line. A close beneath it removes the floor holding sterling steady.
- Deeper support (1.3400-1.3428): a break here opens the path toward the 1.34 handle and confirms a downside shift.
- Extended support (1.3280-1.3351): the level that would come into play if a data shock accelerates the move.
The levels above mark where a recovery would need to prove itself:
- Immediate resistance (1.3523-1.3538): clearing this would signal the market is willing to test higher.
- Secondary resistance (1.3550-1.3565): a break here would suggest the range is genuinely giving way to the upside.
- Extended resistance (1.3675-1.3730): the zone around the prior uptrend break near 1.3691, a level that would require a meaningful shift in sentiment to reach.
The chart, in short, is not contradicting the fundamentals. It is mirroring them, sitting in a range and waiting for a reason to pick a side.
Structural drag or cyclical dip? What the institutional forecasters are arguing
This is where the genuine disagreement lives, and it is worth taking seriously rather than resolving prematurely. The major banks are not split because one side has better data; they are split because they read the same data through different lenses.
The structural-weakness camp argues sterling has further to fall. Goldman Sachs expects GBP/USD to retreat toward at least 1.3250, on the view that the pound overshot its cyclical fundamentals and now faces long-lasting terms-of-trade shocks that will not reverse easily.
The clearest articulation of the bearish case Goldman Sachs argues sterling has “overshot cyclical fundamentals,” and that such premium phases typically unwind rather than persist.
ING, in its more cautious framing, projects a 1.33-1.34 range, while MUFG builds a bearish GBP/EUR view on the premise of BoE easing running against a steadier European Central Bank.
The cyclical-recovery camp sees the recent softness as a dip rather than a decline. Scotiabank projects gains toward roughly 1.37 by year-end, framing recent strength as the start of a recovery. ING’s own G10 FX Outlook 2026 assigns a mildly bullish bias with a 1.34-1.36 range, conditional on a softer dollar and improving global risk appetite.
| Institution | GBP/USD target or range | Thesis | Key assumption |
|---|---|---|---|
| Goldman Sachs | Toward 1.3250 | Structural | Terms-of-trade shock; sterling overshot fundamentals |
| MUFG | Bearish GBP/EUR | Structural | BoE easing versus a steadier ECB |
| ING | 1.33-1.34 (structural); 1.34-1.36 (cyclical) | Both framings | Mildly bullish if the dollar softens |
| Scotiabank | ~1.37 by year-end | Cyclical | Recent strength marks the start of a recovery |
The variable separating the two camps is a single question: is the BoE’s holding pattern a prelude to easing, which would drag GBP lower, or a credible inflation-fighting stance that eventually supports sterling’s real yield appeal?
Swaps curve mispricing is the mechanism through which the institutional forecaster disagreement translates into actual sterling exposure: if markets are pricing 50-75 basis points of additional tightening that the MPC’s own vote split implies it will not deliver, the repricing risk falls on GBP holders rather than rate-setters.
The disagreement is not noise. It tells you the key thing to watch is not the September decision itself, since a hold is fully priced, but the language in the accompanying statement that reveals whether the majority is inching toward cuts or holding firm.
You do not need to pick a side in this debate. You do need a framework for judging which side the incoming data supports, and that framework points squarely at the Bank’s own words this week.
What to watch after the September meeting to judge whether the pressure on GBP eases
The hold on 17 September 2026 is not the event. The statement is.
With July CPI re-accelerating to 3.1% and wage growth at 3.5%, the question is whether the MPC acknowledges any shift in the balance of risks, or holds its line unchanged. Readers who track that specific language will be better oriented than those who simply note that rates stayed put.
Here is the monitoring framework for the weeks ahead:
- The BoE statement language on inflation and wage risk. Whether the committee flags the July CPI re-acceleration and sticky pay growth as changing its calculus will reveal if the holding majority is starting to fracture.
- The next CPI release. A further move above target hardens the case against cuts; a cooling print revives the doves.
- The next labour market report. Continued loosening in vacancies and the unemployed-per-vacancy ratio would test whether the majority’s patience gives way toward easing.
The technical watchlist is just as specific.
The decision zone The band between 1.3460 and 1.3524 is where the market is still making up its mind. A sustained break above 1.3524 would shift the near-term bias higher; a close below 1.3460 would open the path toward the 1.34 handle.
The 6-3 July split is the reason dissent, not the hold itself, is the story to watch. What that tells you is that sterling’s next real move waits on the Bank’s tone, not its decision.
This article is for informational purposes only and should not be considered financial advice. Investors should conduct their own research and consult with financial professionals before making investment decisions. Past performance does not guarantee future results, and financial projections are subject to market conditions and various risk factors. Forward-looking forecasts cited here are speculative and subject to change based on market developments.