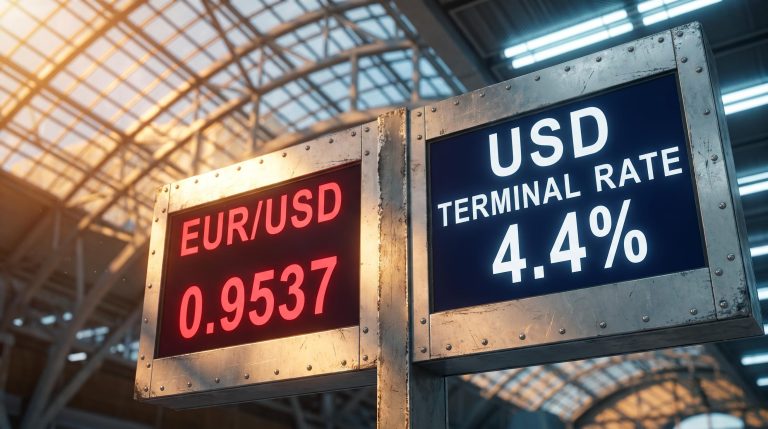
Most people assume the Federal Reserve holds all the cards, that its rate decisions land as surprises the market simply reacts to. The reality runs the other way. By the time the Fed announces a move, the bond market has usually already made the call, often months in advance.
Right now, that gap is on full display. The Fed has held its target rate at 3.50-3.75% since the start of 2026, yet the two-year Treasury yield is trading at roughly 4.65%, well above where official policy sits.
That discrepancy is not a mistake or a mispricing. It is a message about where interest rates are heading next, and it is one you can read yourself.
This explainer gives you a working framework for treating the two-year yield as a leading indicator of Fed policy. You will learn how the signal works, what today’s spread is telling you, how reliable the indicator has been across five decades, and how to position your fixed-income holdings before the Fed officially acts.
How the two-year Treasury yield forces the Federal Reserve’s hand
Pull up a chart and the signal is simple: the two-year yield sits nearly a full percentage point above the federal funds rate. To understand why that gap matters, you need to understand what the two-year yield actually contains.
Under the expectations theory of the term structure, a medium-term bond yield embeds the market’s forecast of where short-term rates are heading, plus a small premium investors demand for locking their money up longer. The New York Fed frames the yield curve as a leading indicator precisely because of this mechanism.
The bond market’s forecasting edge is partly a function of the Fed’s actual policy reach, which extends directly only to the overnight interbank rate and not to the mortgage, business loan, or consumer credit rates that drive real economic activity, meaning bond traders price what the Fed can credibly do rather than what it might wish to do.
In plain terms, the two-year yield is a forward-looking proxy for the average federal funds rate over the next 24 months. When traders expect the Fed to hike, they push the two-year higher before the Fed moves a muscle.
Here is the structural edge the bond market holds. Traders update their expectations continuously, reacting to every consumer price index (CPI) print and every jobs report in real time. The Fed, by contrast, only adjusts policy at scheduled meetings. That mismatch means the two-year yield reprices constantly while policy shifts in discrete steps, and it is why the two-year typically leads Fed rate changes by three to six months.
The signal comes down to two scenarios:
- Two-year yield sits 50-100 basis points above the fed funds rate: Markets are pricing in near-term hikes, and the front end of the curve becomes vulnerable to further increases.
- Two-year yield drops below the fed funds rate: Markets are pricing in imminent cuts, and historically, easing has tended to follow after the two-year has been falling for several months.
The real value here is what this window gives you. The two-year yield reflects the collective forecast of institutional bond traders placing real money on Fed policy, and that consensus has historically been more accurate than the Fed’s own forward guidance. Instead of waiting for a post-meeting press conference, you can watch the signal that actually dictates future borrowing costs.
When big ASX news breaks, our subscribers know first
Decoding the current spread between the two-year yield and the Fed funds rate
The theory only matters if it holds up against today’s numbers, so put it to work. As of mid-September 2026, the two-year Treasury yield sits between 4.65% (H.15 data, 14 September) and 4.67% (FRED series DGS2, 15 September).
FRED two-year Treasury yield data is updated each business day and provides the DGS2 series that underpins the current 4.65-4.67% reading, letting you track the spread against the fed funds target range in real time as conditions evolve.
The federal funds target range, meanwhile, has held steady at 3.50-3.75% since the FOMC’s December 2025 meeting. The Committee voted 9-3 to hold at its most recent decision on 29 July 2026, with some members actually favouring a hike.
Do the maths against the upper bound of the target range, and you get a spread of roughly 90-92 basis points. That figure lands squarely inside the historical 50-100 basis point band that has preceded Fed rate increases.
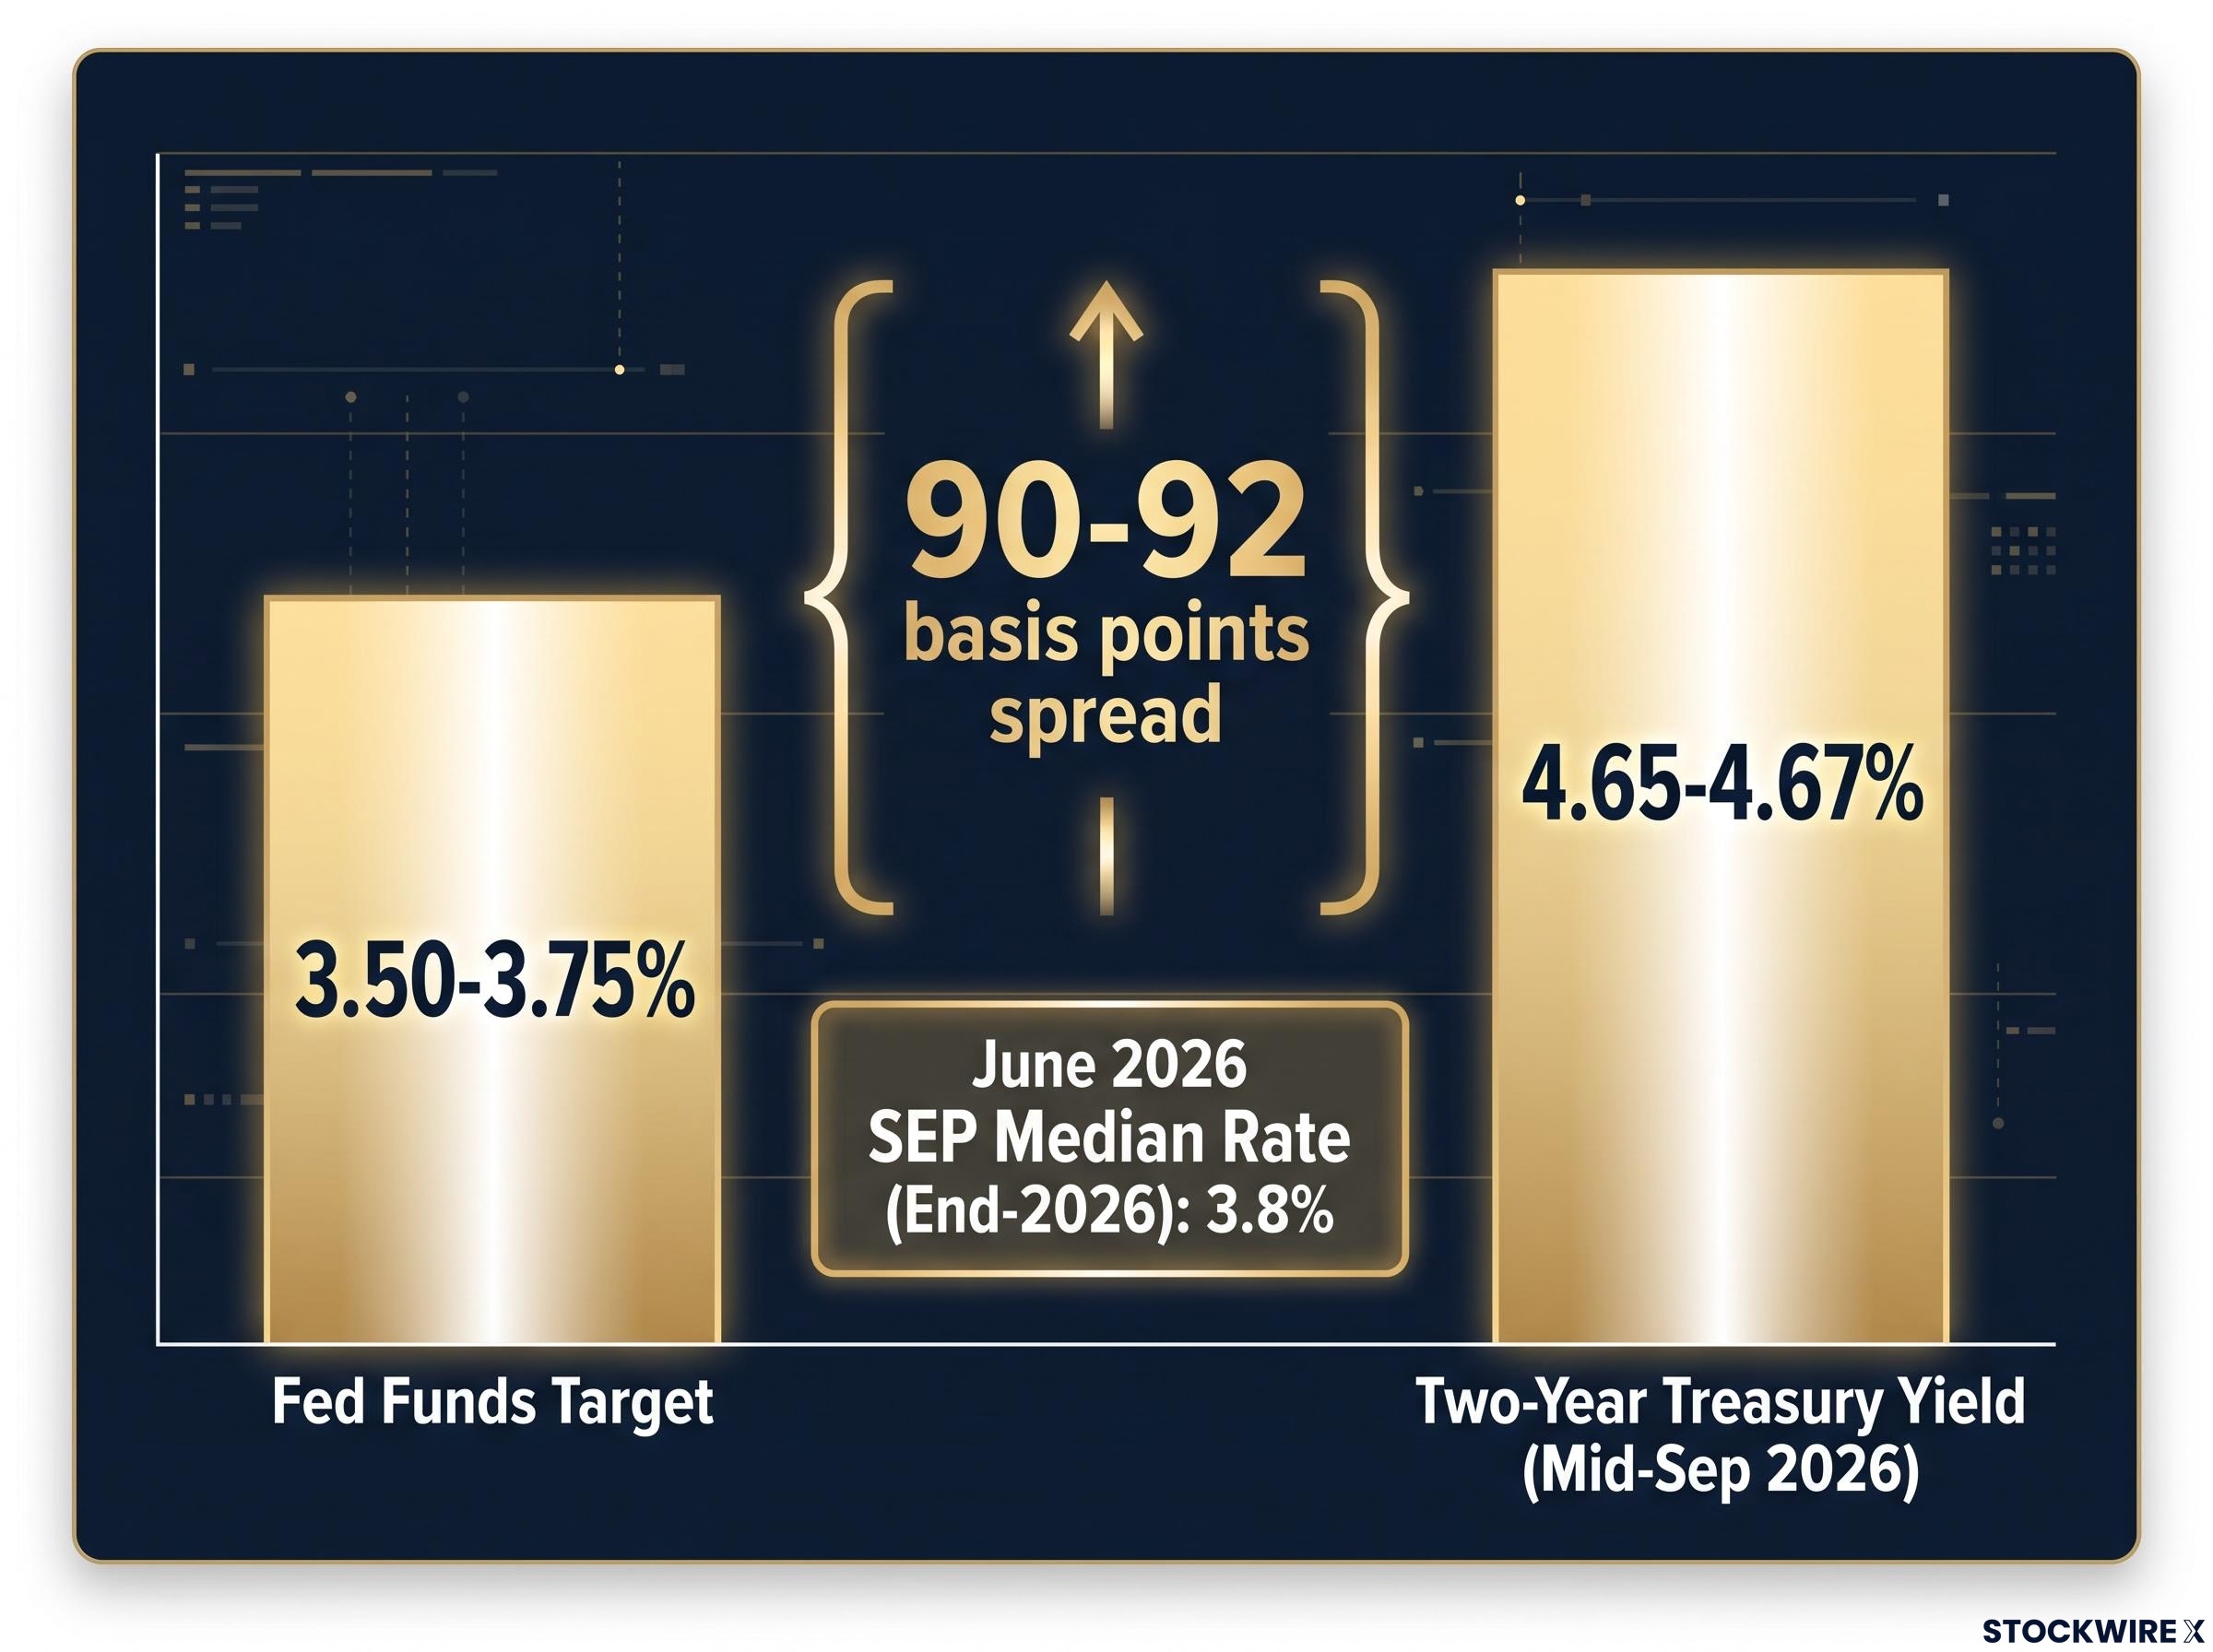
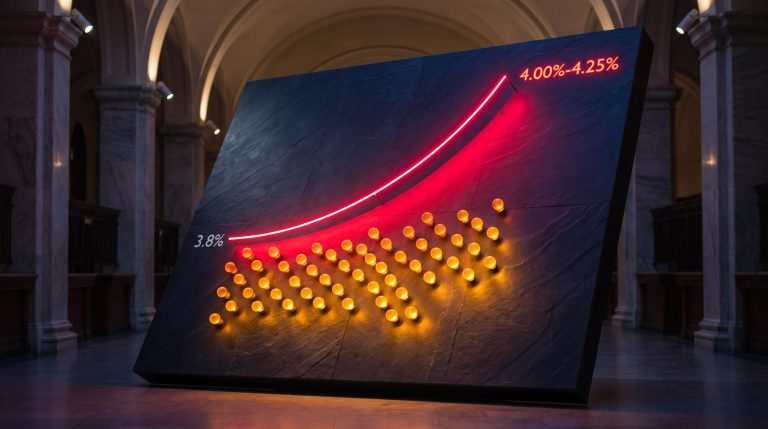
This is not just theory catching up to reality. The Fed’s own June 2026 Summary of Economic Projections (SEP) shows a median federal funds rate of 3.8% by the end of 2026, which implies one more 25 basis point hike from current levels.
| Metric | Current Reading (Sep 2026) | Historical Benchmark |
|---|---|---|
| Two-year Treasury yield | 4.65-4.67% | Above fed funds signals hikes |
| Fed funds target (upper bound) | 3.75% | 3.50-3.75% held since Dec 2025 |
| Implied spread | ~90-92 bp | 50-100 bp precedes hikes |
| SEP median rate, end-2026 | 3.8% | Implies one 25 bp hike |
What this 90-plus basis point gap tells you is direct: bond markets are actively pricing in further restrictive policy. You should not expect immediate relief in borrowing costs, and any fixed-income holdings you own are being valued against that expectation, not against today’s official rate.
The two-year Treasury is not the only bond market signal worth tracking alongside the fed funds rate: the 2s10s spread and rate futures probability curves each carry distinct information about the depth and duration of any tightening cycle, and reading them together reduces the risk of anchoring entirely on a single metric.
The track record of bond markets predicting central bank pivots
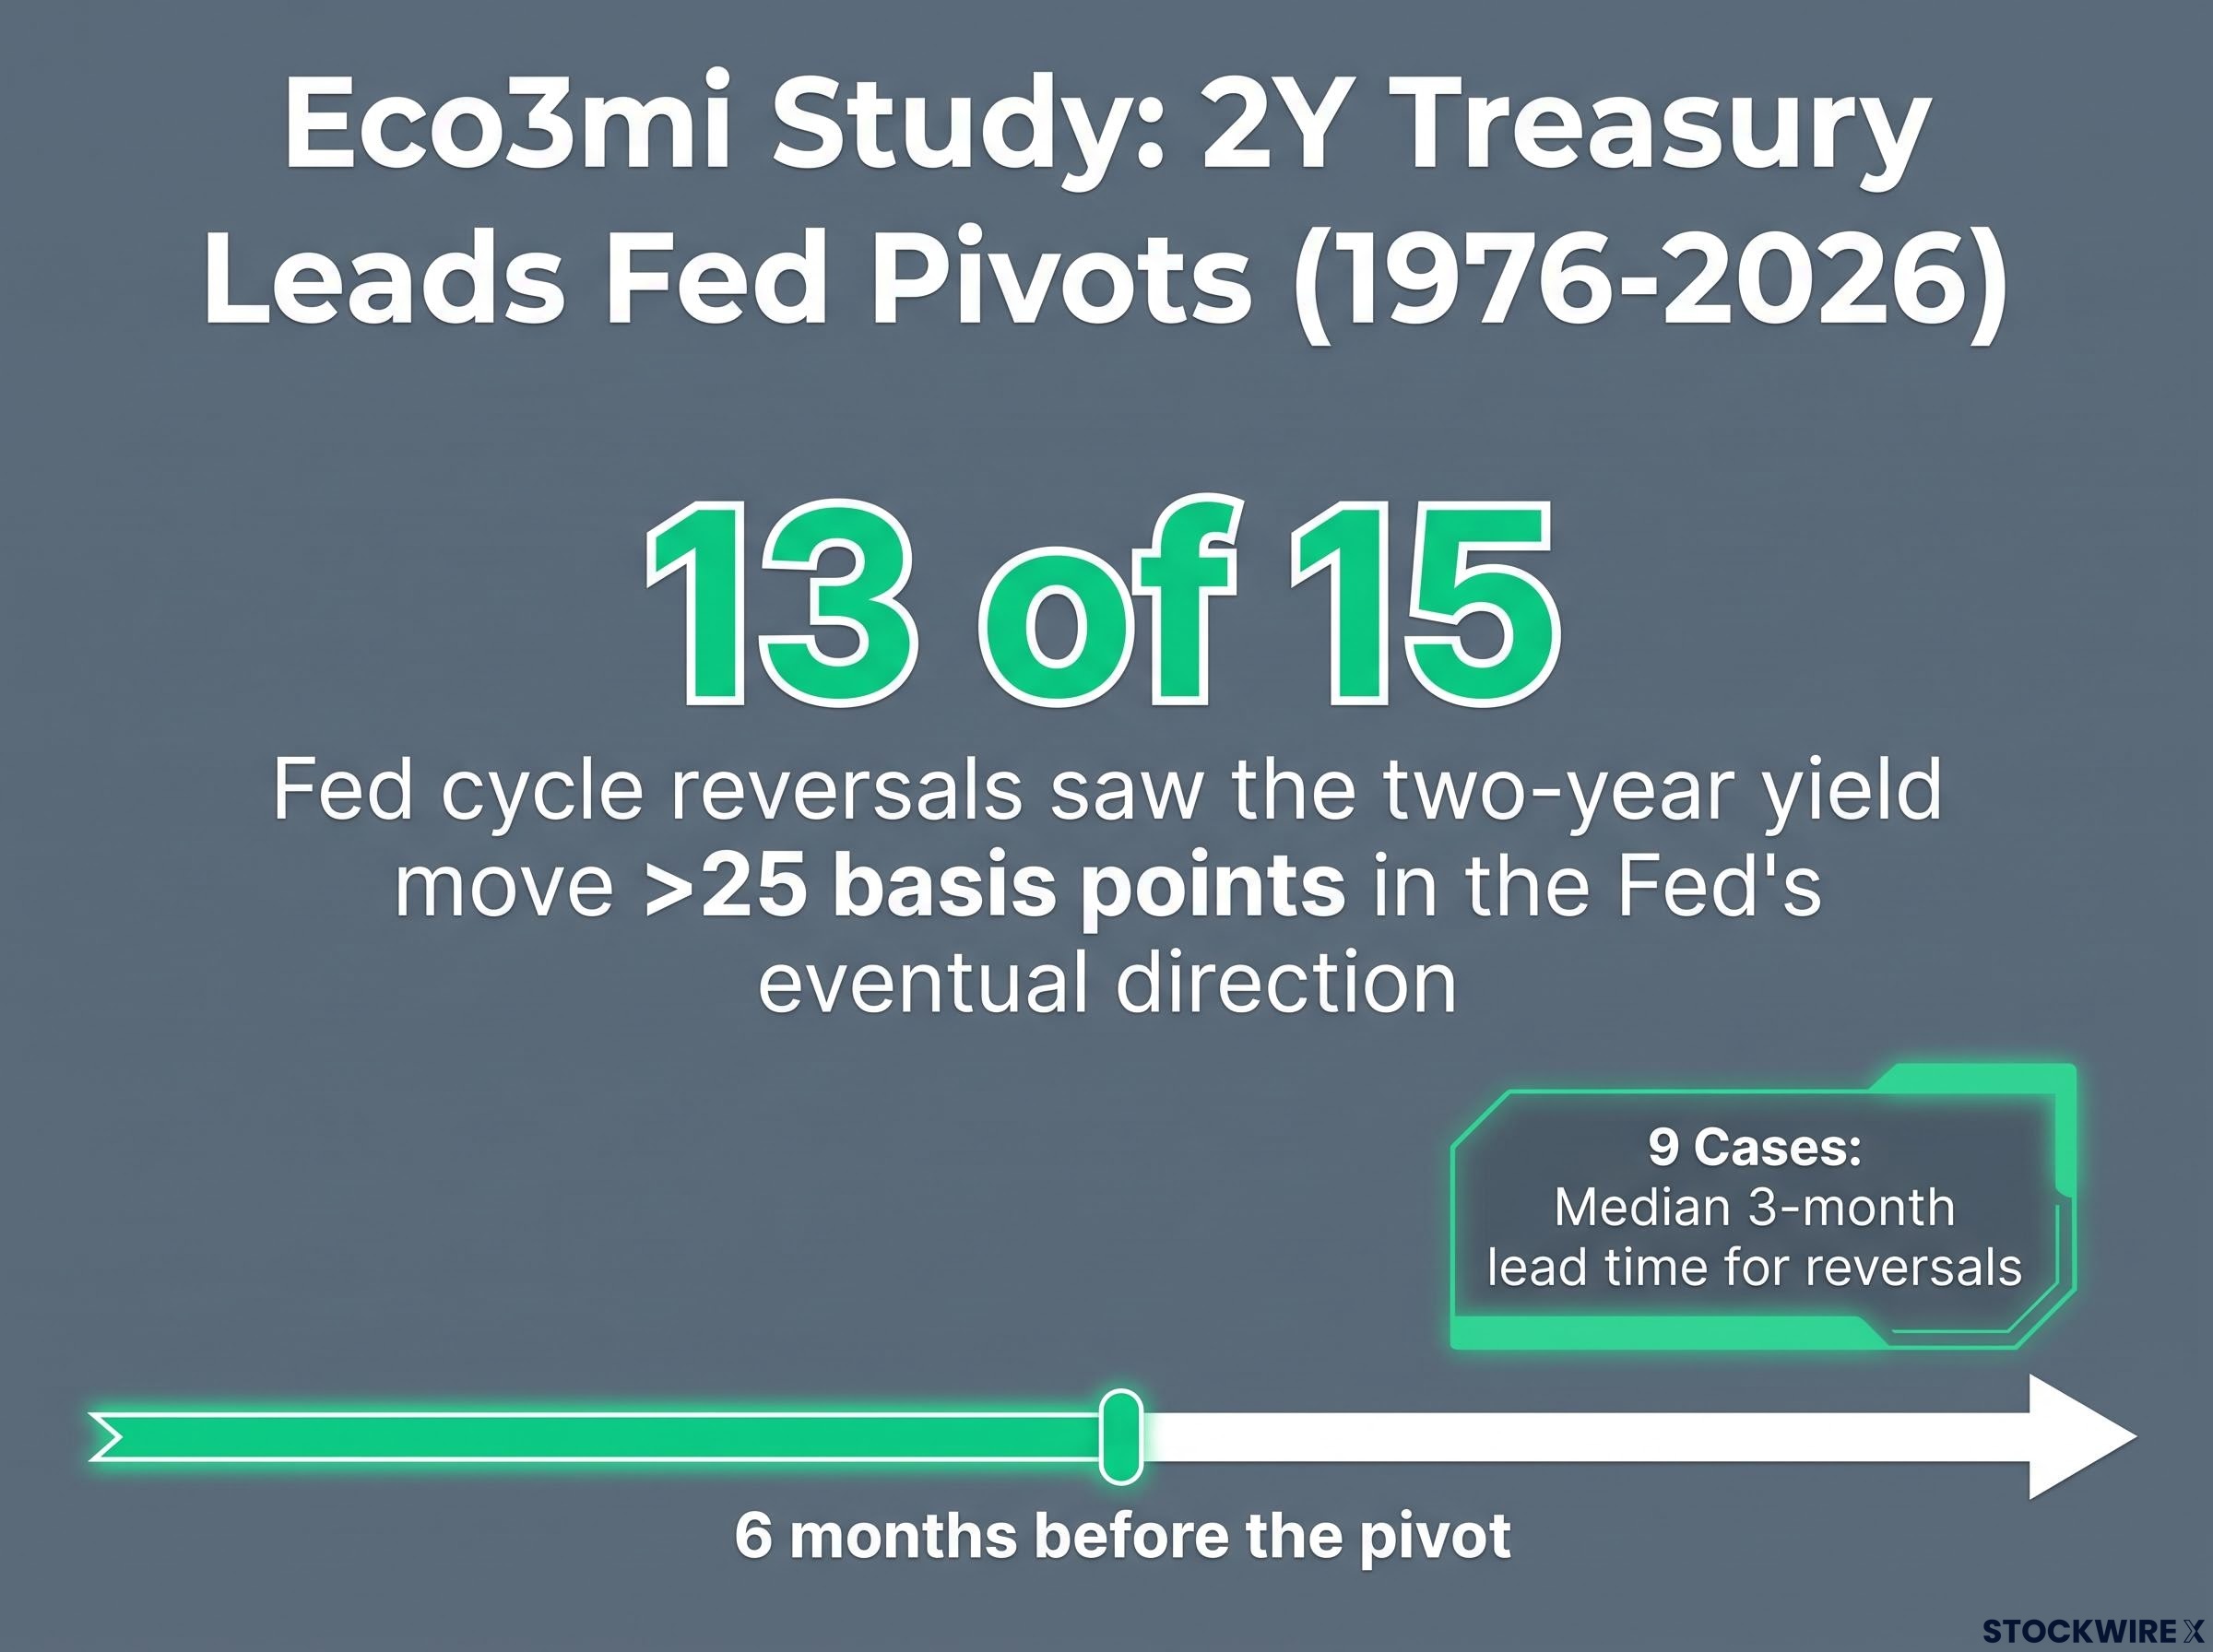
A signal is only as good as its history, and this one has a strong record. According to Eco3mi’s study “2Y Treasury Leads Fed Pivots, 1976-2026,” in 13 of 15 Fed cycle reversals since 1976, the two-year yield moved more than 25 basis points in the Fed’s eventual direction during the six months before the pivot.
The timing edge is real too. In nine of those cases, the two-year had its own major reversal a median of three months before the Fed changed course.
Look at specific cycles and the pattern holds. Ahead of the aggressive 1994 tightening, Diamond Hill’s analysis shows the two-year yield climbing from 4.08% to 4.27% across the 250 business days before the first hike, front-running policy well before it arrived.
The 2006-2007 cycle offers a subtler lesson. The Fed delivered its final hike to 5.25% in June 2006, yet the two-year yield did not peak until June 2007 at 5.15%, a full year later. Read in real time, that could easily be mistaken for an imminent cut, when it was really signalling that policy had reached its ceiling with easing still on a distant horizon.
Consumer stress signals, including rising personal bankruptcies, tightening credit standards, and buy now, pay later use for grocery purchases, sit on the opposite side of the ledger from the labour and inflation data currently keeping the two-year yield elevated, and the tension between those two pictures is the core question for the Fed’s next move.
When the signal breaks down
The two-year is usually early, but it is not an infallible clock. Two of those 15 pivots came with no meaningful warning from the two-year, and even the successful signals varied widely in their lead time.
Certain conditions can distort the reading entirely. The New York Fed’s yield-curve guidance warns that the signal weakens when term premia, the extra yield investors demand for holding longer maturities, sit unusually high or low. Watch for these distortions:
New York Fed yield curve research quantifies the slope of the yield curve as a forward-looking recession probability tool, reinforcing why institutional traders treat the two-year signal as a macro compass rather than a coincident indicator.
- Quantitative easing: Large-scale Fed asset purchases can compress the two-year yield, making it reflect central bank buying rather than pure rate expectations.
- Safe-haven flows: A rush into Treasuries during market stress can push yields down for reasons unrelated to Fed policy.
- High-inflation regimes: When inflation runs hot and volatile, the Fed may prioritise realised inflation and jobs data over what the two-year is signalling, creating a lag.
The distinction that matters for you is between a structural shift, such as term premium compression, and ordinary market noise. The former can genuinely mislead you about Fed direction; the latter is just day-to-day volatility. Treat this metric as a macro compass, not a precise entry timer for your trades.
Aligning your portfolio with the two-year yield signal
Reading the signal is only half the job. The other half is turning it into portfolio moves, and the current spread points clearly in one direction.
When the two-year trades 50 basis points or more above the fed funds rate, as it does now, the standard play is to shorten duration. That means favouring shorter-maturity Treasuries, floating-rate instruments, and cash-like holdings, cutting your interest-rate risk while still capturing elevated short-term yields.
The inverse applies when the two-year drops below the fed funds rate. That is the moment to extend duration into intermediate Treasuries and high-quality fixed income, locking in yields before the Fed cuts and positioning for price gains as yields fall.
To appreciate how much these swings demand, consider a spread moving from negative 1.9 to positive 0.9, a shift Inside Edge Capital’s Todd Gordon has highlighted. That is a wholesale change in required positioning, not a minor tweak.
| Yield Signal | Market Meaning | Duration Strategy | Key Risk |
|---|---|---|---|
| Two-year 50+ bp above fed funds | Hikes priced in | Shorten duration | Front-end yields keep rising |
| Two-year below fed funds | Cuts priced in | Extend duration | Fed delays easing |
One behavioural note worth watching. Equities often sell off on Fed meeting days themselves, then recover: during one recent calendar year, the S&P 500 posted negative returns on all six meeting days, yet four of five completed meeting weeks finished positive. The knee-jerk reaction rarely tells the full story.
Tracking this spread lets you adjust your bond duration before the Fed officially moves, locking in optimal yields while other investors sit on their hands waiting for the press conference.
For investors wanting to translate the two-year yield signal into specific portfolio construction decisions, our comprehensive walkthrough of bond portfolio duration management covers how BlackRock, PIMCO, Vanguard, and J.P. Morgan Asset Management are calibrating duration across the 1-5 year curve in today’s rate environment.
This article is for informational purposes only and should not be considered financial advice. Investors should conduct their own research and consult with financial professionals before making investment decisions. Past performance does not guarantee future results, and financial projections are subject to market conditions and various risk factors.
Navigating rate cycles with the bond market’s leading indicator
Strip everything back and the thesis is straightforward: the two-year Treasury yield is the most direct, market-priced read on where the Federal Reserve is heading next, and it usually gets there first.
Today’s 90-92 basis point spread between the two-year and the fed funds rate frames the setup for the rest of 2026. It tells you markets are still leaning toward restrictive policy, with the June SEP’s 3.8% median projection pointing to one more hike rather than relief.
The discipline that serves you best is balance. Watch the real-time bond market signal alongside the Fed’s official projections, treat the two-year as your macro compass rather than a stopwatch, and you position your portfolio proactively instead of reacting to whatever the next press conference brings.