How to Value ASX Bank Stocks Using PE and DDM
7 mins ago

Westpac’s group net interest margin of 1.95% in FY2025 sits above the Big Four average of 1.78%, yet its return on equity of 9.7% trails Commonwealth Bank by nearly five percentage points. That tension between margin strength and capital efficiency is precisely what makes WBC worth examining at the fundamental level before forming a view on the stock.
With the Big Four having reported their most recent results through to May 2026, investors now have a clean peer dataset to work with. This analysis uses those disclosed figures to benchmark Westpac across the three metrics analysts consistently rely on to assess bank quality: net interest margin (NIM), return on equity (ROE), and Common Equity Tier 1 (CET1) capital ratio. Readers will finish with a clear, data-grounded picture of where Westpac genuinely leads, where it lags, and what the gap implies for investors evaluating WBC as a long-term holding rather than a short-term trade.
Each of these three metrics answers a different question an investor is already asking. Before benchmarking Westpac against peers, it is worth connecting each metric to the specific judgement it informs.
All three must be read together. A high NIM can coexist with weak capital discipline. A high CET1 can reflect over-capitalisation rather than strength. The value is in the composite picture.
For investors who want to work through each metric from first principles before applying them to the Big Four comparison, our dedicated guide to reading ASX bank stock results covers how NIM, ROE, and CET1 interact within a bank’s income statement and balance sheet, with benchmarks drawn from the most recent sector reporting cycle.
Westpac’s FY2025 group NIM of 1.95% placed it above the Big Four average of 1.78% calculated from the same reporting cycle. Against each peer individually, the margin advantage is visible but uneven.
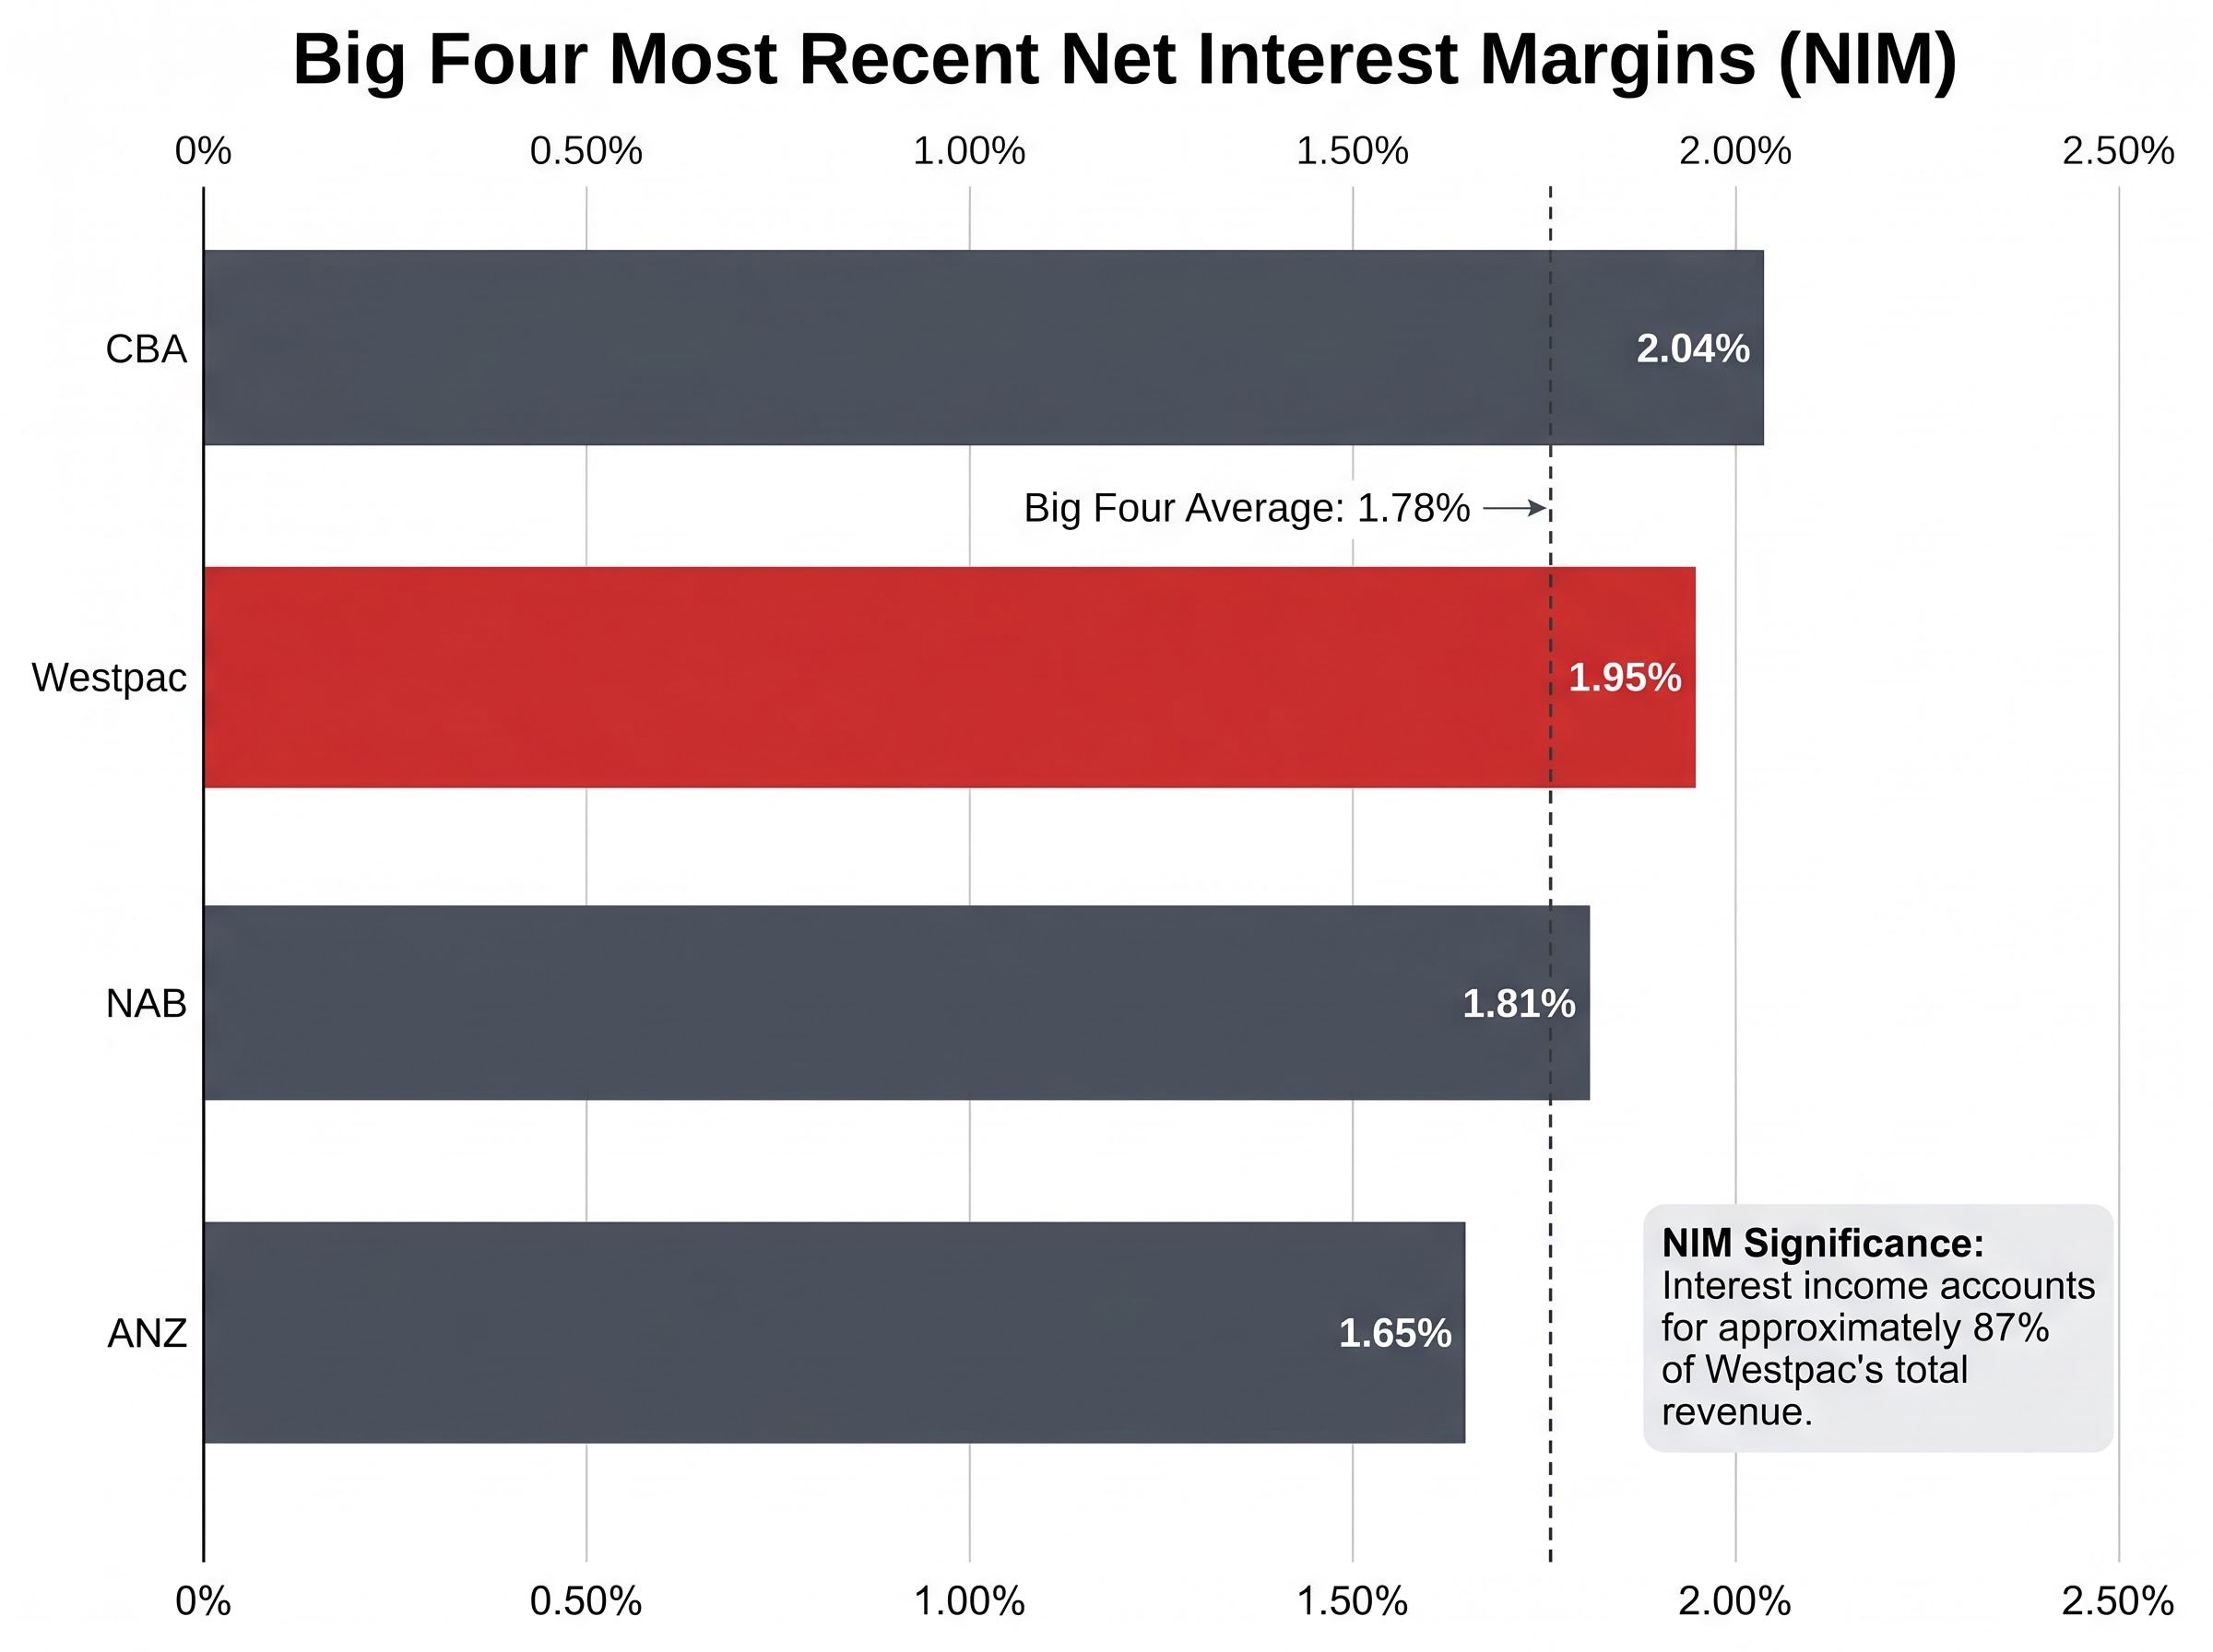
| Bank | 1H FY2025 NIM | Most Recent NIM | Period |
|---|---|---|---|
| CBA | 1.94% | 2.04% | 1H FY2026 |
| Westpac | 1.88% | 1.95% | FY2025 full year |
| NAB | 1.70% | 1.81% | 1H FY2026 |
| ANZ | 1.65% | 1.65% | 1H FY2025 |
The improvement in Westpac’s NIM reflects stronger deposit franchise management and repricing rather than aggressive loan growth, a more durable driver than volume-led margin expansion. That distinction matters: deposit-led NIM gains tend to persist longer than those built on writing more loans at thinner spreads.
The qualifier sits in the trajectory column. CBA’s 1H FY2026 NIM of 2.04% means it has since pulled ahead, while NAB’s improvement to 1.81% is closing the gap from below. Broker research from Morgan Stanley and UBS, cited in the Australian Financial Review, frames Westpac as “nearing peak NIM,” suggesting further upside is limited unless competitive pressure eases.
Broker research from Morgan Stanley and UBS describes Westpac as “nearing peak NIM,” with further margin expansion dependent on competitive dynamics easing across the mortgage and deposit markets.
The NIM advantage is real but may be narrowing. For a bank where 87% of revenue flows from interest income, the direction of that narrowing carries direct implications for forward earnings quality.
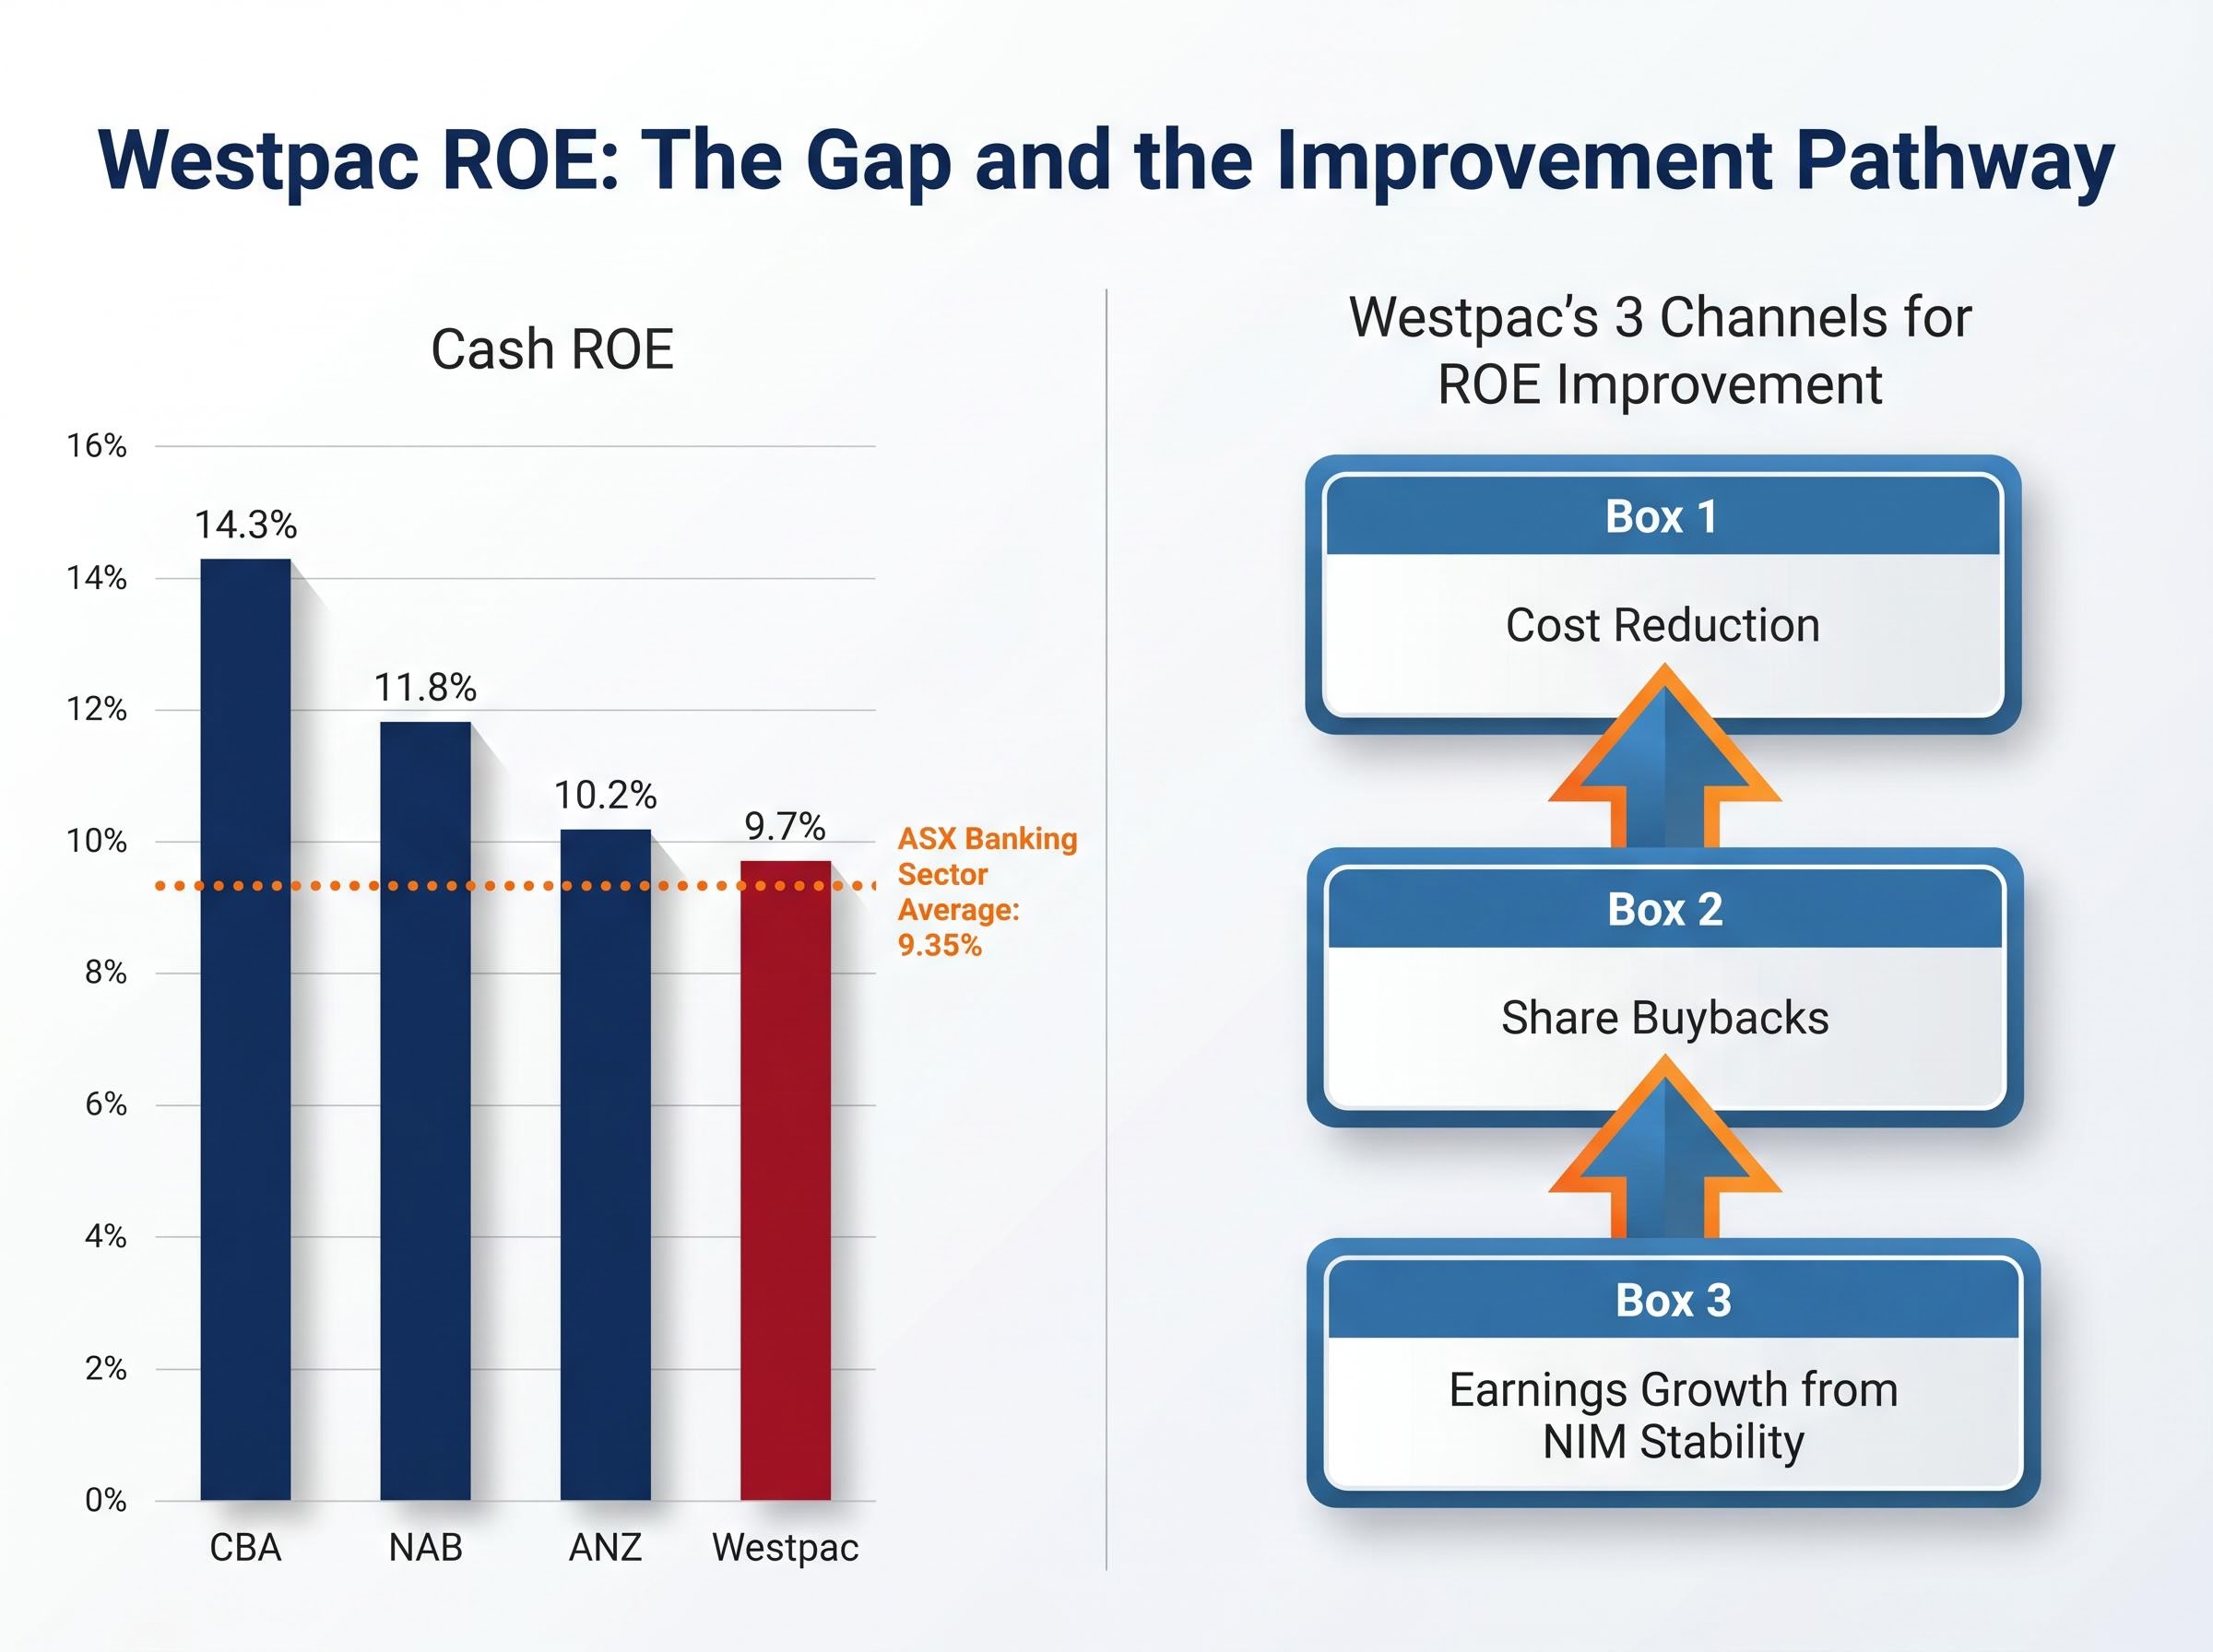
On a cash basis, Westpac’s ROE of 9.7% sits last among the Big Four.
| Bank | Cash ROE |
|---|---|
| CBA | 14.3% |
| NAB | 11.8% |
| ANZ | 10.2% |
| Westpac | 9.7% |
The table, read in isolation, looks like a verdict. It is not. CBA’s ROE premium reflects stronger franchise earnings, disciplined capital management including buybacks that reduce the equity denominator, and a mature technology platform that holds cost ratios lower. Several of those advantages are structural; others are the result of capital management choices Westpac has not yet fully replicated.
Context also matters in absolute terms. Westpac’s 9.7% sits above the broader ASX banking sector average of 9.35%, so the bank is not a laggard in absolute terms, only relative to the Big Four leaders.
The improvement pathway is concrete. Broker notes from Morgan Stanley, UBS, RBC, Macquarie, and Citi consistently identify Westpac as having the largest remaining self-help story among the majors. That story runs through three channels:
The ROE gap to CBA is real. Whether it is permanent depends on execution against these three levers.
Westpac’s CET1 ratio of 12.53% as at September 2025 positions the bank comfortably among its peers.
| Bank | CET1 Ratio | Reference Period |
|---|---|---|
| ANZ | 13.1% | March 2025 |
| CBA | 12.3% | 1H FY2026 |
| Westpac | 12.53% | September 2025 |
| NAB | 11.65% | 1H FY2026 |
APRA’s “unquestionably strong” framework sets the regulatory floor for all four majors. Each bank sits well above the minimum, so differences between 12.5% and 13.1% represent positioning above the floor rather than meaningful differences in safety.
APRA’s unquestionably strong capital framework sets the minimum CET1 benchmarks that all four major Australian banks must maintain, with each institution required to hold capital at a level that positions the domestic banking system among the strongest internationally.
What Westpac’s CET1 does create is optionality. A CET1 above the bank’s internal target range gives the board scope to pursue progressive dividend increases and potentially on-market buybacks, both of which would mechanically improve ROE over time. This is not a theoretical pathway; it is the same mechanism NAB has been executing. NAB’s CET1 declined from 12.4% in 1H FY2025 to 11.65% by 1H FY2026 (released May 2026), a clear illustration of what active capital management looks like in practice.
CBA’s capital management approach illustrates the same dynamic in practice: the bank’s CET1 ratio declined as risk-weighted assets grew 2.4% to $517.5 billion during Q3 FY2026, a pattern that shows how active loan book expansion and buyback activity work together to keep the capital ratio within a deliberate target band rather than drifting upward.
Broker commentary across multiple research notes describes Westpac’s CET1 as providing “optionality for future capital returns,” positioning surplus capital as a potential source of shareholder value rather than an idle buffer.
For income-focused investors, a CET1 above the internal target range is a forward-looking indicator that dividend growth and buybacks are supportable. That makes the capital ratio directly relevant to the total return outlook.
Three separate scorecards are less useful than one composite reading. Here is what the combined picture says.
Westpac’s interim dividend and payout ratio offer a near-term data point on how the capital optionality is already being deployed: the 77-cent fully franked interim payment was accompanied by a CET1 of 12.4% and approximately $2.7 billion in surplus capital above the bank’s 11.25% internal target, giving the board visible room to sustain or grow distributions without compromising the balance sheet.
The broker consensus framing is consistent across multiple firms. Westpac is described as a “fundamental improvement story” with the “largest self-help story” among the majors. The discount to CBA on price-to-book and ROE multiples is attributed by analysts to execution risk and recency of restructuring rather than deteriorating current fundamentals.
Qualitative data adds corroboration without being decisive. Westpac’s workplace culture score of 3.4 on Seek (versus a sector average of 3.1, as at May 2026) suggests the internal restructuring programme is translating into employee engagement, a leading indicator for sustained cost discipline.
This article answers one question: is Westpac a fundamentally strong bank relative to peers? On the evidence, the answer is that Westpac is operationally competitive on NIM and balance sheet strength, with a credible but unproven improvement story on ROE.
A bank can be fundamentally strong and still be expensive at a given share price, or fundamentally average and represent good value. Fundamental quality analysis and valuation analysis are complementary steps, not substitutes. Investors evaluating whether WBC is fairly priced at current levels would benefit from considering a dividend discount model and forward valuation analysis as a separate exercise.
Westpac’s NIM of 1.95% and CET1 of 12.53% demonstrate peer-competitive operational and balance sheet quality. The ROE of 9.7% trails CBA’s 14.3%, but the gap is narrowing, with cost reduction the primary engine and capital returns providing a secondary lever.
The fundamental picture suits long-term investors prioritising balance sheet resilience and a credible improvement trajectory over immediate capital efficiency. The data supports the thesis that Westpac is a sound bank with meaningful self-help potential, not a laggard with structural weaknesses.
The one unresolved question is whether management will execute the cost reduction programme with sufficient speed to close the ROE gap to CBA and NAB before the current NIM advantage narrows further. That is the question investors should carry forward into their own due diligence.
Westpac’s share price and analyst consensus form the next layer of due diligence: even with a neutral-to-bearish analyst profile and a maximum price target of $40.00 as of late April 2026, the core operational metrics of lending growth, deposit growth, and expense reduction that underpin the self-help thesis remained intact through the period of share price weakness.
This article is for informational purposes only and should not be considered financial advice. Past performance does not guarantee future results. Investors should conduct their own research and consult with financial professionals before making investment decisions.
Net interest margin (NIM) measures the spread between what a bank earns on loans and what it pays depositors and wholesale lenders. For Westpac, where approximately 87% of revenue comes from interest income, NIM is the dominant earnings lever and a key indicator of core lending profitability.
Westpac's cash ROE of 9.7% sits last among the Big Four, trailing CBA at 14.3%, NAB at 11.8%, and ANZ at 10.2%, though it remains above the broader ASX banking sector average of 9.35%.
A CET1 ratio of 12.53%, which sits above Westpac's internal target range of 11.25%, gives the board visible room to pursue progressive dividend increases and on-market buybacks without compromising balance sheet strength.
Broker research from firms including Morgan Stanley, UBS, RBC, Macquarie, and Citi consistently identifies Westpac as having the most remaining potential from cost reduction, share buybacks, and NIM stability, three levers that could mechanically close the ROE gap to CBA and NAB over time.
Westpac's FY2025 NIM of 1.95% led the Big Four average of 1.78%, but CBA has since moved ahead at 2.04% for 1H FY2026, and broker research from Morgan Stanley and UBS describes Westpac as nearing peak NIM, suggesting further expansion is limited unless competitive pressure eases.