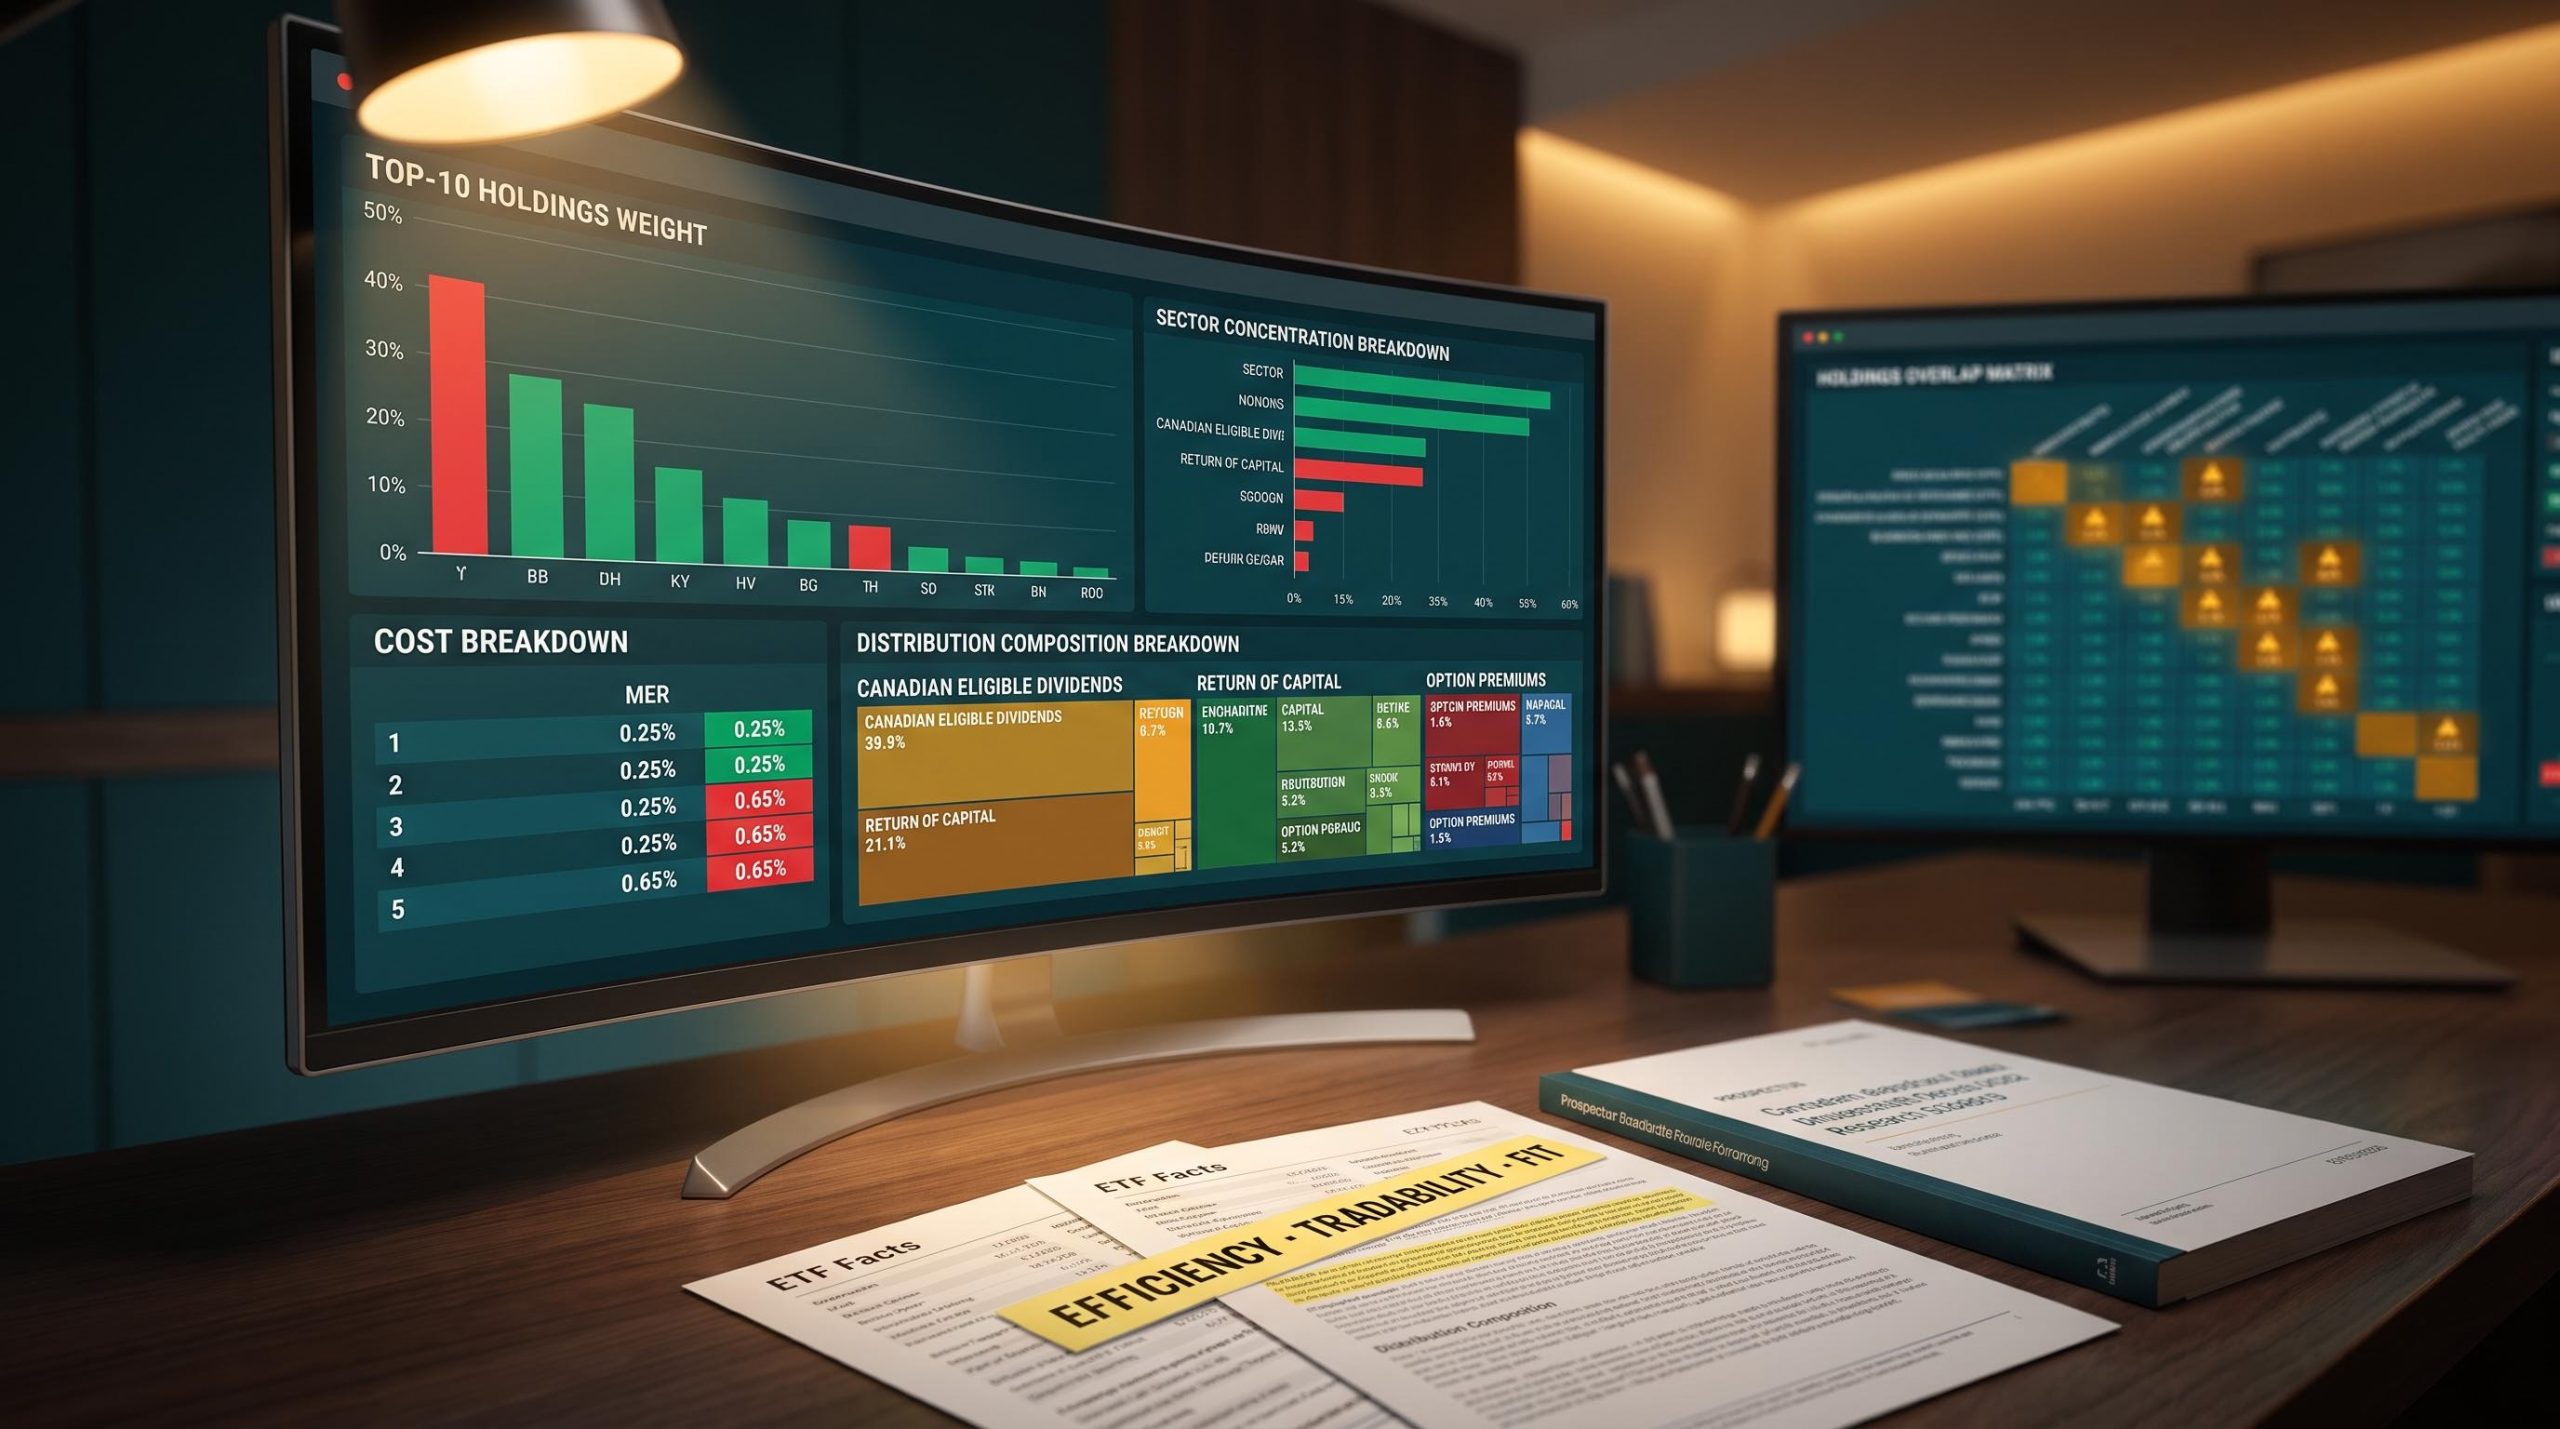
Most investors know what ETF they bought. Far fewer know what they actually own. Those two things are not always the same, and the gap between them is where underperformance, hidden costs, and mismatched risk tend to live.
ETFs are marketed under names and themes that can obscure their actual composition, cost structure, and income characteristics. A “global diversified” fund may be 60% concentrated in two sectors. A “high income” ETF may be returning your own capital to you. Without a structured review process, it is easy to buy something that does not fit what your portfolio actually needs.
This guide walks you through a seven-step due diligence framework covering mandate, holdings, costs, distributions, risk, liquidity, and provider quality. After working through it, you will have a clear, repeatable process for evaluating any ETF before committing capital, regardless of what the fund name or marketing language says.
Why your investment objective has to come first
You already have an investment objective, whether you have named it or not. Every dollar you allocate carries an implicit purpose: growth, income, or diversification. Naming that purpose clearly, in one sentence, changes every subsequent decision you make about which ETF belongs in your portfolio.
Three foundational objectives apply to almost every ETF purchase:
- Growth (capital appreciation): The primary aim is for the holding to appreciate in value over a longer time horizon, accepting higher equity or currency risk in pursuit of that gain.
- Income: The fund generates cash payments, whether dividends, interest, or option premiums, that flow to you during the holding period rather than only upon eventual sale.
- Diversification: The purchase fills a gap in your current portfolio by spreading exposure across companies, sectors, or geographies where you are presently under-represented.
An optimal portfolio often needs to balance all three. But each ETF purchase should have a primary purpose within that balance. Treating objective-setting as a filter, not a formality, eliminates the majority of ETFs from consideration before you open a single fund document.
The CFA Institute Research Foundation frames ETF evaluation around three dimensions: Efficiency, Tradability, and Fit. Fit is your starting point, because an efficient, liquid ETF that does not match your objective is still the wrong purchase.
If you cannot state your objective in one sentence before opening a fund page, you are evaluating the ETF on its own terms rather than yours. That is how mismatched purchases happen.
Grounding your ETF research in solid investing fundamentals, including how to match a vehicle to your risk profile and avoid structural mistakes that quietly erode long-term returns, makes every step of this framework easier to apply with confidence.
When big ASX news breaks, our subscribers know first
What an ETF actually is (and what the label does not tell you)
An ETF (exchange-traded fund) is a single tradable security that packages a collection of underlying assets, which can include equities, bonds, treasury bills, or even other ETFs, into one structure. Rather than selecting each position yourself, you gain exposure to all the underlying holdings at once, with the fund’s portfolio managers handling rebalancing and ongoing asset selection on your behalf. The resulting products range from broadly diversified market trackers to tightly focused thematic or sector-specific strategies.
Passive versus active: why the distinction changes your research
This distinction determines what you need to investigate. Passive ETFs track a stated index using a rules-based approach. The index methodology, whether market-cap weighted, equal-weighted, or fundamentally weighted, drives sector tilts, concentration, and risk characteristics. Understanding the weighting scheme tells you what the fund is actually concentrated in, which may differ substantially from the name.
Active ETFs introduce manager discretion. Common in covered-call, dividend, and alternative strategies, these funds allow the manager to deviate from a benchmark. Your research shifts from understanding the index to understanding how and why the manager makes decisions.
| Dimension | Passive ETFs | Active ETFs |
|---|---|---|
| Management approach | Rules-based index tracking | Manager discretion, benchmark-aware or unconstrained |
| What to investigate | Index methodology and weighting scheme | Manager’s process, track record, and deviation rationale |
| Common strategies | Market-cap weighted, equal-weighted, fundamentally weighted | Covered calls, active dividend selection, alternatives |
| Key documents to read | Index methodology guide, ETF Facts, prospectus | Prospectus, management commentary, SEDAR+ filings |
Beyond the passive-versus-active distinction, structural features change the risk profile. Physical holdings behave differently from synthetic exposures using total-return swaps, which introduce counterparty risk. Covered calls, leverage, and short selling amplify or constrain returns in ways the fund name will not tell you. Currency-hedged and unhedged series of the same fund can behave quite differently. Two ETFs with nearly identical names can carry meaningfully different risk profiles if one is market-cap weighted and passive while the other uses covered calls and active management. Reading the mandate document is not optional.
How to read the fund mandate: what to look for in the documents
Two primary documents anchor your mandate review. In Canada, ETF Facts is a mandatory plain-language summary required under Canadian securities law. It covers the fund’s objectives, fees, risks, and past performance in a standardised format. The full prospectus provides deeper detail, and SEDAR+ continuous disclosure filings (financial statements, management reports, holdings reports) form the authoritative trail for understanding what the fund actually does over time.
When you open these documents, you are confirming four or five specific things:
- Stated objective: Is the fund designed for growth, income, or both?
- Asset classes and geographies: What does the fund actually target, and does it match what you need?
- Passive versus active structure: Is it tracking an index or relying on manager discretion?
- Structural features: Does it use derivatives, leverage, or currency hedging?
- Risk rating and its limitations: Canadian ETF Facts shows a standardised risk scale (low to medium to high) based primarily on historical volatility. Use it as a starting point, then investigate what drives the rating.
ETF Facts is mandatory under Canadian securities law and must be provided to investors. It is the fastest way to confirm what a fund is actually designed to do.
A fund that carries a “medium” risk rating because its historical volatility falls in a certain range may still expose you to severe drawdowns in a stress event if it is concentrated in a single sector or uses leverage. The rating is a prompt to investigate further, not a final verdict.
Examining holdings: what you actually own underneath the label
The top-10 holdings list and sector breakdown are where marketing language meets reality. Providers typically publish full holdings and top-10 holdings on the fund page, updated at least monthly and often daily. This is your primary tool for confirming whether the ETF delivers the exposure it promises.
Start with concentration and overlap:
- Top-10 weight: Review the combined weight of the top 10 holdings. If a single position exceeds 10-15% of the ETF, you are effectively holding a concentrated bet, not a diversified fund.
- Sector concentration: Even “broad market” ETFs can be heavily tilted to technology or a single geography. Check whether the actual allocation matches the label.
- Portfolio overlap: If you hold two ETFs with significant common positions, you are reducing your diversification benefit and may be doubling exposure to the same risk factors without realising it.
If your “diversified global equity” ETF has 40% of its weight in five technology names, you are not buying broad diversification. You are buying a concentrated technology bet with extra steps, and your portfolio risk profile is different from what you planned.
Hidden sector concentration is a structural feature of many broad-market indexes: the top 10 constituents of the ASX 200 account for roughly half the index weight, meaning a fund marketed as a diversified market tracker functions in practice as a concentrated bet on a handful of sectors.
Sector, currency, and factor tilts
Sector and country breakdowns can diverge sharply from the fund name. Confirm that actual allocations across sectors and geographies match what you intended to buy.
Currency exposure is a specific and common source of unexpected volatility. If you hold U.S.-denominated equities through an unhedged ETF, your returns include the effect of currency movements between the Canadian and U.S. dollar. Hedged and unhedged series of the same fund can produce meaningfully different outcomes.
Factor or style tilts (value, growth, quality, low-volatility, small-cap) also shape risk and return. Knowing your factor exposure prevents you from attributing outperformance or underperformance to the wrong cause. And index rebalancing frequency affects turnover, which can increase trading costs and tax drag inside the fund.
Your holdings review checklist:
- Top-10 weight and concentration risk
- Sector and country breakdown versus the fund label
- Currency exposure (hedged versus unhedged)
- Overlap with your existing holdings
- Asset-class mix (equities, bonds, cash, alternatives)
- Factor and style tilts
Understanding costs: the one factor you can forecast with certainty
Costs are the single dimension of ETF performance you can evaluate with near-certainty before buying. The Management Expense Ratio (MER), the ongoing annual cost expressed as a percentage of assets, is the starting point, not the complete picture.
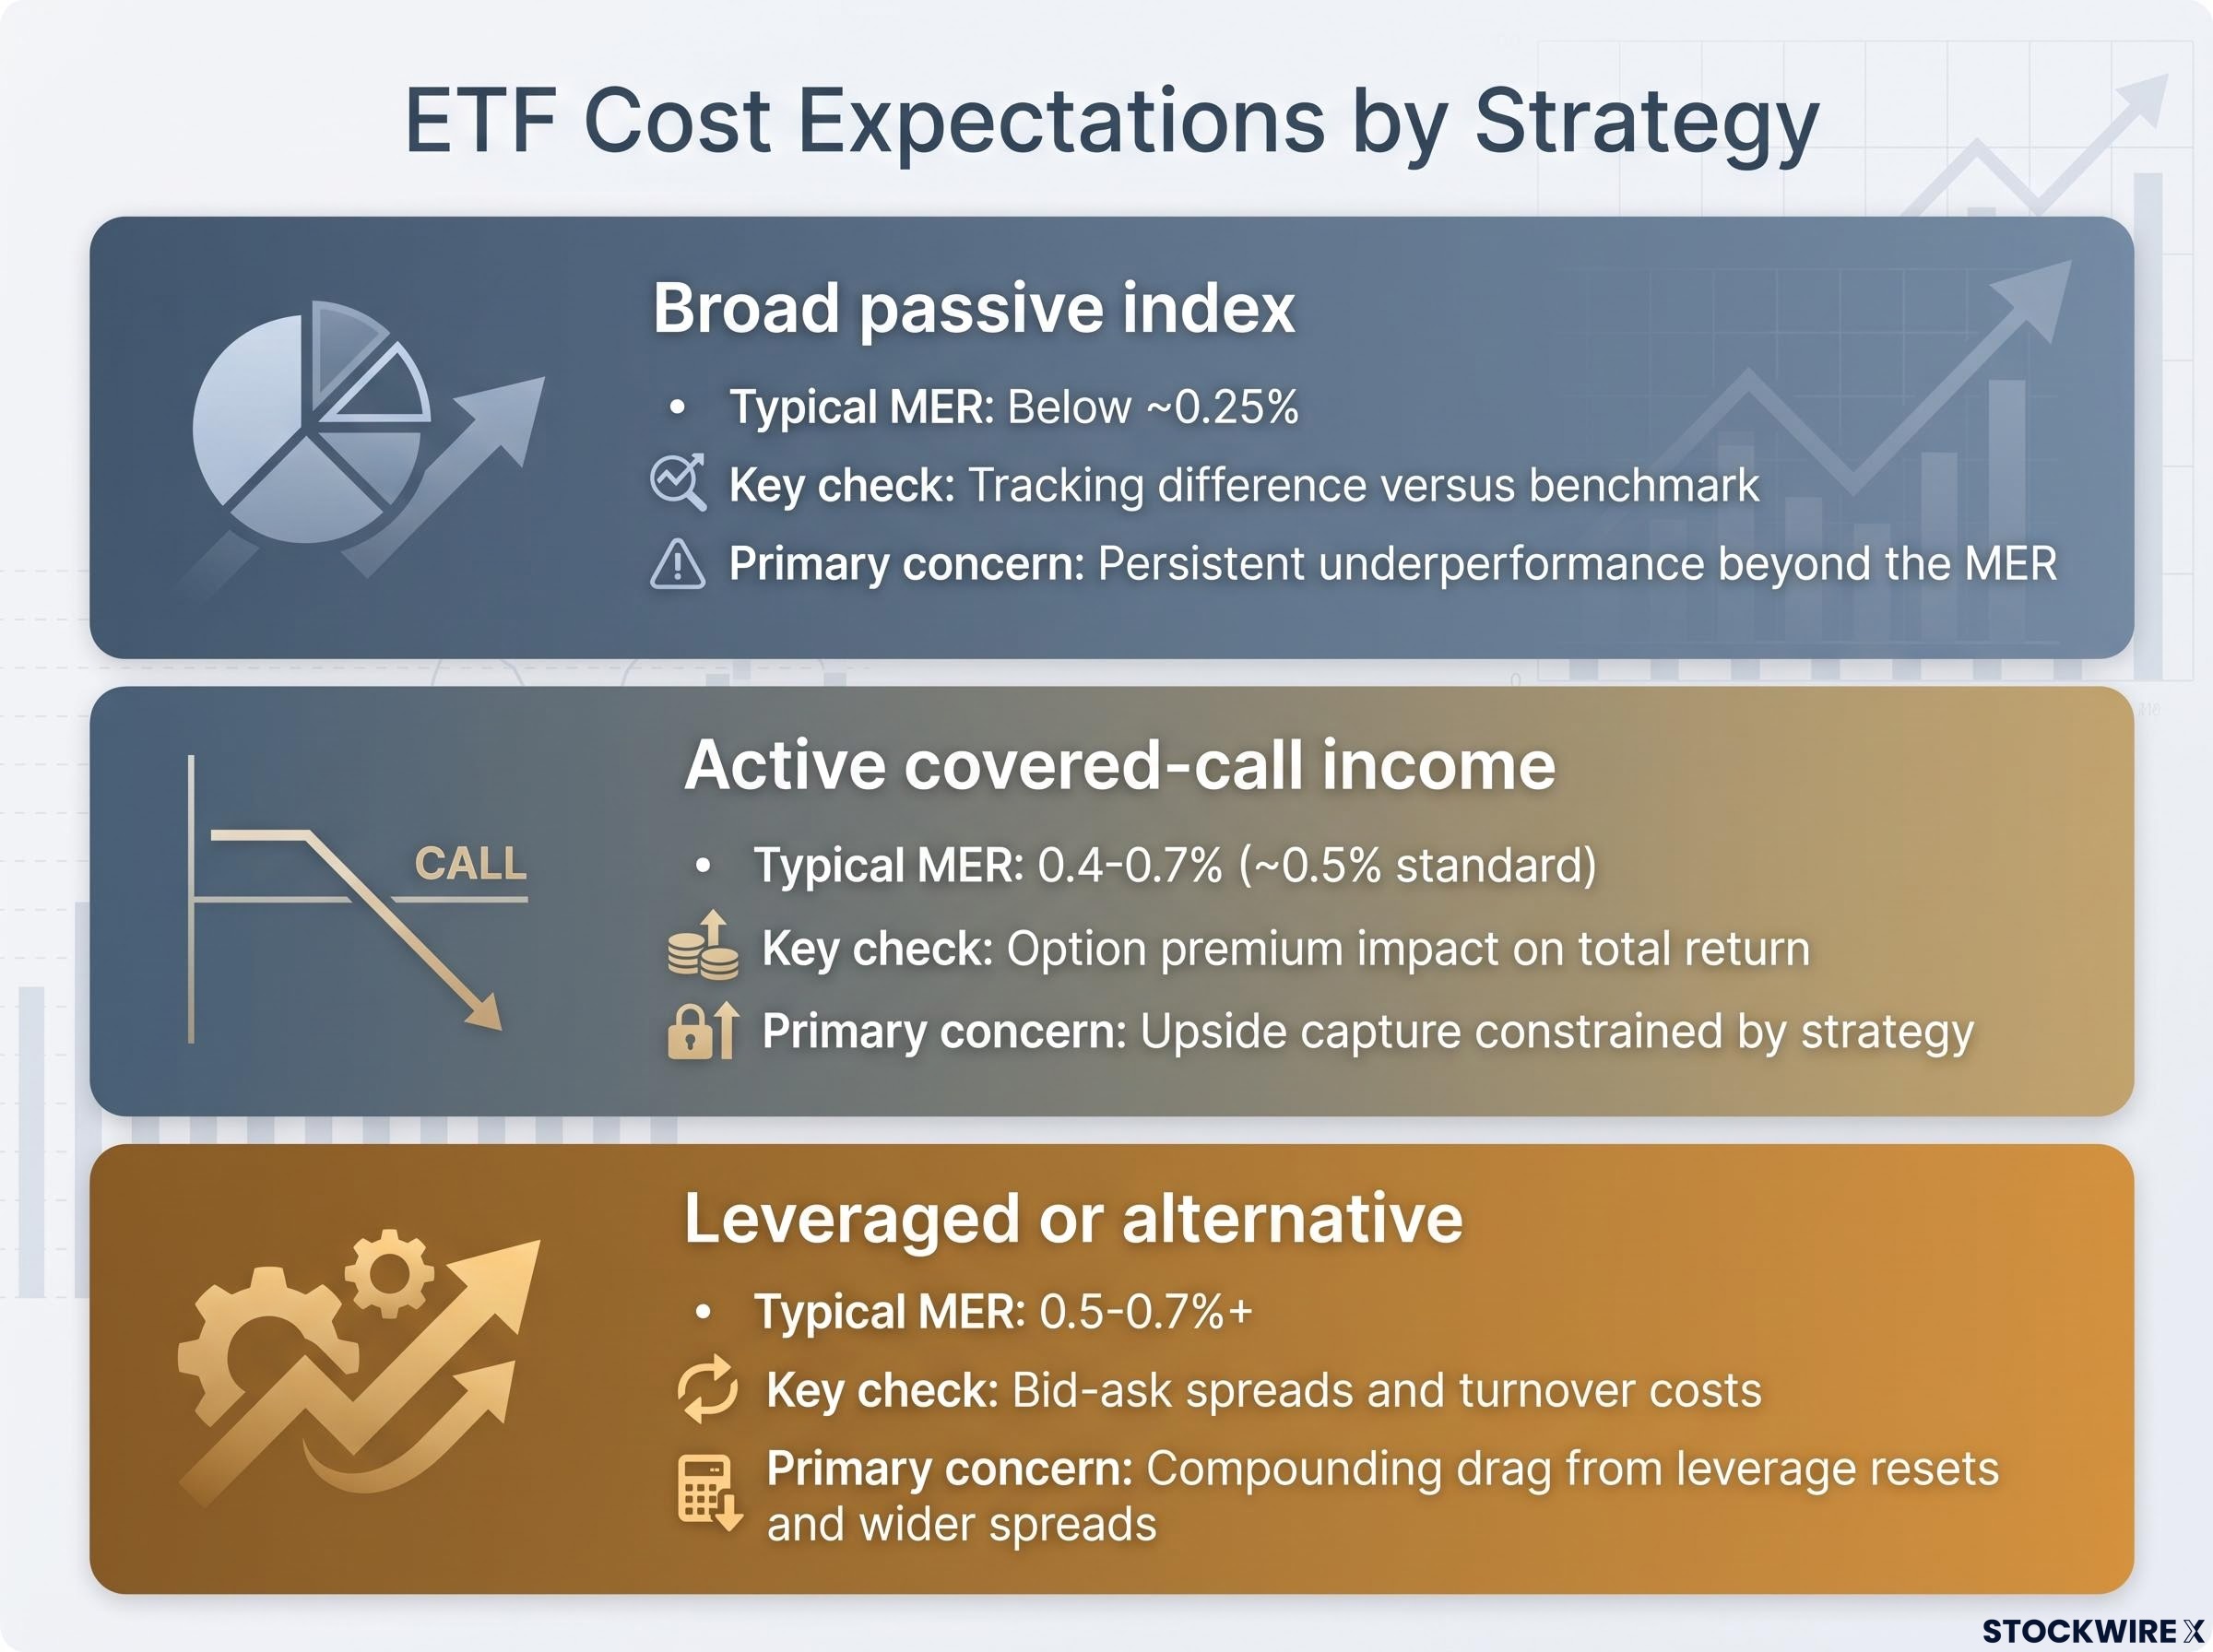
| ETF type | Typical MER range | Key additional cost to check | Primary cost concern |
|---|---|---|---|
| Broad passive index | Below ~0.25% | Tracking difference versus benchmark | Persistent underperformance beyond the MER |
| Active covered-call income | 0.4-0.7% (~0.5% standard) | Option premium impact on total return | Upside capture constrained by strategy |
| Leveraged or alternative | 0.5-0.7%+ | Bid-ask spreads and turnover costs | Compounding drag from leverage resets and wider spreads |
For index ETFs, tracking difference is the real-world measure of cost. It tells you how much of the index return the fund actually delivered to investors after all costs and operational frictions. Persistent underperformance of the ETF versus its benchmark beyond the MER is a warning sign of hidden implementation costs.
Tracking difference captures every operational friction the expense ratio ignores, including rebalancing front-running by professional traders, dividend timing delays, and partial securities lending pass-through, meaning an ETF charging just 0.03% can still trail its benchmark by more than 1.6 percentage points annually.
Bid-ask spreads add an implicit cost each time you trade. They matter most for less-liquid or niche ETFs and for investors who trade frequently. Fund domicile also affects withholding tax on foreign income, creating tax drag that the headline MER does not capture.
Total cost = MER + bid-ask spreads + tracking slippage + tax drag.
A 0.5% MER difference between two ETFs tracking the same index might look small. But compounded over 20 years on a significant portfolio, it translates into a material and entirely avoidable drag on your ending balance. This entire dimension maps to the Efficiency component of the CFA Institute’s E-T-F framework, which is the primary concern for long-term buy-and-hold investors.
Fee compounding across a 30-year horizon can produce a terminal wealth divergence of nearly $576,000 between two funds differing by less than 1% annually, a figure that makes the Morningstar finding that fees outpredict past performance, fund size, and star ratings as a long-term return indicator genuinely striking.
Distributions, income consistency, and the tax dimension
The headline yield number on a fund page tells you how much the ETF pays. It does not tell you what that yield is made of, and the composition is where the real analysis lives.
| Distribution source | What it signals about the fund | Tax treatment (non-registered account) |
|---|---|---|
| Canadian eligible dividends | Holdings generate corporate dividend income | Eligible for the dividend tax credit; most tax-efficient income type |
| Interest income | Bond or fixed-income holdings | Taxed at your full marginal rate |
| Option premiums | Covered-call or option-writing strategy in use | Typically taxed as capital gains or income depending on classification |
| Return of capital (ROC) | Fund returning your own invested capital, not generated income | Tax-deferred, but reduces adjusted cost base; taxed on disposition |
Review the multi-year distribution history across different market environments. Stable or gradually rising distributions are more supportive of a genuine income mandate than erratic payouts. Monthly distributions are common in Canadian income ETFs, though quarterly and annual frequencies also exist.
If a significant portion of an ETF’s yield is classified as return of capital, the fund is effectively paying you back your own money in instalments. That is not the same as generating income. Comparing its yield to a bond fund or dividend ETF on a raw percentage basis is misleading. Very high yields relative to peers warrant investigation into whether the strategy relies heavily on ROC or on option writing that constrains upside.
Tax treatment by account type
Where you hold an income ETF matters as much as what it pays. Registered accounts (RRSP, TFSA, FHSA) each carry distinct tax advantages: distributions that would otherwise be taxable annually can instead compound inside the account with Canadian tax deferred or eliminated altogether. That said, foreign withholding tax operates independently of these shelters, and U.S.-domiciled ETFs are treated differently from Canadian-domiciled ones even when held inside a registered account.
In non-registered accounts, income classification drives your annual tax bill. Canadian eligible dividends receive the dividend tax credit. Interest income is taxed at your full marginal rate. Capital gains are taxed at a lower effective rate. ROC is tax-deferred but reduces your adjusted cost base, meaning you pay more tax when you eventually sell.
ETF Facts and the fund’s annual tax breakdown show the historical composition of distributions. Check them before buying, and you will know whether a given ETF is better held inside or outside a registered account.
Liquidity, provider quality, and building a repeatable process
An ETF that looks efficient on paper but trades with wide, unstable spreads and comes from a provider with opaque reporting can cost you more in execution and operational risk than the MER difference you saved by choosing it. Liquidity and provider quality are the final two dimensions of due diligence, and they connect directly to how the fund performs when you actually need to trade it.
Liquidity operates on three layers:
- Secondary market liquidity: Trading volume and bid-ask spreads on the exchange. Larger ETFs with higher AUM and consistent volume tend to have tighter spreads and more reliable execution.
- Primary market liquidity: Authorised participants (specialised institutional traders) can create and redeem ETF units to keep the market price close to net asset value (NAV), which supports spread tightness.
- Underlying market liquidity: The liquidity of the securities inside the ETF. Thinly traded small-caps or niche bonds can make the ETF harder to trade at fair value during stress periods.
Persistent large premiums or discounts between an ETF’s market price and its NAV are a red flag for thin or complex products. ETF Facts explains the NAV concept and the relationship between market price and underlying value.
Provider quality criteria to assess:
- Years in ETFs: How long the provider has been managing exchange-traded funds
- Total ETF AUM: Larger, more established providers tend to support better liquidity and product maintenance
- Investment process clarity: Is the strategy well-documented and repeatable?
- Transparency and disclosure frequency: Can you understand what is happening in the fund when markets are stressed?
- Investor communications quality: Are updates timely, specific, and genuinely informative?
For Canadian advisors, Know Your Product (KYP) guidance emphasises documenting your analysis of ETF risk ratings, considering reasonable alternatives, and understanding any recent significant changes to the ETF.
A 30-60 minute review using publicly available sources before committing capital is a reasonable investment given the long-term amount at risk.
The framework earns its full value when you run at least two or three candidate ETFs through the same checklist side by side. That is where differences in cost, concentration, distribution quality, and liquidity become visible.
What changes when you compare two or three ETFs side by side
No ETF scores perfectly across all seven dimensions. The exercise is not about finding a theoretical optimum. It is about identifying the best fit for your specific objective, risk tolerance, and portfolio context. Placing two or three candidates against each other on the same checklist is where the framework produces its sharpest output. Gaps in cost, concentration, or distribution quality that appear minor in isolation become clearly visible once the numbers sit side by side.
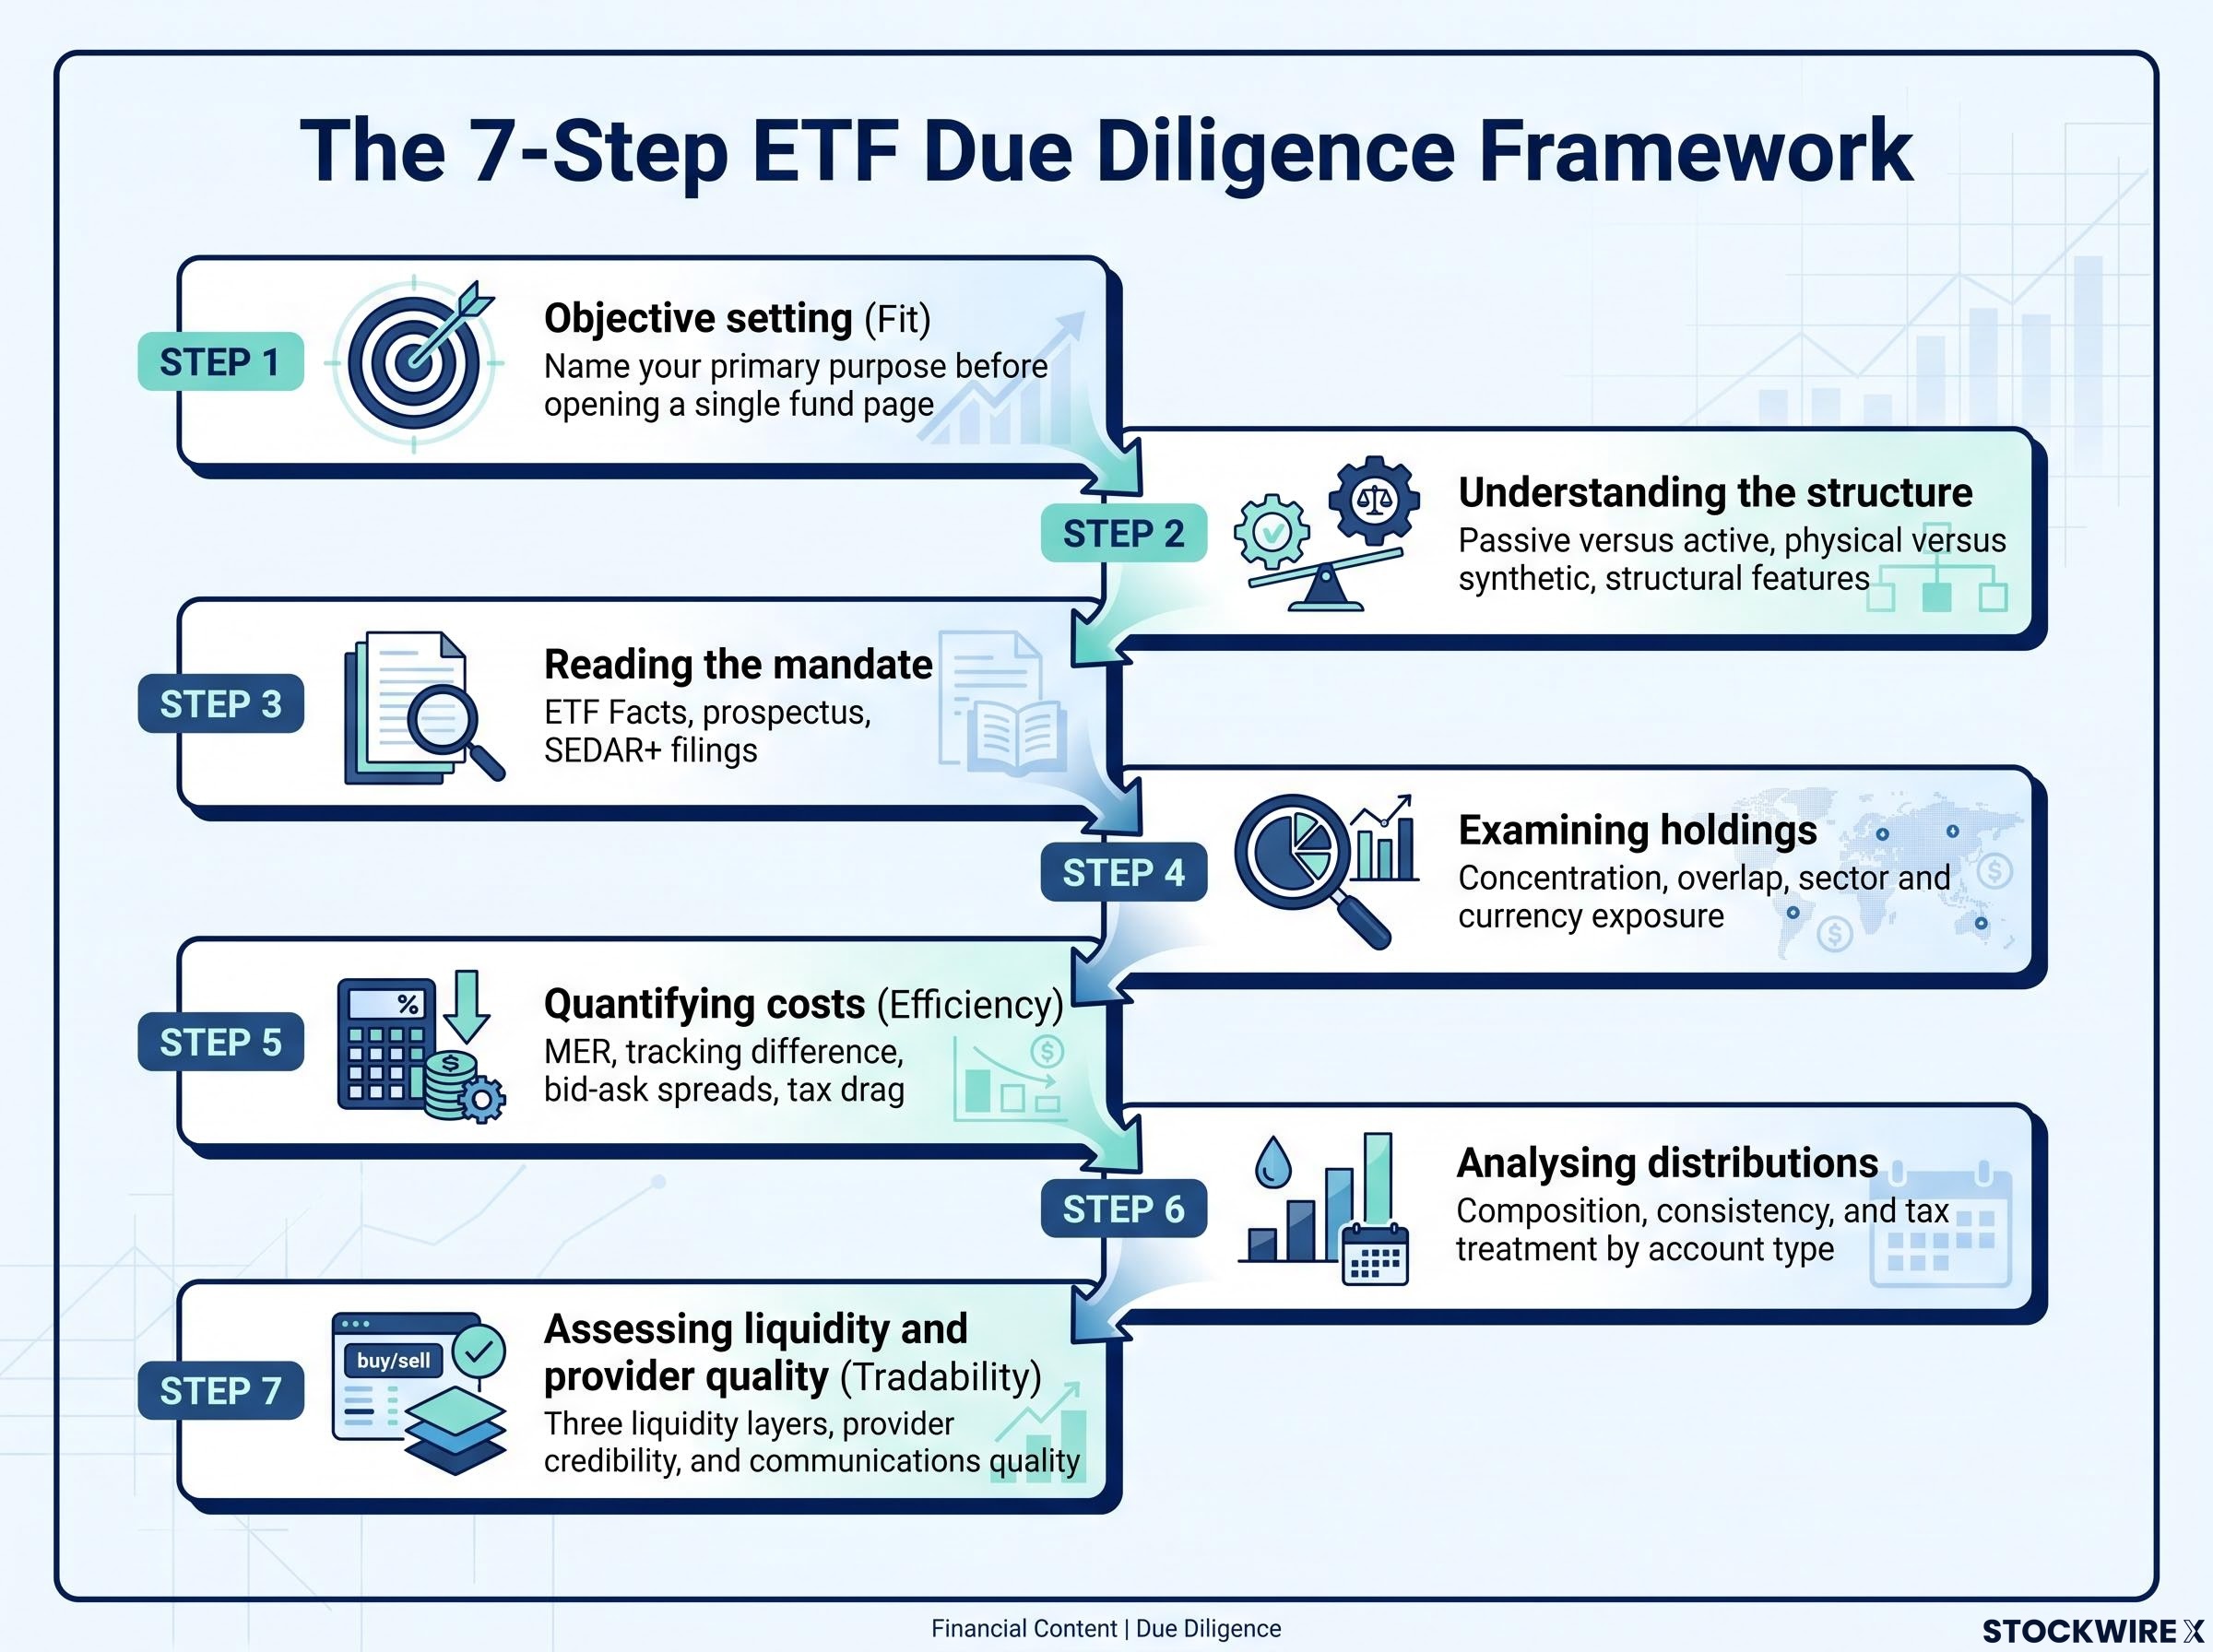
The seven-step framework, summarised:
- Objective setting (Fit): Name your primary purpose before opening a single fund page
- Understanding the structure: Passive versus active, physical versus synthetic, structural features
- Reading the mandate: ETF Facts, prospectus, SEDAR+ filings
- Examining holdings: Concentration, overlap, sector and currency exposure
- Quantifying costs (Efficiency): MER, tracking difference, bid-ask spreads, tax drag
- Analysing distributions: Composition, consistency, and tax treatment by account type
- Assessing liquidity and provider quality (Tradability): Three liquidity layers, provider credibility, and communications quality
This framework is reusable every time a new ETF candidate appears in your research. Run the checklist, compare the candidates, and commit capital only when you know exactly what you own, what it costs, and why it belongs in your portfolio.
This article is for informational purposes only and should not be considered financial advice. Investors should conduct their own research and consult with financial professionals before making investment decisions.