Why a BoJ Rate Hike Hasn’t Stopped the Yen Carry Trade
10 mins ago

VGS and IVV are two of the most widely held international ETFs on the ASX, and at first glance they appear to do the same job. They do not. Both are unhedged, both target developed-market equities, and both carry combined funds under management north of A$29 billion. Yet the differences in geographic scope, sector concentration, fee structure, and return profile between them are large enough to meaningfully affect long-term portfolio outcomes. With US equity valuations elevated and non-US developed markets drawing renewed attention in 2026, the choice between these two funds has become more consequential, not less. This analysis breaks down the specific differences across five dimensions: cost, geographic exposure, sector concentration, historical returns, and investor fit. By the end, readers will have a clear framework for deciding which fund, or combination of both, belongs in their portfolio.
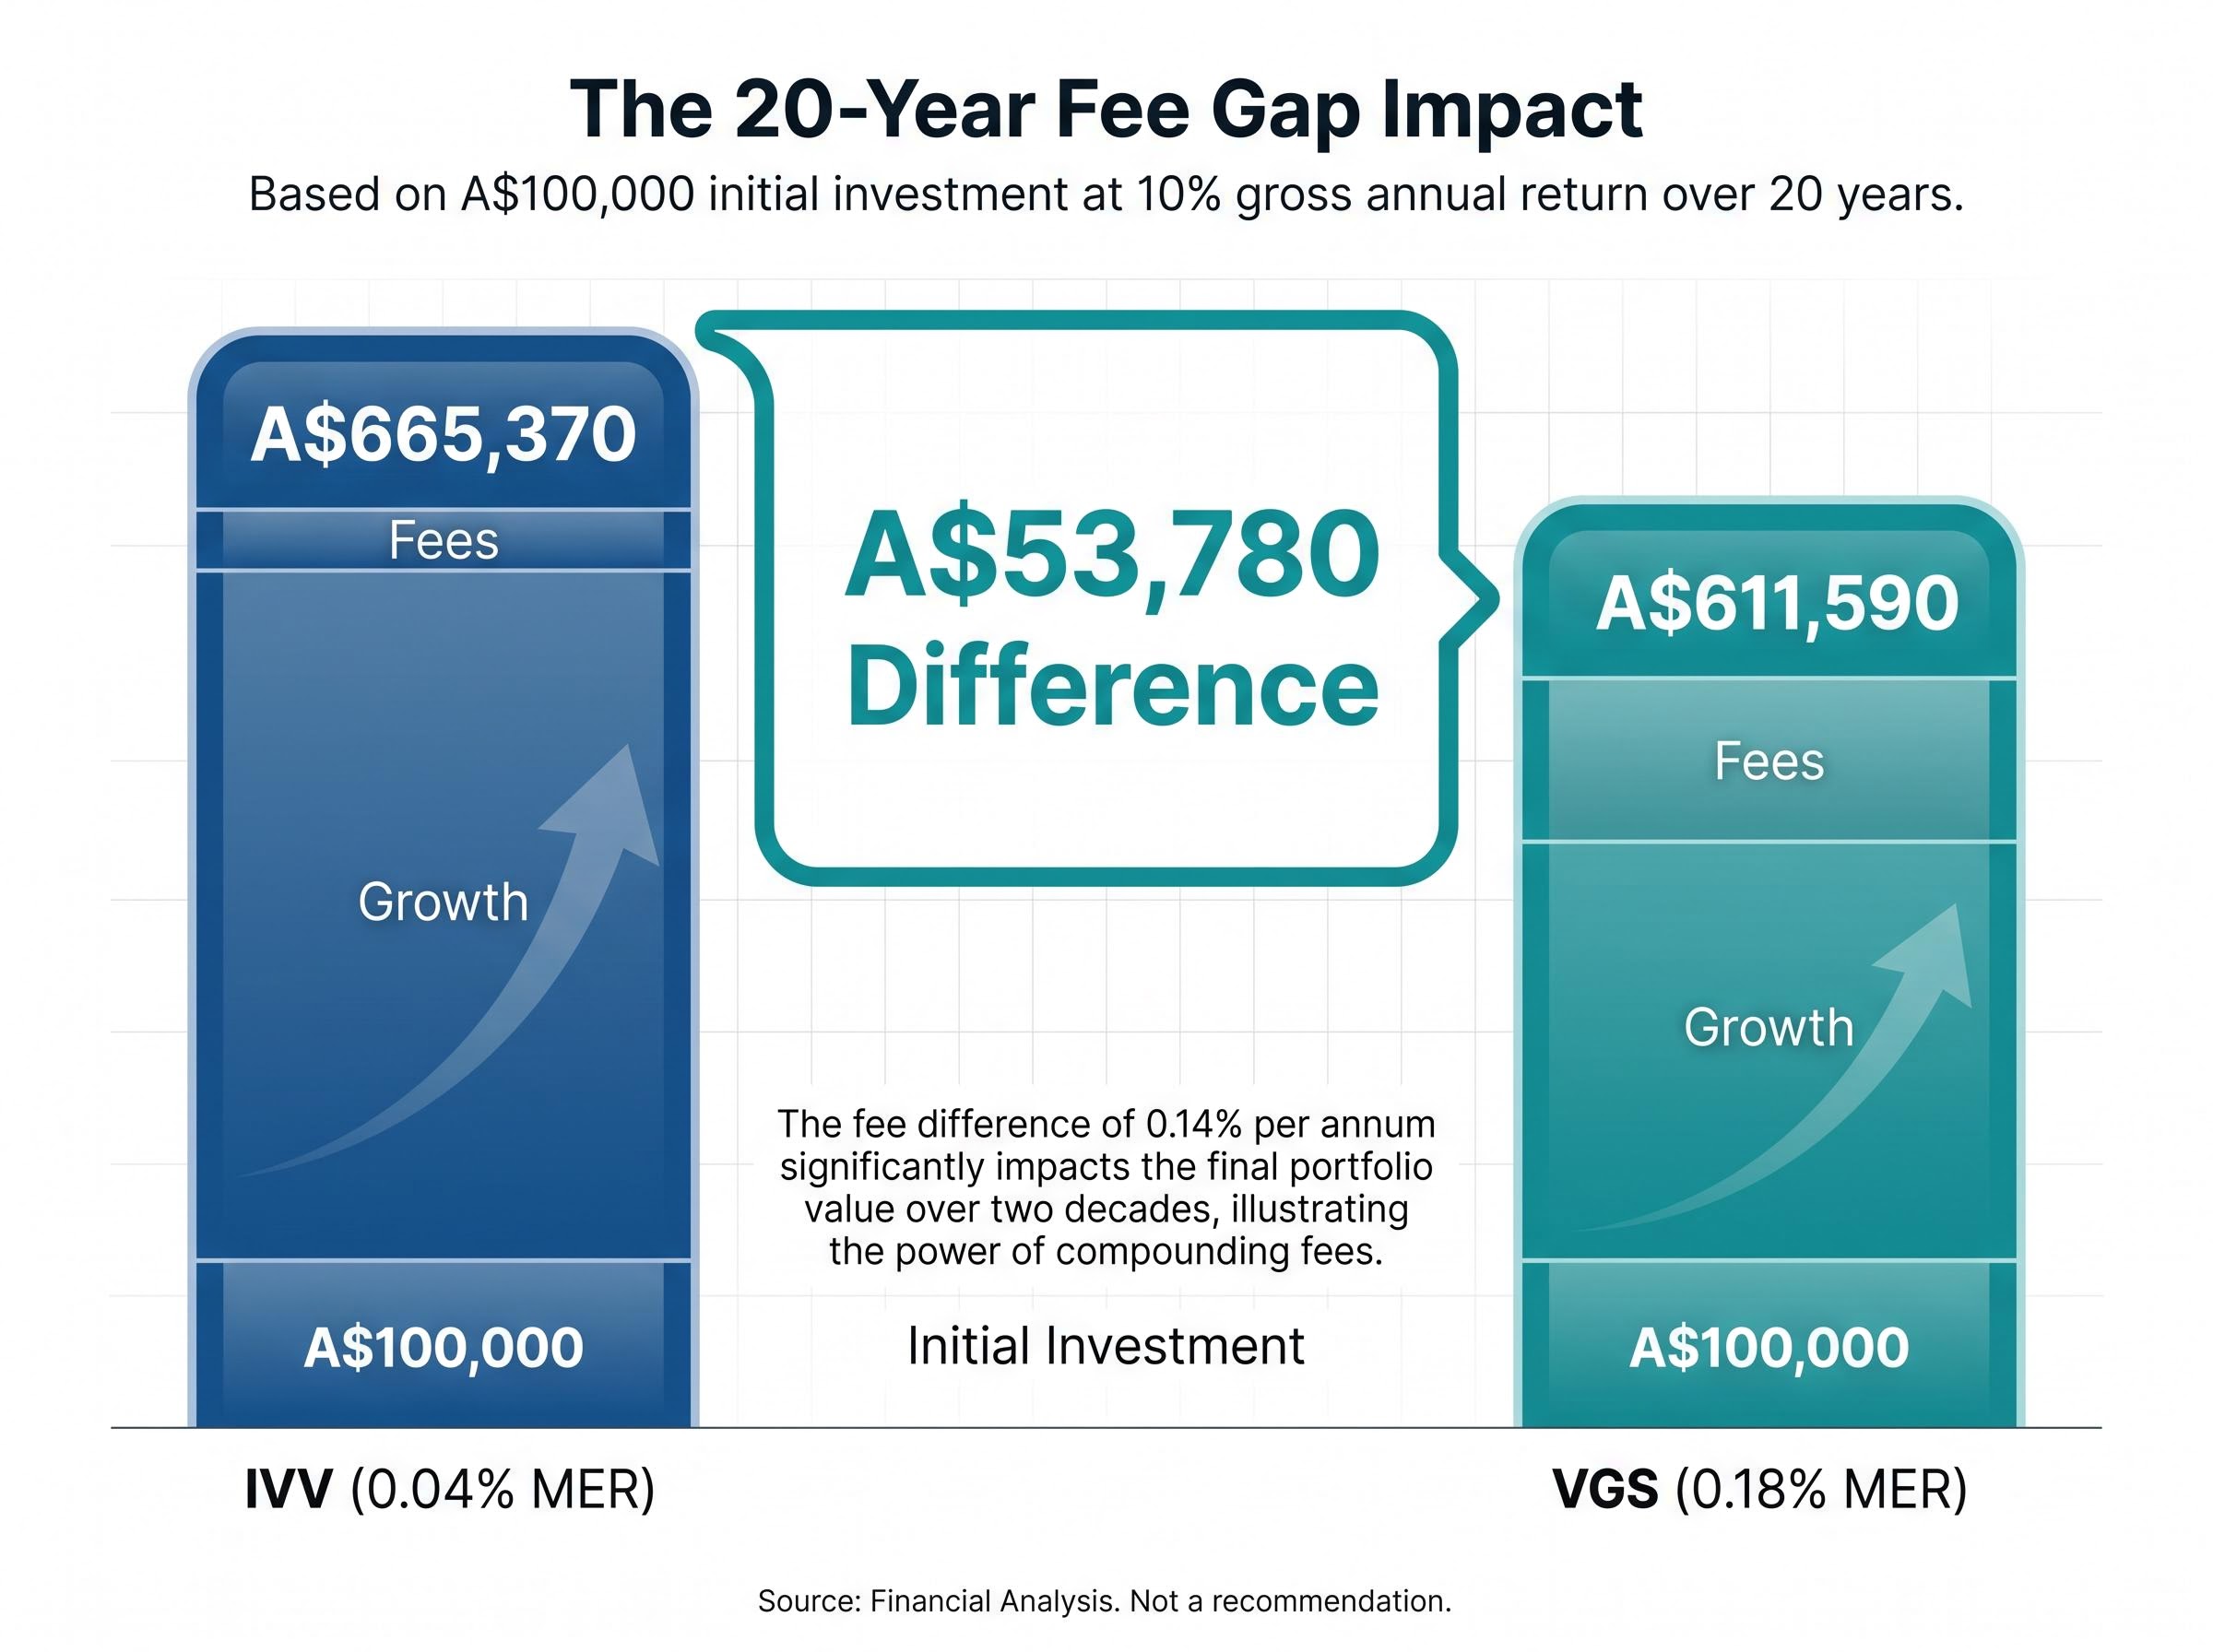
The headline numbers are straightforward:
A gap of 0.14 percentage points per year sounds negligible. It is not, once compounding takes hold.
ETF management fees are deducted daily from a fund’s net asset value and never appear as a separate line item, which is precisely why their compounding effect is so consistently underestimated by investors who focus on headline returns rather than net-of-fee outcomes.
On a A$100,000 portfolio earning a gross 10% annual return, the fee drag from VGS reduces the balance to approximately A$611,590 after 20 years, while IVV’s lower fee leaves approximately A$665,370 over the same period. That is a difference of roughly A$53,780, earned by the cheaper fund doing nothing more than charging less.
On a A$100,000 portfolio held for 20 years at 10% gross return, the compounding cost of the 0.14 percentage point fee gap amounts to approximately A$53,780 in favour of IVV.
IVV’s fee advantage is not accidental. It tracks a single-country index with roughly 503 holdings. VGS tracks a multi-country developed-markets benchmark across 1,275 holdings and multiple regulatory jurisdictions. The narrower mandate is cheaper to run. For long-term buy-and-hold investors, fees remain one of the few variables entirely within their control, and over a multi-decade horizon, this gap is not trivial.
Vanguard’s research on expense ratio compounding illustrates how even small reductions in annual fees translate into materially larger terminal balances over multi-decade holding periods, reinforcing why the 0.14 percentage point gap between these two funds is not a rounding error.
The assumption that VGS offers broad global diversification while IVV offers concentrated US exposure is technically correct and practically misleading. As of April 2026, VGS allocates 73.1% of its portfolio to US equities, up from approximately 69.9% in March 2025. IVV allocates 100%.
The real question is what the remaining 26.9% in VGS actually buys.
| Country | VGS Weight (approx.) | IVV Weight |
|---|---|---|
| United States | 73.1% | 100% |
| Japan | ~6.2% | 0% |
| United Kingdom | ~3.9% | 0% |
| France | ~3.0% | 0% |
| Switzerland | ~2.8% | 0% |
| Germany | ~2.8% | 0% |
| Canada | ~2.7% | 0% |
| Other developed markets | ~5.5% | 0% |
Note: The US figure for VGS is from the Vanguard Australia fact sheet dated 30 April 2026. Non-US country weights are approximate, sourced from the March 2025 fact sheet, and may have shifted modestly since.
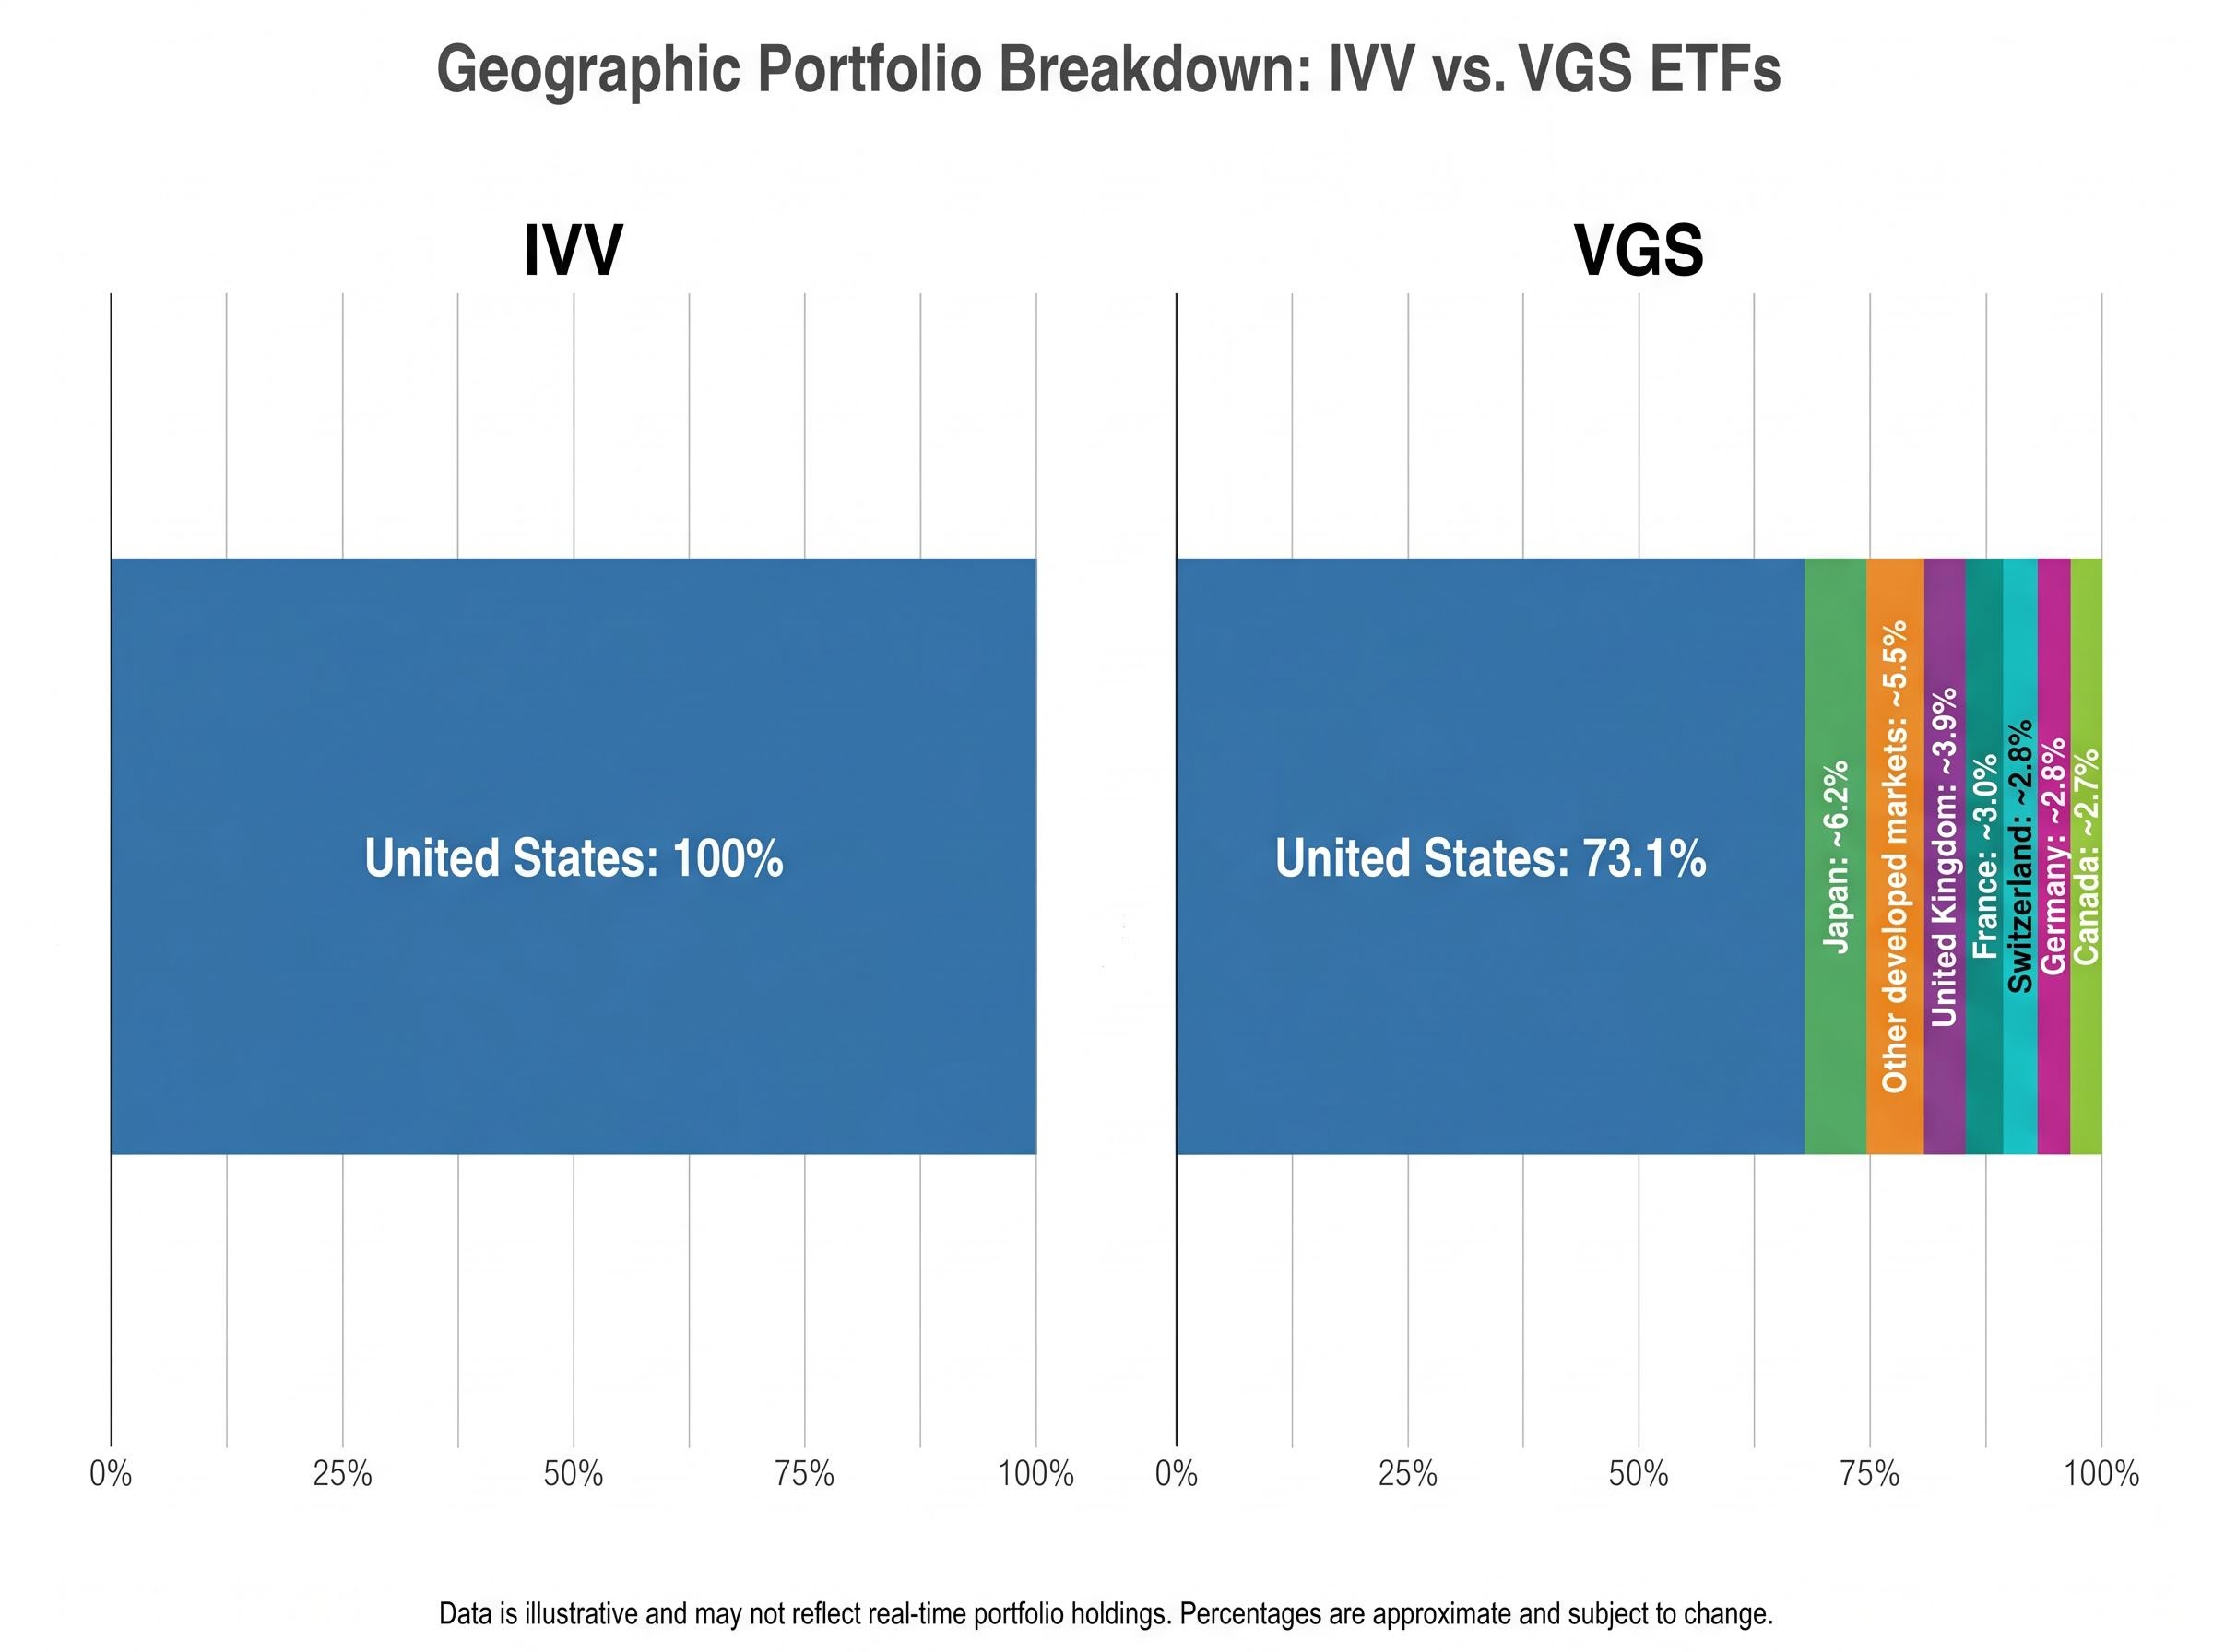
That roughly 27% non-US allocation delivers exposure to economies and sectors that the S&P 500 simply does not contain. European industrials, luxury goods conglomerates, and pharmaceutical groups sit alongside Japanese exporters and electronics manufacturers.
In concrete terms, VGS holders own positions in names such as LVMH, the French luxury group; ASML, the Dutch semiconductor equipment maker; and Nestlé, the Swiss consumer goods company. None of these appear in IVV. For investors who want any non-US developed-market exposure from a single holding, VGS provides it. IVV does not, and any geographic diversification beyond the US must come from separate holdings.
Both funds carry meaningful technology concentration. The difference is one of degree and what sits alongside it.
IVV’s S&P 500 weighting skews heavily toward mega-cap technology and communications: AI infrastructure, cloud computing, software, and digital advertising names dominate the top holdings. Morningstar Australia described IVV in June 2024 as a “pure US growth engine” heavily skewed to big tech.
Morningstar Australia (June 2024) characterised IVV as a “pure US growth engine” heavily skewed to big tech, noting that investors overweighting the fund are making a deliberate tilt to US equities, particularly technology and communication services sectors.
VGS carries similar technology exposure through its 73.1% US allocation, but the ex-US sleeve introduces sectors underrepresented in the S&P 500:
For Australian investors already holding VAS or a similar ASX-focused product, the domestic market is heavily concentrated in financials and materials. Neither IVV nor VGS replicates that exposure, which is the point. But understanding which sectors each fund adds, relative to existing domestic holdings, is where the diversification value becomes specific rather than theoretical.
VAS and domestic equity exposure sit at the other end of this equation: the ASX 200’s heavy concentration in financials and materials means that Australian investors holding VAS alongside either IVV or VGS are combining structurally complementary return drivers rather than duplicating them.
According to Livewire Markets (August 2024), there have been extended historical periods where non-US developed markets outperformed the S&P 500, reinforcing the case for VGS’s ex-US component as more than a drag on returns.
IVV has materially outperformed VGS across every trailing period to 31 March 2025. The numbers are clear.
| Period (to 31 March 2025) | VGS Net Return | IVV Net Return |
|---|---|---|
| 1-year | 22.3% | 28.7% |
| 3-year p.a. | 11.4% | 13.8% |
| 5-year p.a. | 12.0% | 15.4% |
Note: These figures are approximately 14 months stale as of publication. Readers should consult the latest Vanguard and BlackRock fact sheet PDFs for updated data.
The gap was driven by US mega-cap technology outperformance, not structural fund superiority. When the S&P 500’s largest constituents deliver outsized returns, IVV benefits fully and VGS benefits partially (through its 73.1% US allocation) while its ex-US sleeve dilutes the effect.
More recent data suggests the gap has narrowed. VGS reported a 1-year net return of 13.03% to 30 April 2026. A directly comparable IVV figure for the same period was not independently confirmed, but the direction of travel is visible.
Livewire Markets (February 2025) noted that CAPE ratios indicate US equities trade at a premium to developed ex-US markets. Several interviewed managers suggested that adding or maintaining exposure to ex-US markets through funds like VGS may improve long-term risk-adjusted returns.
Past return gaps between these two funds tell investors where US tech leadership has been, not where it is going. Extrapolating the divergence forward requires a view that US mega-cap dominance will persist at the same rate, a position that current valuations make harder to defend.
Past performance does not guarantee future results. Financial projections are subject to market conditions and various risk factors.
The structural differences between VGS and IVV are not technical trivia. They are investment choices with real-world consequences.
VGS tracks the MSCI World ex-Australia Index, a benchmark that includes large and mid-cap equities across 23 developed markets, excluding Australia. IVV tracks the S&P 500 Index, covering the 500 largest US-listed companies by market capitalisation. The index choice determines everything: which companies get in, which countries are represented, and how the portfolio rebalances.
Within the broader global ETF peer group on the ASX, VGS and IVV rank among the lowest-cost and most liquid options available, but investors comparing these two funds should be aware that the peer group spans 12 products with management fees ranging from 0.03% to 1.35% per annum, each with distinct liquidity profiles and return characteristics.
| Metric | VGS | IVV | Notes |
|---|---|---|---|
| Index tracked | MSCI World ex-Australia | S&P 500 | Multi-country vs single-country |
| FUM | A$15.508bn (Apr 2026) | ~A$13.6bn (May 2026) | Both highly liquid on ASX |
| Holdings | 1,275 | ~503 | VGS count as of Apr 2026 |
| MER | 0.18% p.a. | 0.04% p.a. | Fee gap: 0.14 ppts |
| Hedged variant | Yes (VGAD) | Not available | Relevant for AUD risk management |
Both funds are Australian-domiciled and unhedged by default. The hedging distinction matters for investors concerned about AUD volatility:
According to Vanguard Australia (March 2024), the AUD tends to fall during local recessions, meaning unhedged international ETFs can act as a natural cushion during domestic downturns. For investors who want the option to manage that currency exposure actively, VGS offers a structural advantage that IVV does not.
The decision between VGS and IVV is ultimately a question of what the investor already owns and what they want their international allocation to achieve.
IVV suits investors who:
VGS suits investors who:
According to Morningstar Australia (June 2024), investors overweighting IVV are making a deliberate tilt to US equities and should recognise it as such. Livewire Markets (April 2024) noted that investors seeking to reduce US tech concentration may complement either fund with regional or factor exposures.
Many Australian SMSF investors hold both, according to Livewire Markets (August 2024). The logic is a barbell: IVV delivers fee-efficient US market beta, while VGS adds the ex-US developed-markets sleeve and hedging optionality.
The combined portfolio would still be heavily US-weighted. An investor holding equal amounts of VGS and IVV carries an aggregate US allocation of approximately 86.5% (the average of 73.1% and 100%). This is a deliberate choice, not diversification by default. Investors using both funds should calculate their total US exposure and decide whether it matches their intent.
The choice between VGS and IVV is not a choice between a concentrated fund and a diversified one. Both carry substantial US equity exposure. The real question is whether the investor wants 73% or 100% US weight, and what they want to do with the remaining allocation.
IVV’s structurally lower fee is a genuine long-term advantage for cost-conscious investors comfortable with the concentration. VGS’s ex-US sleeve and hedging optionality earn their place for investors who want broader geographic coverage from a single holding.
The most useful next step is not picking a winner between these two funds. It is checking existing domestic holdings, calculating current US allocation across the portfolio, and determining whether VGS’s ex-US sleeve addresses an actual gap or duplicates exposure held elsewhere.
For investors ready to move beyond the two-fund comparison and think about how VGS and IVV fit within a full portfolio structure, our dedicated guide to building an ETF portfolio covers the core-satellite framework, the case for a deliberate domestic-to-international split, and the fee discipline required to avoid compounding costs eroding long-term returns.
This article is for informational purposes only and should not be considered financial advice. Investors should conduct their own research and consult with financial professionals before making investment decisions.
VGS tracks the MSCI World ex-Australia Index across 23 developed markets with 1,275 holdings and a 0.18% MER, while IVV tracks the S&P 500 Index covering approximately 503 US-listed companies at a lower 0.04% MER. The key difference is geographic scope: VGS allocates roughly 73% to the US and 27% to other developed markets, whereas IVV is 100% US-focused.
IVV has the lower management expense ratio at 0.04% per annum, compared to VGS at 0.18% per annum. On a A$100,000 portfolio held for 20 years at a 10% gross return, this 0.14 percentage point gap translates to approximately A$53,780 more in favour of IVV purely due to lower fees.
VGS provides roughly 27% exposure to non-US developed markets including Japan, the United Kingdom, France, Switzerland, Germany, and Canada, giving investors access to companies like ASML, LVMH, and Nestle that do not appear in IVV. However, with 73.1% still allocated to US equities as of April 2026, VGS remains heavily US-weighted.
Yes, many Australian SMSF investors hold both funds, using IVV for fee-efficient US market exposure and VGS to add the ex-US developed-markets sleeve and currency hedging optionality via VGAD. Investors should note that holding equal amounts of both results in an aggregate US allocation of approximately 86.5%, so total US exposure should be calculated deliberately.
IVV has outperformed VGS across all trailing periods to 31 March 2025, including a 1-year return of 28.7% versus 22.3% for VGS, and a 5-year annualised return of 15.4% versus 12.0%. This gap was driven by US mega-cap technology outperformance, and more recent data to April 2026 suggests the gap has begun to narrow.