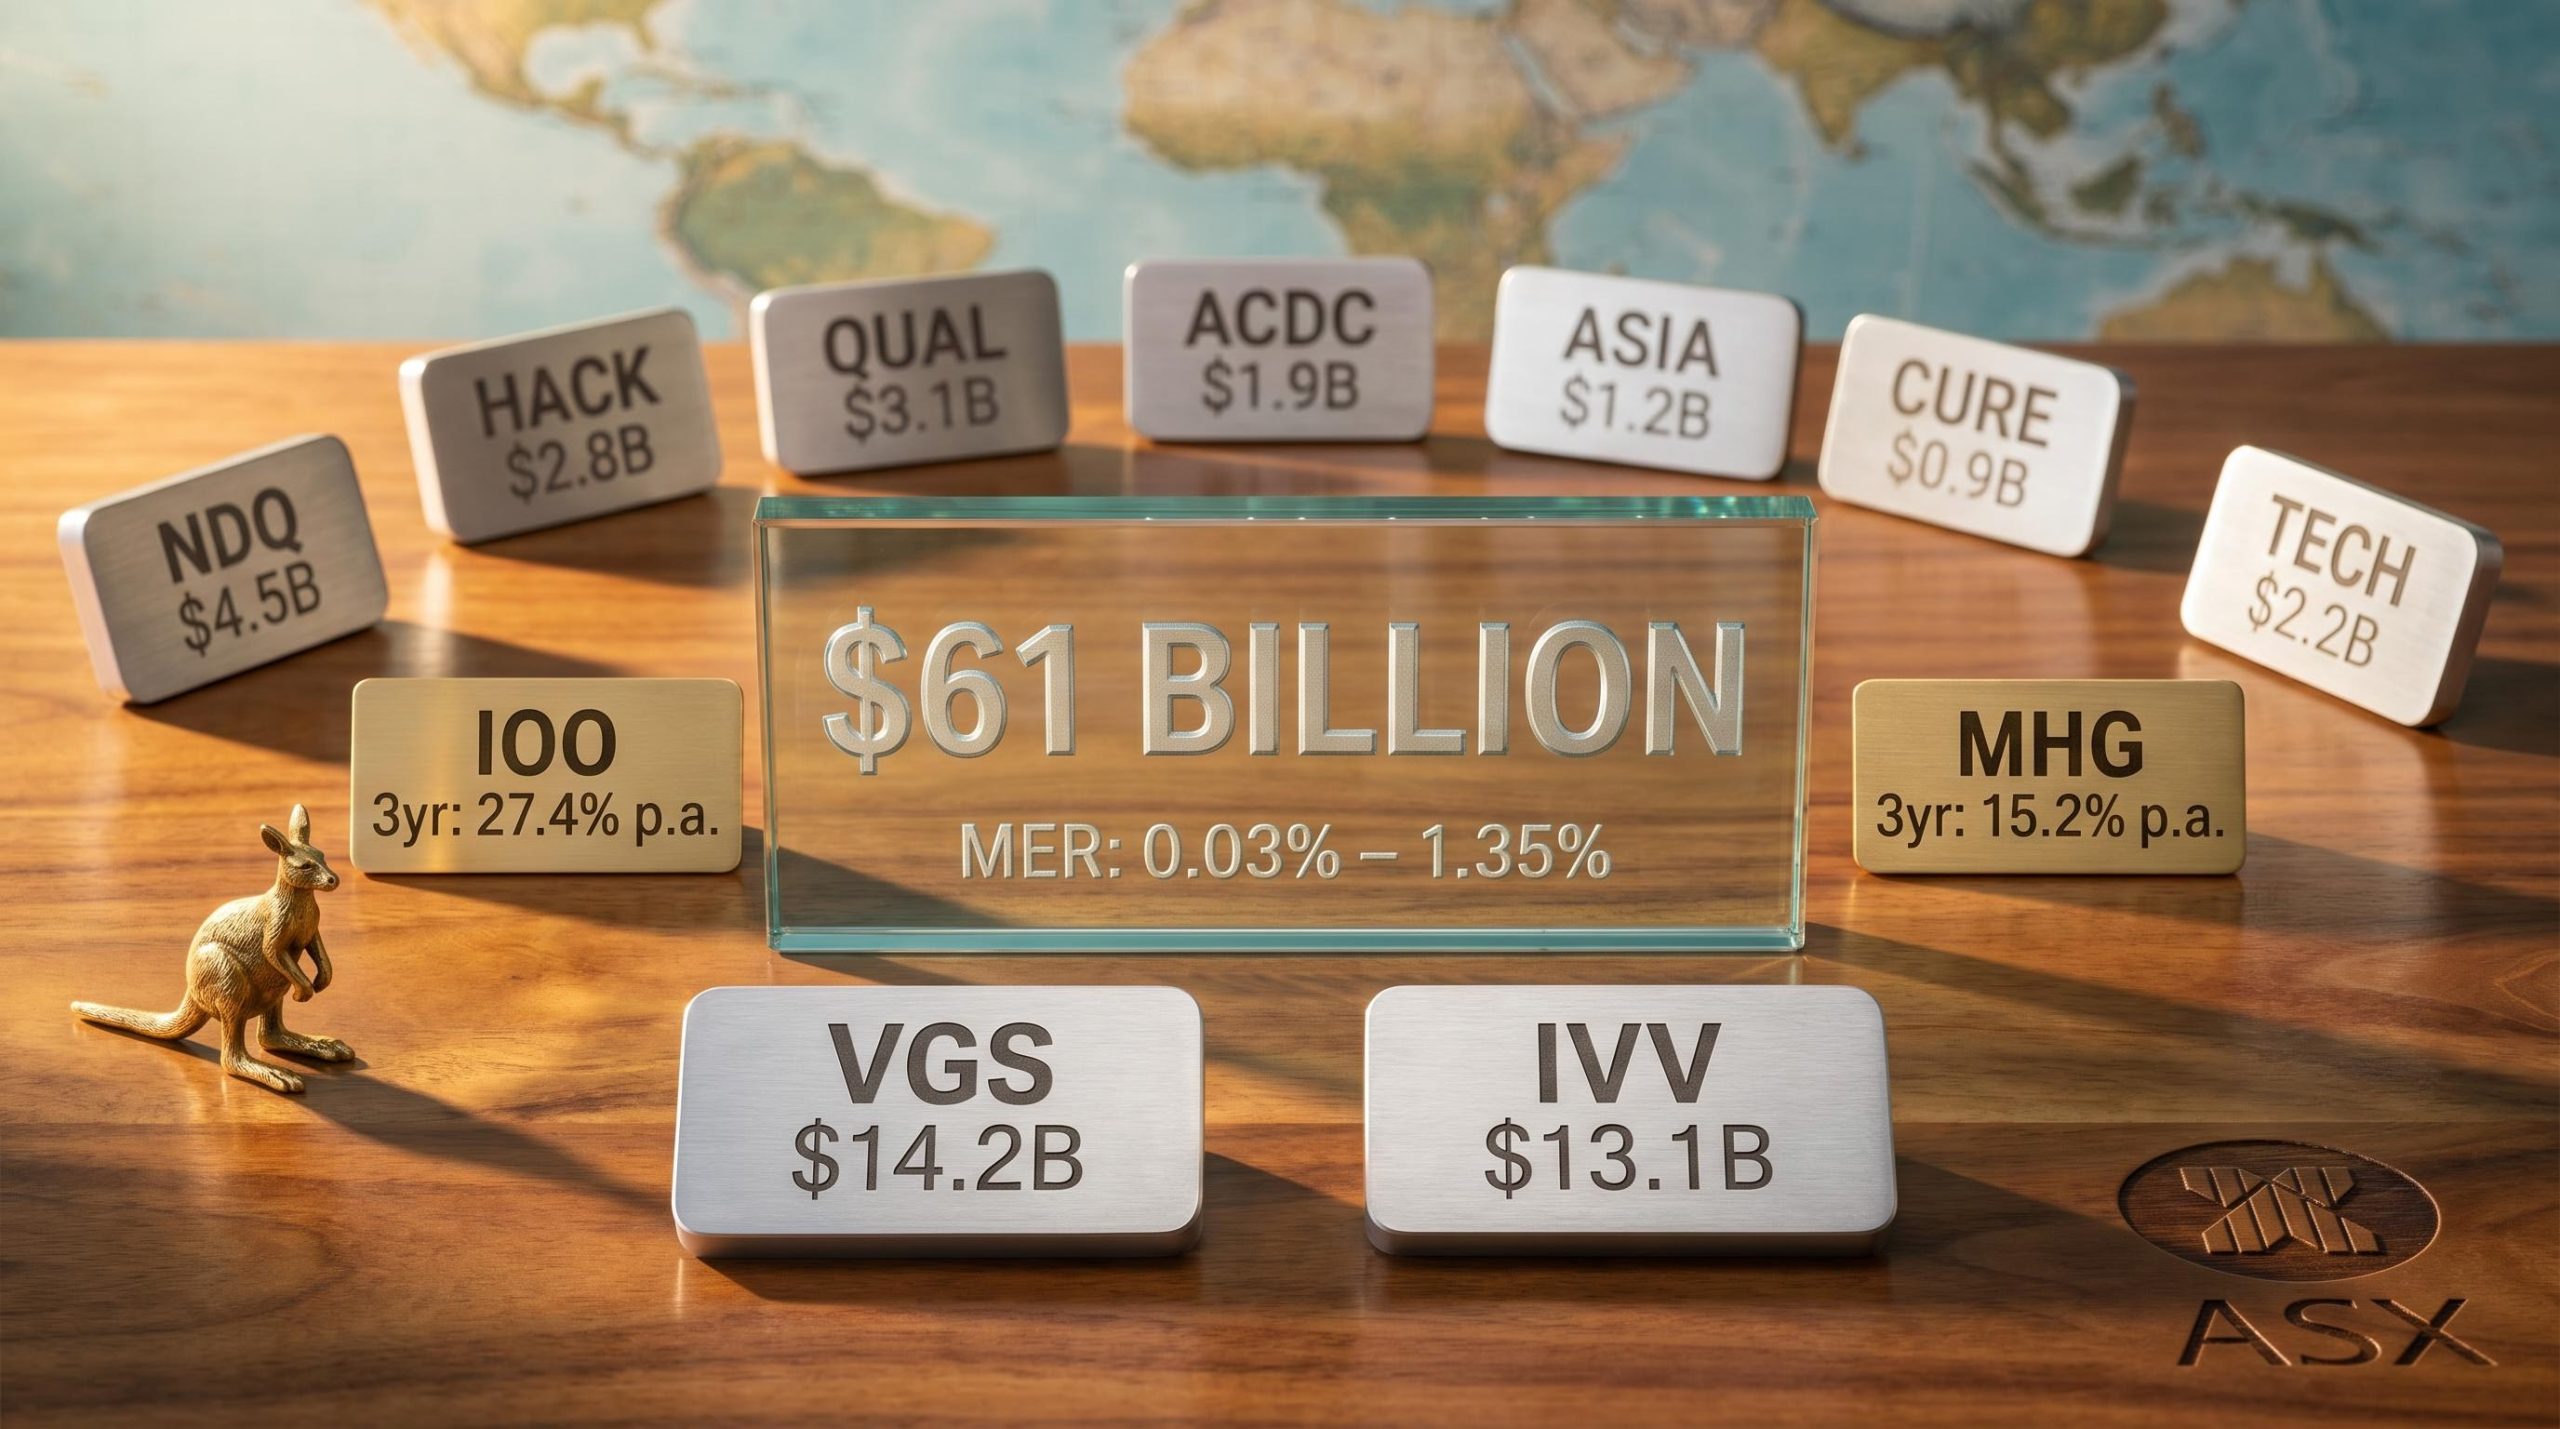
More than $61 billion sits across just 12 global share ETFs on the ASX. Their management costs range from 0.03% to 1.35% per annum, and their three-year annualised returns vary by more than 12 percentage points. Two investors with the same objective, buying the same asset class on the same exchange, can produce dramatically different outcomes depending on which fund they choose.
The Australian ETF market reached $330.6 billion in total market capitalisation by the end of 2025, with international equities attracting $20.9 billion in net inflows across the year, up from $15.1 billion in 2024. That growth means more choice, but also more complexity for retail and SMSF investors trying to identify the right global share ETF for their situation.
This guide walks through the five criteria used to compare the 12 largest global share ETFs on the ASX as at December 2025: fund size, management costs, bid/ask spreads, liquidity, and returns. Each criterion is explained in practical terms, with the numbers translated into real-world outcomes, so investors can make an informed selection.
Why Australian investors need global share ETFs (and what makes choosing one difficult)
The Australian share market is heavily concentrated in two sectors: financials and materials. It represents a small fraction of global market capitalisation, which means investors who hold only ASX equities miss the technology, healthcare, and consumer sectors that dominate international indices. Global share ETFs solve that problem directly by providing diversified exposure to developed markets in a single trade.
The structural case for international diversification is reinforced by data on home bias in Australian portfolios, where investors have historically over-allocated to ASX-listed financials and materials at the expense of global technology, healthcare, and consumer sectors that now represent the majority of world market capitalisation.
The difficulty is that the solution now comes in 12 competing forms. As at 31 December 2025, the 12 largest global share ETFs on the ASX collectively held close to $61 billion in funds under management, with eight individual products each exceeding $1 billion in AUM: IOO, IVV, MGOC, VGS, VGAD, IHVV, VEU, and VTS. International equity ETFs attracted $20.9 billion in net inflows during 2025, up from $15.1 billion the prior year.
The Australian ETF industry review for 2025 published by Betashares in January 2026 confirms the market reached $330.6 billion in total capitalisation by year-end, with international equity net inflows of $20.9 billion representing a meaningful acceleration from the $15.1 billion recorded in 2024.
On the surface, many of these funds look similar. They hold international shares, they trade on the ASX, and they promise global diversification. Beneath those similarities, they differ substantially on cost, currency structure, liquidity, and return profile. Side-by-side comparison across five specific criteria is the clearest way to separate them:
- Fund size (AUM and investor flows)
- Management costs (MER and compounding impact)
- Bid/ask spreads (the hidden cost of every transaction)
- Liquidity (daily traded value and price stability)
- Returns (one-year, three-year, and five-year performance with context)
Each criterion is unpacked in its own section below.
When big ASX news breaks, our subscribers know first
Criterion 1: Fund size and what it signals about investor confidence
Larger funds attract tighter bid/ask spreads, carry lower closure risk, and signal sustained market confidence. For retail and SMSF investors, AUM serves as a useful starting screen because it reflects the collective judgment of thousands of investors committing capital over time.
VGS reclaimed the top position from IVV in Q4 2025, recording the largest quarterly inflow in the peer group.
VGS attracted approximately $1.05 billion in net inflows during Q4 2025 alone, a signal of sustained momentum among Australian investors seeking broad international exposure.
The full size hierarchy as at 31 December 2025:
| ETF Code | Fund Name | AUM (Dec 2025) | Provider |
|---|---|---|---|
| VGS | Vanguard MSCI Index International Shares | $14.2B | Vanguard |
| IVV | iShares S&P 500 | $13.1B | BlackRock |
| VTS | Vanguard US Total Market Shares Index | $6.4B | Vanguard |
| MGOC | Magellan Global Fund (Open Class) | $6.4B | Magellan |
| VGAD | Vanguard MSCI Index International Shares (Hedged) | $6.2B | Vanguard |
| IOO | iShares Global 100 | $5.4B | BlackRock |
| VEU | Vanguard All-World ex-US Shares Index | $5.1B | Vanguard |
| IHVV | iShares S&P 500 (AUD Hedged) | $3.2B | BlackRock |
| WXOZ | Betashares Global Sustainability Leaders | $0.7B | Betashares |
| IHOO | iShares Global 100 (AUD Hedged) | $0.6B | BlackRock |
| WXHG | Betashares Global Sustainability Leaders (Hedged) | $0.4B | Betashares |
| MHG | Magellan Global Fund (Hedged) | $0.1B | Magellan |
While smaller funds are not inherently problematic, investors making large or regular contributions should prefer funds with sufficient daily trading depth to absorb their activity without price impact. Fund size is the starting filter, not the final answer.
Criterion 2: What the fee label does not tell you (management costs and their compounding effect)
The management expense ratio (MER) across these 12 funds ranges from 0.03% to 1.35%. That headline spread looks abstract until the compounding maths makes it concrete.
Management costs are deducted daily from a fund’s net asset value, meaning the drag is continuous and invisible to investors who only check unit prices. The difference between paying 0.04% (IVV) and 1.35% (MGOC or MHG) on a $100,000 portfolio over 20 years at a 10% gross annual return is substantial: the higher-cost fund would erode tens of thousands of dollars more in cumulative fees over that period, purely through the compounding effect of the daily deduction.
Vanguard reduced VEU’s MER from 0.07% to 0.04% in 2025, aligning it with IVV. Fee competition among providers continues to benefit investors.
| ETF Code | MER | Passive / Active | Hedged / Unhedged |
|---|---|---|---|
| VTS | 0.03% | Passive | Unhedged |
| IVV | 0.04% | Passive | Unhedged |
| VEU | 0.04% | Passive | Unhedged |
| WXOZ | 0.07% | Passive | Unhedged |
| IHVV | 0.10% | Passive | Hedged |
| WXHG | 0.10% | Passive | Hedged |
| VGS | 0.18% | Passive | Unhedged |
| VGAD | 0.21% | Passive | Hedged |
| IOO | 0.40% | Passive | Unhedged |
| IHOO | 0.43% | Passive | Hedged |
| MGOC | 1.35% | Active | Unhedged |
| MHG | 1.35% | Active | Hedged |
Approximately 92% of U.S. active fund managers failed to outperform their benchmark over a 15-year period, according to industry data. This statistic underpins why passive index funds dominate low-cost product recommendations for long-term accumulators and SMSF investors.
The 92% active manager underperformance figure cited here is part of a broader body of evidence on active versus passive fund performance that extends across equity categories, time horizons, and fee regimes, with net-of-fee comparisons consistently favouring passive index products for long-term accumulators.
For long-term investors, the MER is the single cost that recurs every year regardless of market performance. Even a 0.20% difference compounds into material dollar amounts over a 20-30 year accumulation horizon.
Criterion 3: The hidden cost of trading (bid/ask spreads and liquidity)
The bid/ask spread is the gap between the price a buyer pays and the price a seller receives. It is absorbed entirely by the investor on every transaction, and it never appears in an ETF’s stated MER. Most retail investors overlook it completely.
Global ETF spreads are structurally wider than Australian share ETF spreads (which average approximately 0.05%) because international markets are closed during ASX trading hours, reducing real-time pricing efficiency for market makers. Passive index ETFs cluster below 0.10%, while the active Magellan funds carry spreads of 0.35% and 0.45% respectively.
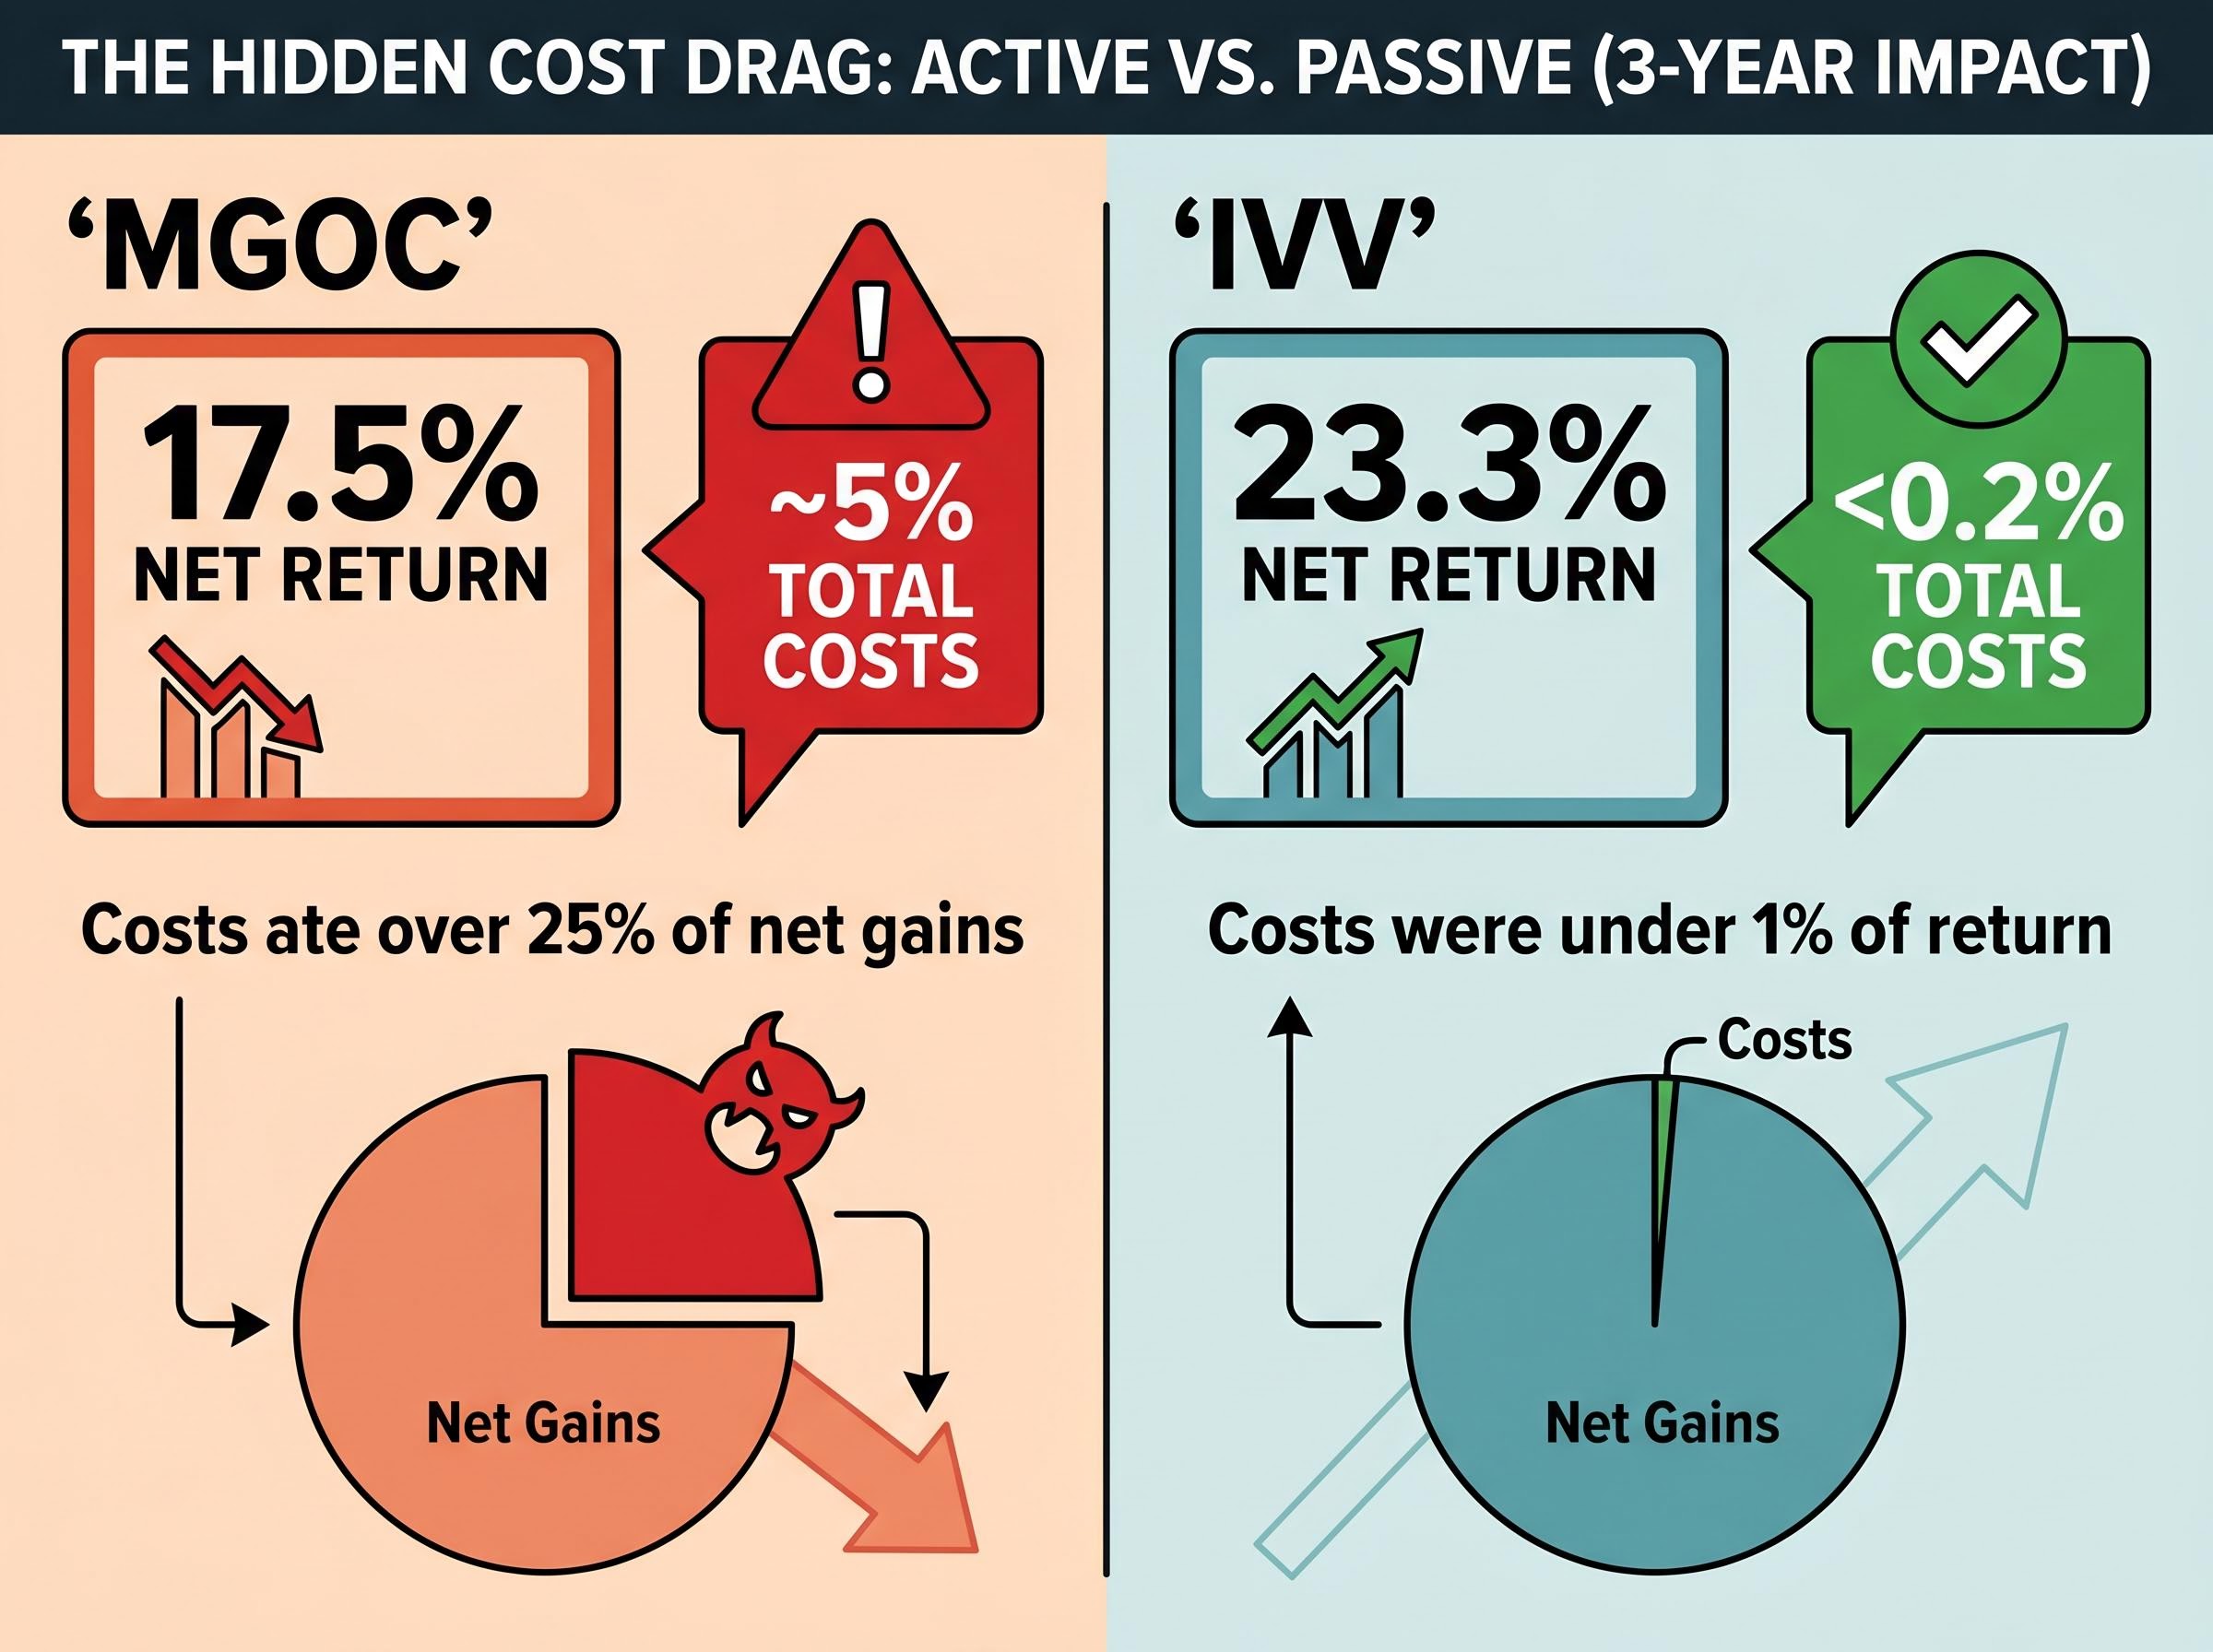
Consider MGOC over a three-year holding period. Combined spread and management costs amounted to approximately 5% against a net return of 17.5%.
That means MGOC investors paid over 25% of their net gains in costs. By contrast, IVV investors paid total costs below 0.2% against a three-year net return of 23.3%, meaning cost as a proportion of return was under 1%.
| ETF Code | Bid/Ask Spread | Avg Daily Traded Value | Liquidity Tier |
|---|---|---|---|
| VGS | 0.02% | $27.3M | High |
| IVV | 0.03% | $28.3M | High |
| VGAD | 0.04% | $13.1M | High |
| VTS | 0.04% | $6.2M | Medium |
| IOO | 0.05% | $7.6M | Medium |
| IHVV | 0.06% | $6.1M | Medium |
| VEU | 0.07% | $8.0M | Medium |
| IHOO | 0.12% | $1.1M | Low |
| WXOZ | 0.17% | $0.4M | Low |
| WXHG | 0.19% | $0.4M | Low |
| MGOC | 0.35% | $4.2M | Medium |
| MHG | 0.45% | $0.1M | Low |
Only IVV ($28.3M) and VGS ($27.3M) consistently show the daily trading depth that supports large transactions without price slippage. Investors who make monthly contributions are paying the spread on every single transaction; at 0.35%, that is a meaningful recurring drag.
To minimise spread exposure:
- Use limit orders rather than market orders to control the price paid on each transaction
- Trade during peak ASX hours (typically 11:00am to 3:00pm AEST) when market makers are most active and spreads are at their tightest
- Consolidate smaller contributions into fewer, larger transactions where brokerage costs permit
Criterion 4: Returns across one, three, and five years (and why past performance needs context)
The return numbers tell a clear story at first glance. IOO leads across three-year and five-year horizons. IVV and VTS follow closely. The active Magellan funds trail.
| ETF Code | 1-year Return | 3-year Return (p.a.) | 5-year Return (p.a.) |
|---|---|---|---|
| IOO | 17.9% | 27.4% | 19.8% |
| IHOO | — | 25.3% | — |
| IVV | 9.4% | 23.3% | 17.6% |
| VTS | — | 22.9% | 16.5% |
| WXOZ | 13.1% | 22.7% | 14.9% |
| VGS | 12.9% | 22.0% | 15.6% |
| IHVV | — | 21.1% | — |
| WXHG | — | 20.7% | — |
| VGAD | — | 20.4% | — |
| VEU | 23.2% | 17.6% | 11.1% |
| MGOC | — | 17.5% | — |
| MHG | — | 15.2% | 6.6% |
Returns to 31 December 2025. Not all funds have data available across all time periods.
Over five years, IOO delivered 19.8% per annum while MHG returned 6.6%, a gap of approximately 13 percentage points per annum. That spread reflects the combined impact of fee differentials, active management underperformance, and currency hedging during a period of AUD depreciation.
IOO’s outperformance stems from its concentration in the world’s 100 largest companies, predominantly U.S.-listed. That concentration delivered strong returns during a period of U.S. large-cap and technology dominance, but it is a risk factor, not merely a return driver. Investors who understand why IOO outperformed are better positioned to assess whether that concentration suits their risk tolerance in an environment of tariff uncertainty and potential U.S. growth softness.
VEU occupies a distinct role by excluding U.S. companies entirely, providing exposure to Japan, the UK, Europe, and Canada. Its one-year return of 23.2% to December 2025 was the highest in the peer group, reflecting a period where international developed markets outperformed the S&P 500. For investors concerned about U.S. concentration, VEU offers a portfolio complement rather than a replacement.
Hedged vs. unhedged: how currency movement has shaped performance
Hedged ETFs use derivatives to neutralise AUD/foreign currency fluctuations, meaning the investor captures equity returns without the currency overlay. Unhedged ETFs pass currency movement through to the investor.
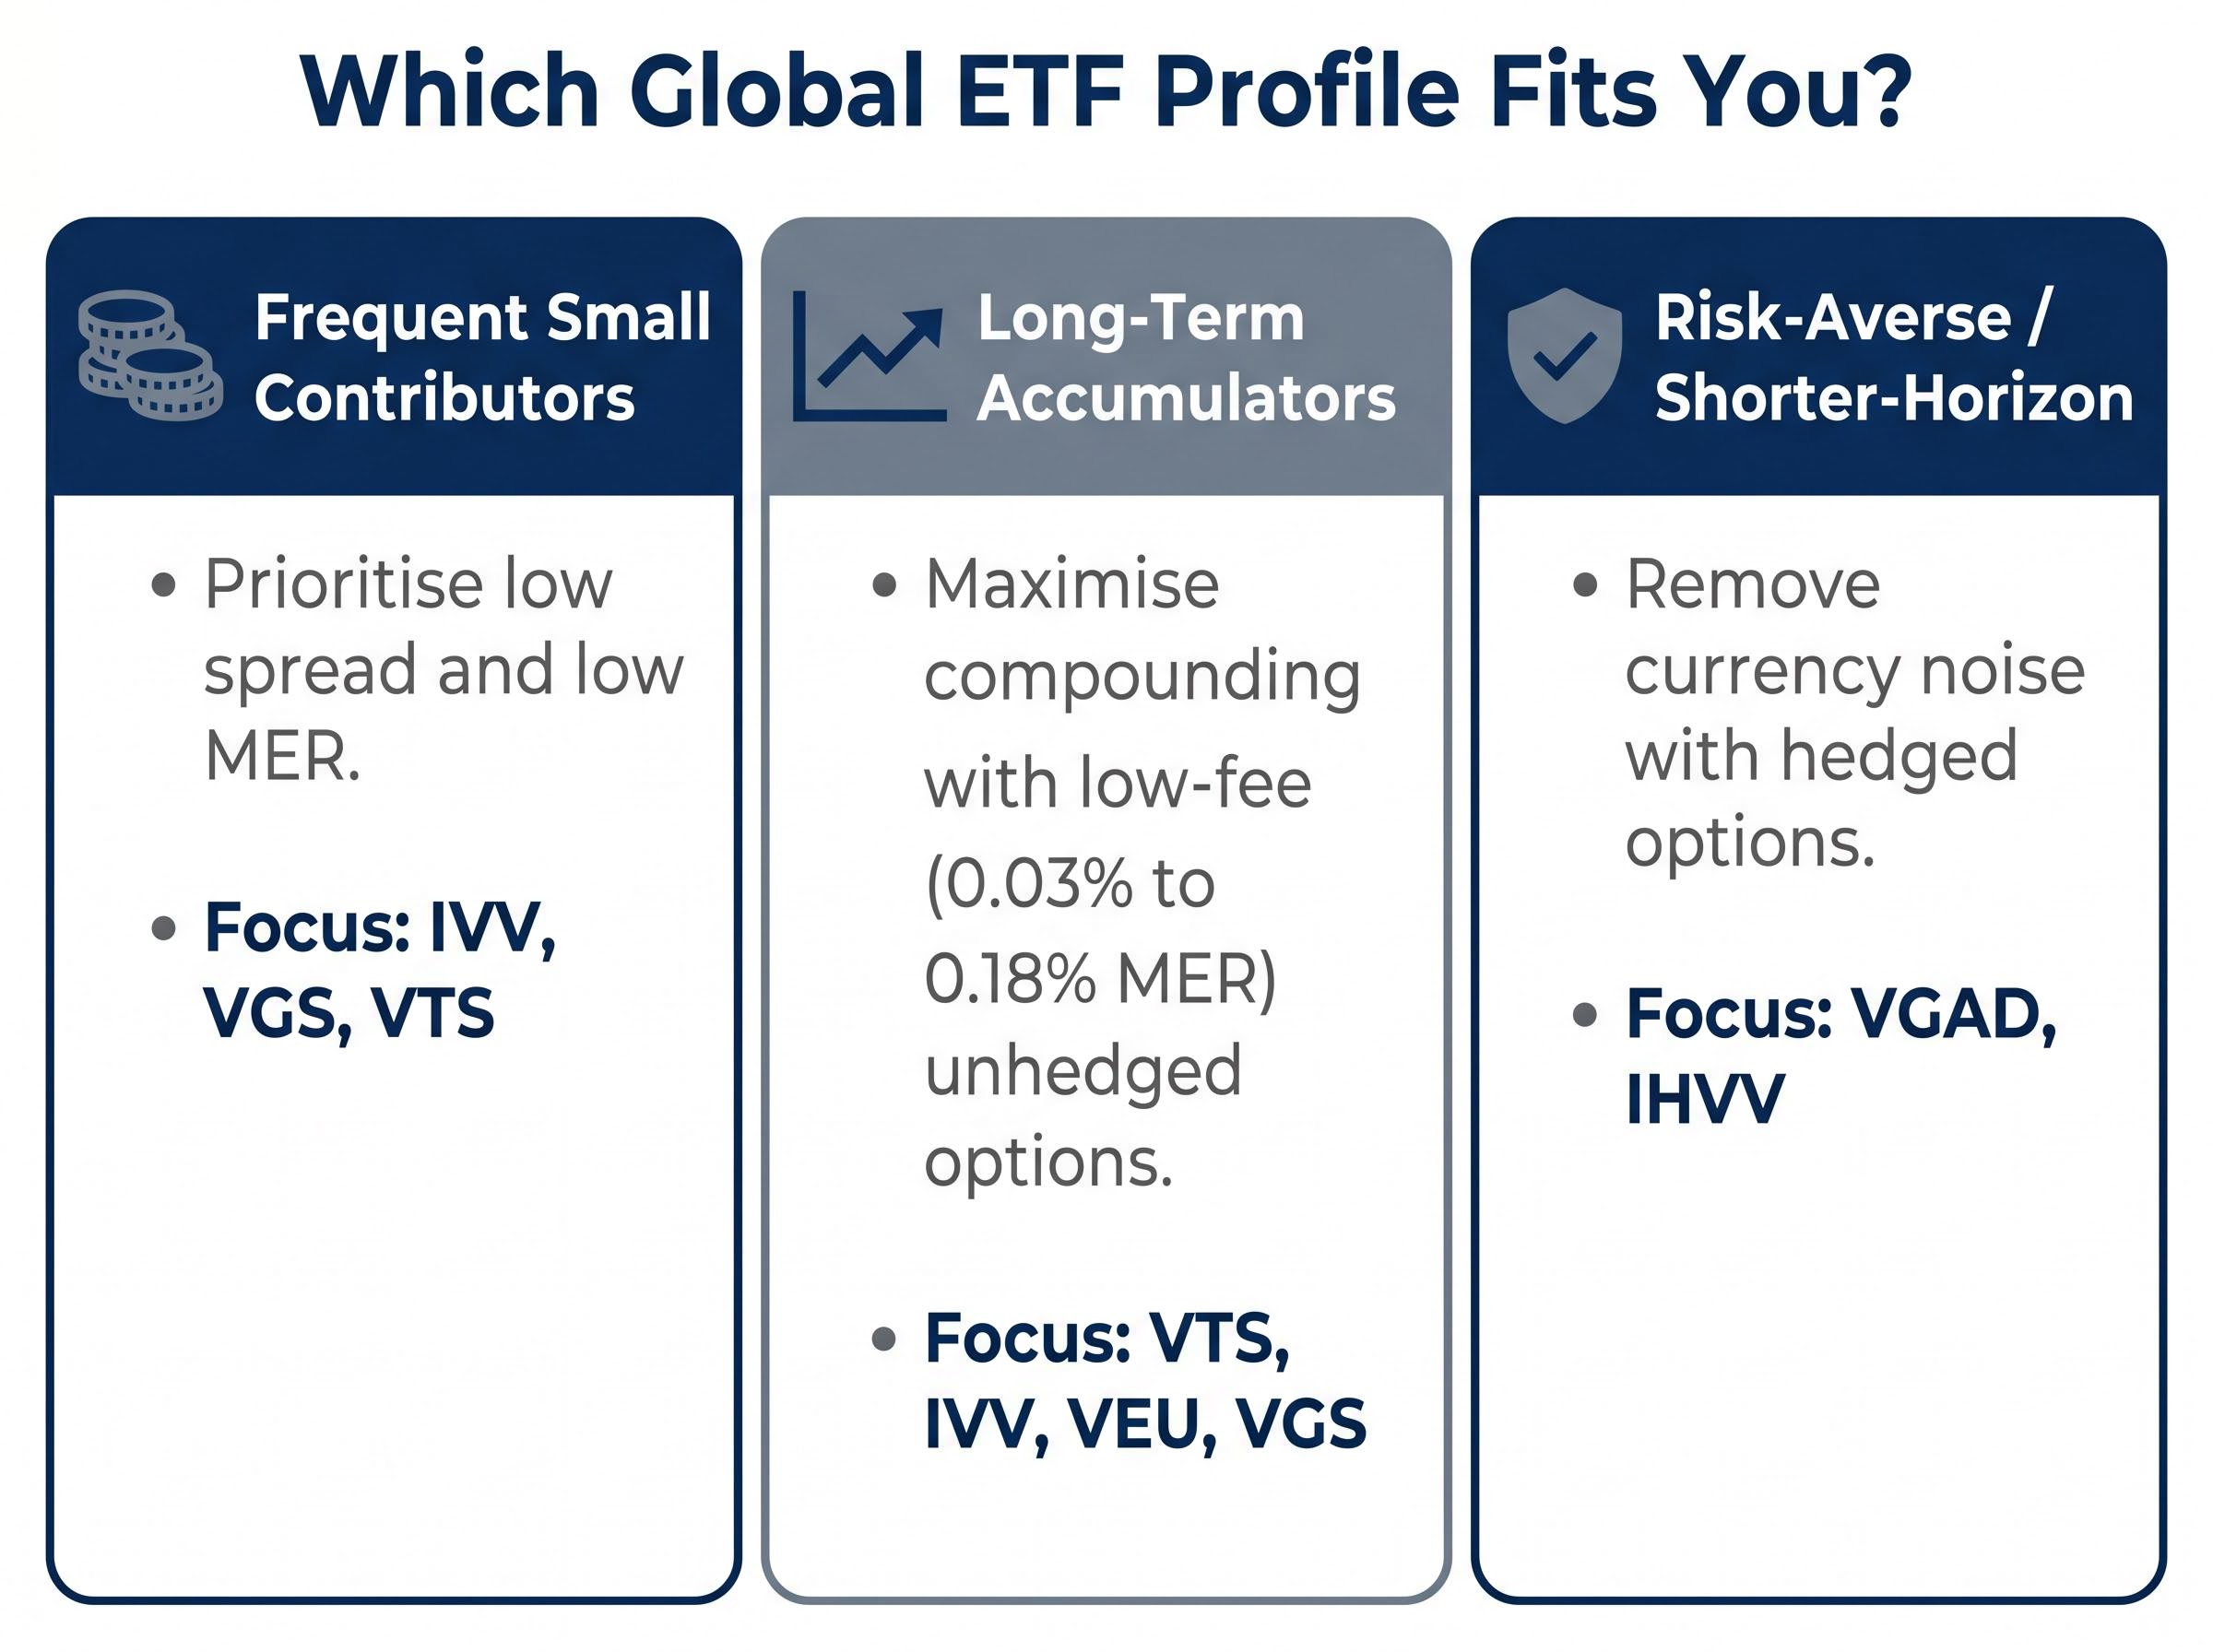
Over the review period, long-run AUD depreciation against the U.S. dollar made unhedged products more competitive, amplifying foreign returns when converted back to AUD. This relationship can reverse. Hedged products such as VGAD and IHVV suit risk-averse or shorter-horizon investors who want to isolate equity market returns from forex exposure. Unhedged products such as VGS and IVV suit long-term accumulators comfortable accepting currency volatility as part of total return.
How to match the five criteria to your own investment situation
The five criteria interact differently depending on how an investor uses the fund. A league table is informative; a personalised filter is actionable.
The decision breaks down into four steps:
- Determine contribution frequency and size. Investors making small monthly contributions face proportionally higher spread and brokerage costs per transaction. Consolidating contributions into fewer, larger purchases reduces this drag. For frequent contributors, low spread and low MER are the priority filters.
- Identify time horizon. Long-term accumulators (10 years or more) benefit most from the compounding advantage of low-fee passive products. The 0.03% to 0.18% MER tier, including VTS, IVV, VEU, and VGS, is designed for this profile.
- Decide on currency exposure preference. Hedged options (VGAD, IHVV) reduce currency uncertainty. Unhedged options (VGS, IVV) accept it as part of total return. The choice depends on the investor’s view of AUD direction and their tolerance for forex volatility.
- Check SMSF or tax obligations. Distributions from international share ETFs include foreign income on which overseas tax may have been withheld. The ATO released an updated Guide to Foreign Income Tax Offset Rules 2025 on 29 May 2025, confirming that investors may claim a foreign income tax offset (FITO) to reduce Australian tax liability on that income. The FITO cannot exceed the Australian tax that would otherwise apply to the foreign income. Franking credits do not apply to international ETF distributions.
The ATO’s Guide to Foreign Income Tax Offset Rules 2025 sets out the eligibility conditions, calculation method, and credit cap that apply when Australian investors receive foreign-sourced income, confirming that the offset cannot exceed the Australian tax that would otherwise apply to that income.
Different investor types should weight the criteria accordingly:
- Frequent small contributors: Prioritise low spread and low MER (IVV, VGS, VTS)
- SMSF trustees with lump-sum allocations: Prioritise AUM, liquidity, and FITO documentation
- Risk-averse or shorter-horizon investors: Consider hedged options (VGAD, IHVV) to remove currency noise
- Long-term accumulators: Maximise compounding by selecting the lowest-cost unhedged product that meets diversification needs
Brokerage represents a sixth consideration. For investors making small monthly contributions on platforms with flat brokerage fees, the brokerage cost as a percentage of each transaction can rival or exceed the ETF’s annual MER. Choosing a low-brokerage platform, or increasing transaction size, makes the total cost equation more favourable.
Investors building a globally diversified portfolio often combine an international fund from this peer group with one of the major domestic Australian share ETFs, where similar tensions between fee levels, index breadth, and liquidity play out across products tracking the ASX 200 and its variants.
The five criteria together: what the data says about each fund’s overall position
No single fund is optimal across every dimension simultaneously. The right choice depends on which criteria an investor weights most heavily.
| ETF Code | AUM | MER | Bid/Ask Spread | Avg Daily Value | 3-yr Return (p.a.) |
|---|---|---|---|---|---|
| VGS | $14.2B | 0.18% | 0.02% | $27.3M | 22.0% |
| IVV | $13.1B | 0.04% | 0.03% | $28.3M | 23.3% |
| VTS | $6.4B | 0.03% | 0.04% | $6.2M | 22.9% |
| MGOC | $6.4B | 1.35% | 0.35% | $4.2M | 17.5% |
| VGAD | $6.2B | 0.21% | 0.04% | $13.1M | 20.4% |
| IOO | $5.4B | 0.40% | 0.05% | $7.6M | 27.4% |
| VEU | $5.1B | 0.04% | 0.07% | $8.0M | 17.6% |
| IHVV | $3.2B | 0.10% | 0.06% | $6.1M | 21.1% |
| WXOZ | $0.7B | 0.07% | 0.17% | $0.4M | 22.7% |
| IHOO | $0.6B | 0.43% | 0.12% | $1.1M | 25.3% |
| WXHG | $0.4B | 0.10% | 0.19% | $0.4M | 20.7% |
| MHG | $0.1B | 1.35% | 0.45% | $0.1M | 15.2% |
IVV and VGS stand out on cost and liquidity combined. Both command the highest daily traded values, the tightest spreads, and competitive MERs. IOO is the consistent returns leader despite a higher MER of 0.40%; over the three-year period, its 4.7 percentage point per annum margin over WXOZ more than compensated for the fee premium. That relationship is not guaranteed to persist.
MGOC and MHG sit at the other end of the spectrum. Their 1.35% MER, combined with the widest spreads in the peer group, resulted in approximately 5% of cumulative costs against a 17.5% net return for MGOC over three years.
The cheapest fund is not always the best-performing fund, and the best-performing fund is not always the most cost-efficient. The right choice depends on which trade-off the investor is willing to make.
Vanguard’s decision to cut VEU’s fee from 0.07% to 0.04% in 2025 illustrates the competitive pressure that continues to drive costs lower. Investors who understand the five criteria will be positioned to evaluate fee changes and new product launches as they emerge.
Five criteria, one decision: making the comparison work for your portfolio
Choosing a global share ETF is not a single-variable problem. The five criteria, fund size, management costs, bid/ask spreads, liquidity, and returns, interact. The right weighting depends on contribution frequency, time horizon, tax situation, and tolerance for currency risk.
Passive index products dominate on cost and spread. The performance leaders carry meaningful U.S. concentration risk that has rewarded investors over the past five years but may not do so in every market environment. Hedged options suit risk-averse investors or those with shorter time horizons. SMSF trustees carry additional obligations at the foreign income layer, particularly around FITO documentation and the absence of franking credits on international distributions.
With the Australian ETF market at $330.6 billion and growing, the competitive pressure among providers will continue to produce fee reductions and new product launches. Investors who have worked through the five-criteria framework are well-positioned to evaluate whatever comes next, rather than defaulting to headline returns or brand familiarity.
Investors wanting to see how these allocation decisions play out at a portfolio level across Australian demographics will find our deep-dive into Australian ETF portfolio trends, which draws on 2026 platform data to show how Millennials, Gen X, and SMSF trustees are weighting international versus domestic exposure and how reactive trading behaviour interacts with long-term accumulation strategies.
Reviewing current global ETF holdings against these five criteria is a practical starting point. For SMSF trustees whose investment strategy documentation does not yet reflect international ETF holdings and their associated risks, consulting a financial adviser may be warranted.
This article is for informational purposes only and should not be considered financial advice. Investors should conduct their own research and consult with financial professionals before making investment decisions. Past performance does not guarantee future results.