How Australia Is Regulating Financial Market Innovation
3 hrs ago
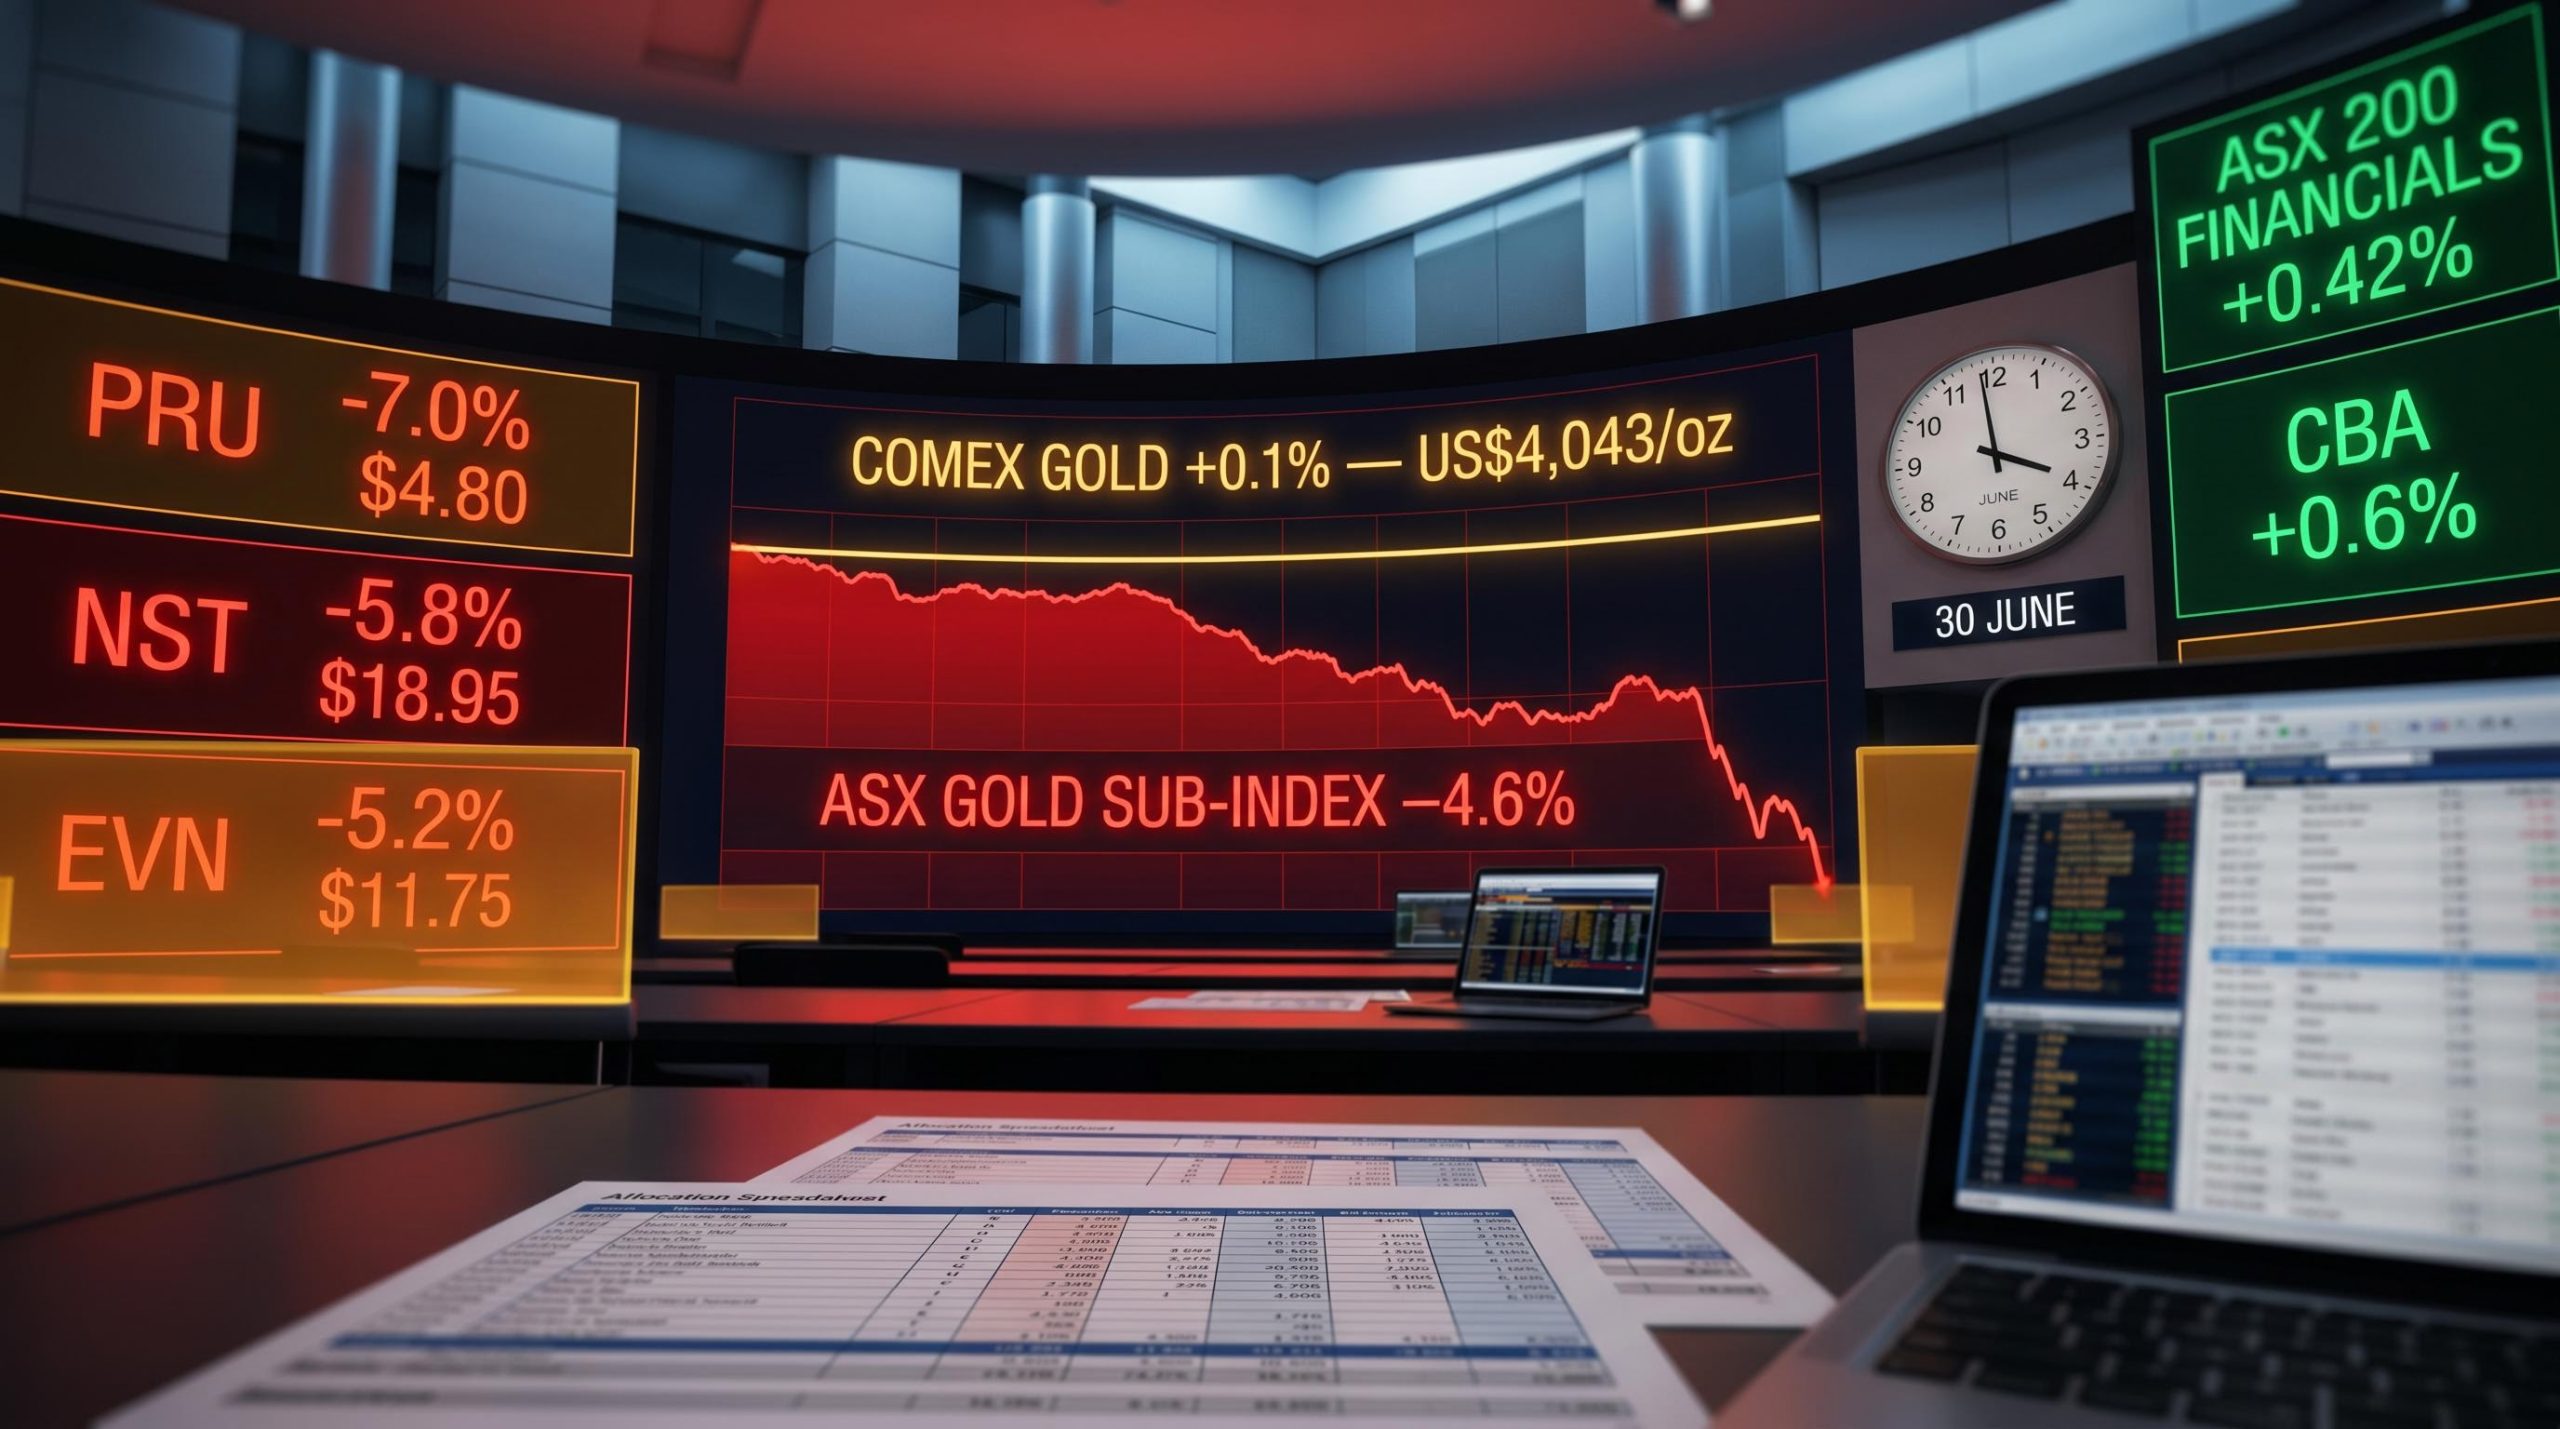
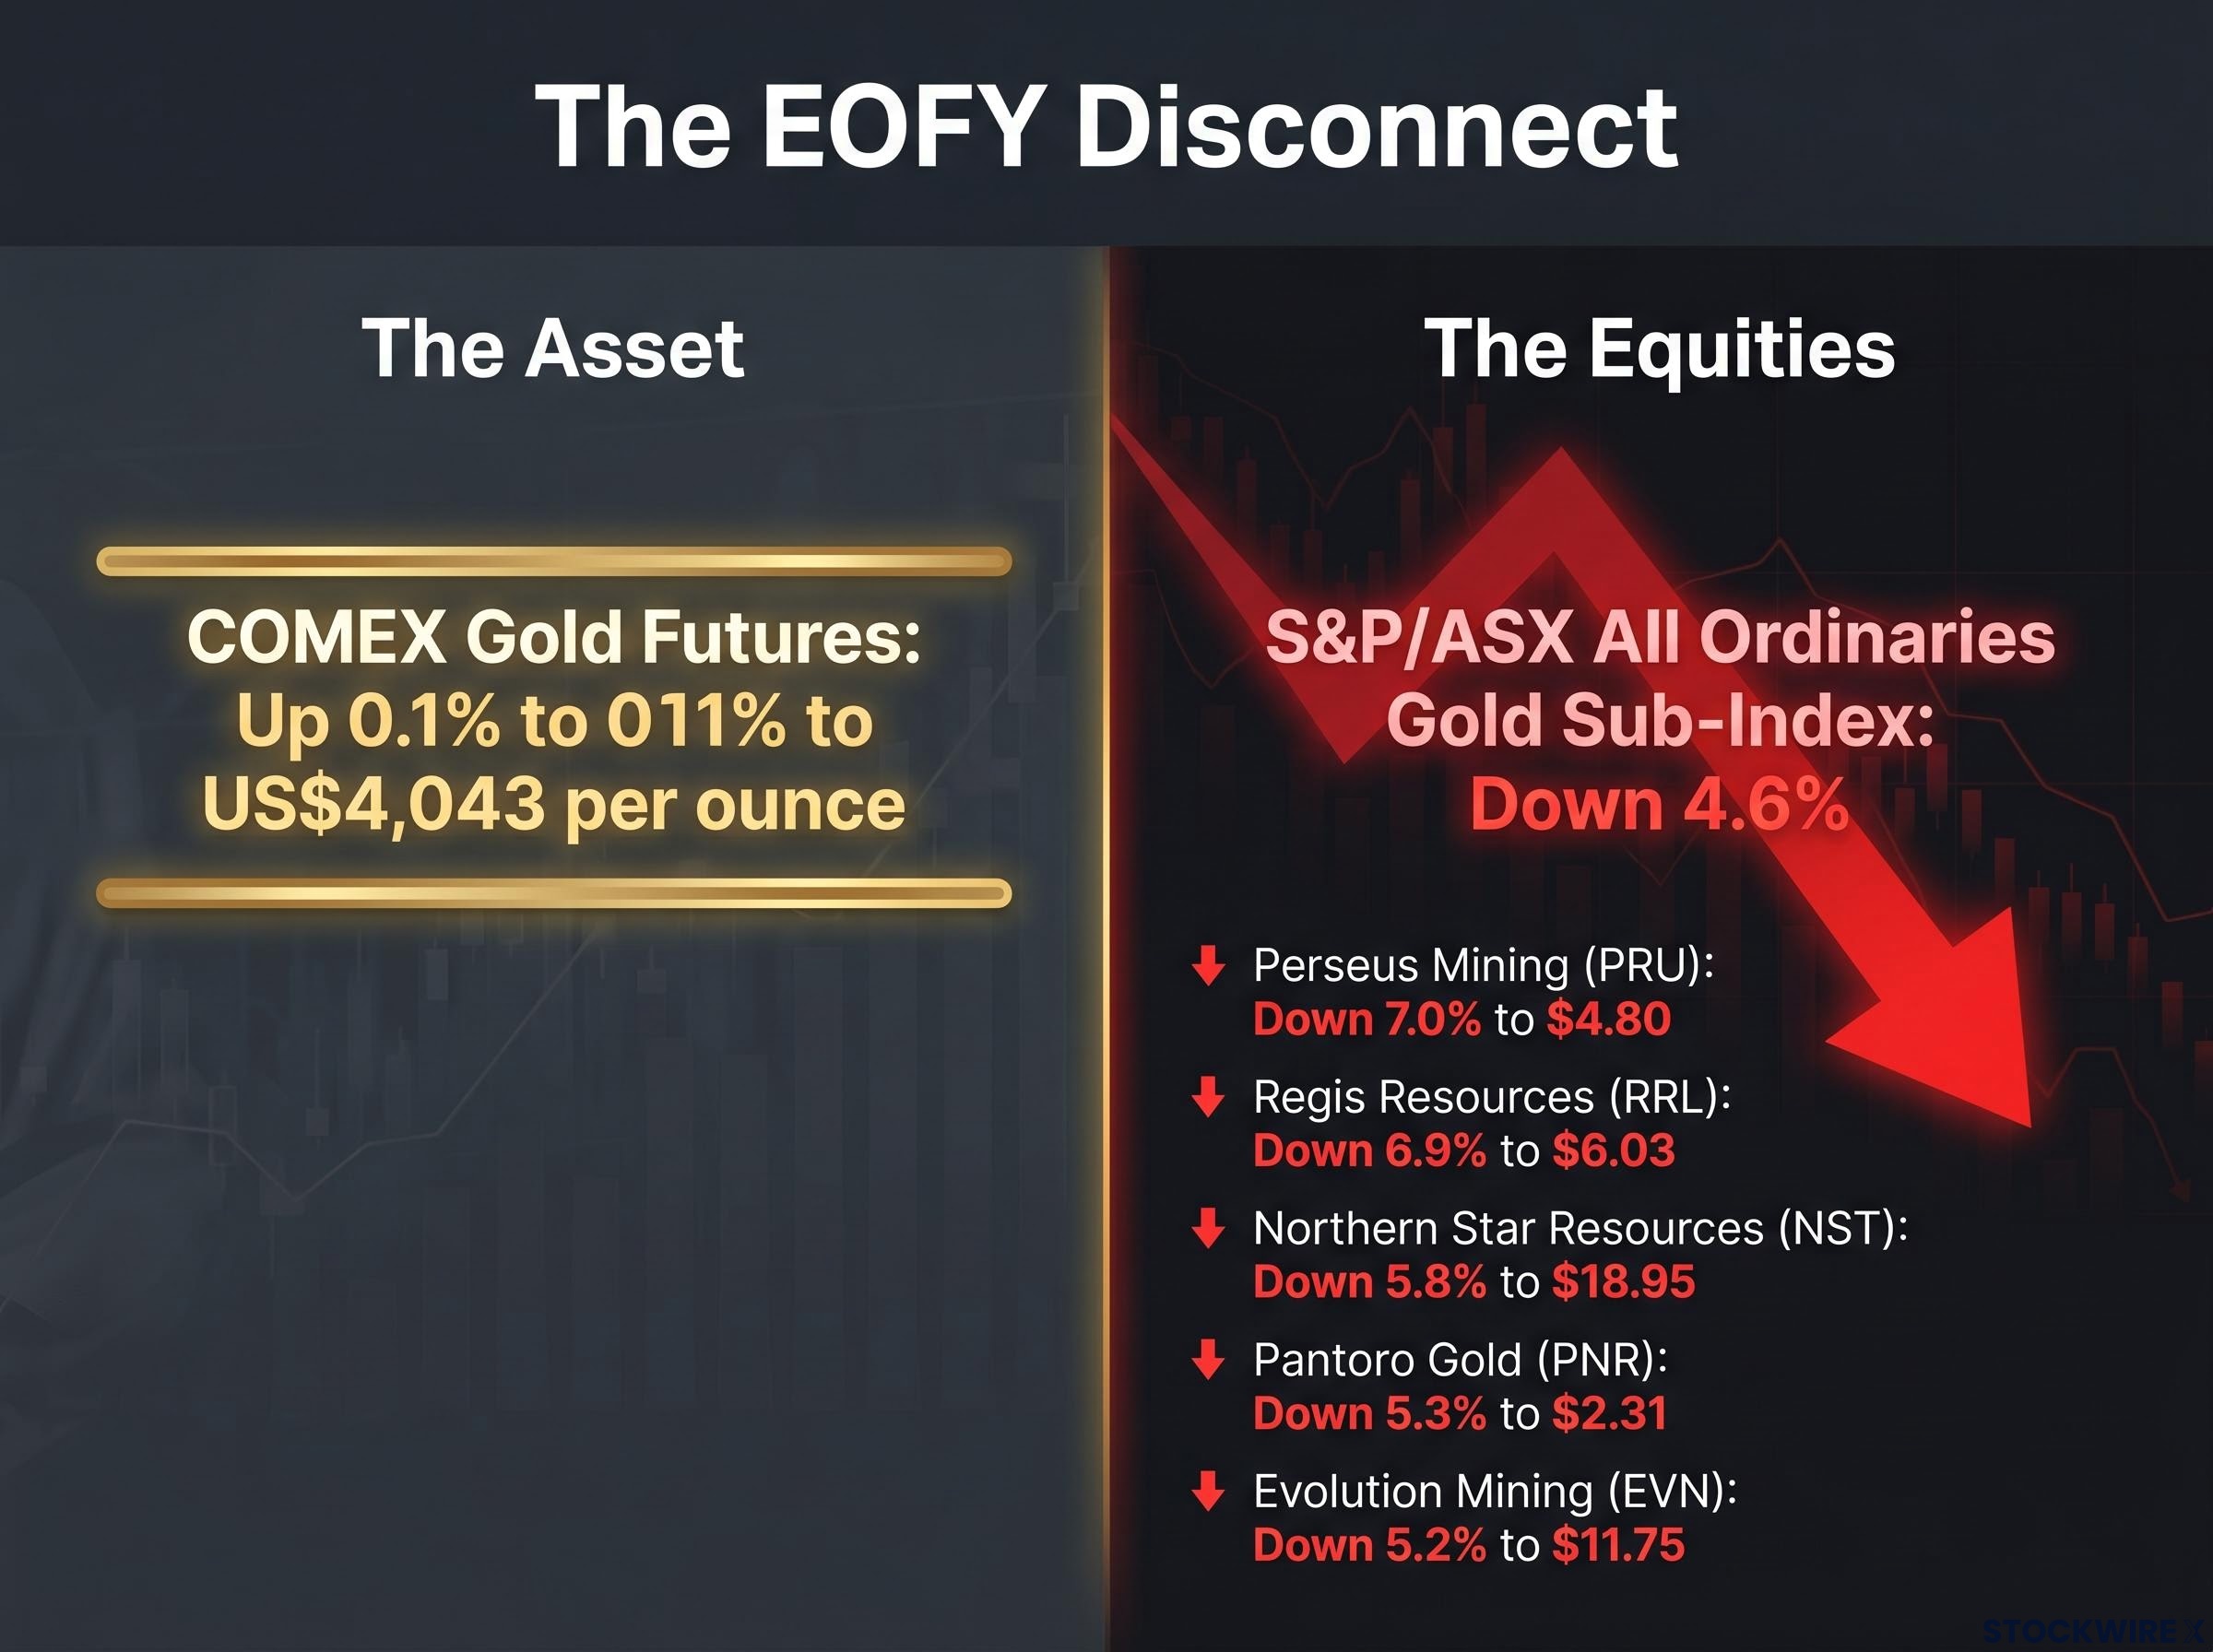
Gold futures sat flat above US$4,043 per ounce on the final afternoon of the financial year. At the same time, ASX-listed gold stocks were falling 5% to 7%. No company announcements. No commodity move. No news of any kind. Just price action that looked, on its face, completely irrational.
This kind of disconnect happens every year around 30 June, and it is driven not by new information but by institutional portfolio mechanics. Large funds rebalancing their sector weights at financial year-end create concentrated selling in whichever sectors ran hardest during the year. Retail investors routinely misread these moves as fundamental signals. They are not.
Here is a framework for recognising when price action is driven by fund flows rather than fundamentals, what the diagnostic signals look like in real time, and what to do (and not do) when you see them. The pattern that played out today will repeat, in different sectors, on 30 June 2027. Understanding the mechanism is worth more than any single stock tip.
The S&P/ASX 200 ended the session 44.7 points lower, settling at 8,778.7, a fall of 0.51%. The All Ordinaries fell 0.45% to 8,986.2. Across the broader S&P/ASX 300, 164 stocks declined against 116 advancers.
The closing price matched the session low, with selling pressure building through the afternoon rather than tapering off. That detail matters, and the next section explains why.
Here is how the session broke down:
| Sector | Move | Closing Level / Index |
|---|---|---|
| Gold Sub-Index | Down 4.6% | — |
| Real Estate | Down 2.22% | — |
| Materials | Down 1.61% | — |
| Financials | Up 0.42% | — |
| S&P/ASX 200 | Down 0.51% | 8,778.7 |
COMEX gold futures closed broadly flat, gaining just 0.1% to US$4,043 per ounce. ASX gold stocks fell 4.6%. No new information arrived between those two prices.
When the underlying asset is flat and the equity is down 4-6%, the move is almost certainly not about the asset. It is about who is selling and why, which is exactly what the rest of this article unpacks.
For full-year context, the ASX 200 gained approximately 6.1% across FY26, its weakest annual return since FY22.
You have probably heard both terms used loosely around 30 June. They describe different things, and confusing them leads you to misread the price signal entirely.
The selling on 30 June 2026 was rebalancing, not window dressing. The key evidence: the selling was concentrated in the year’s strongest performers (gold, real estate), not its weakest. Window dressing predicts the opposite pattern; you sell the ugly stocks to hide them from the report. Here, the winners were being trimmed.
The obligation funds face today is the same one individual investors encounter after a strong equity run: portfolio rebalancing mechanics require selling what has grown above its target weight and buying what has fallen below it, regardless of whether the manager or investor has any new view on the underlying asset.
Institutional funds manage against target sector weights: for example, 8% in gold, 15% in banks. When a sector outperforms through the year, its weight in the portfolio rises above target automatically, without the manager doing anything.
Restoring the target weight requires selling the outperformer. Not because the manager has turned bearish, but because the allocation mandate requires it.
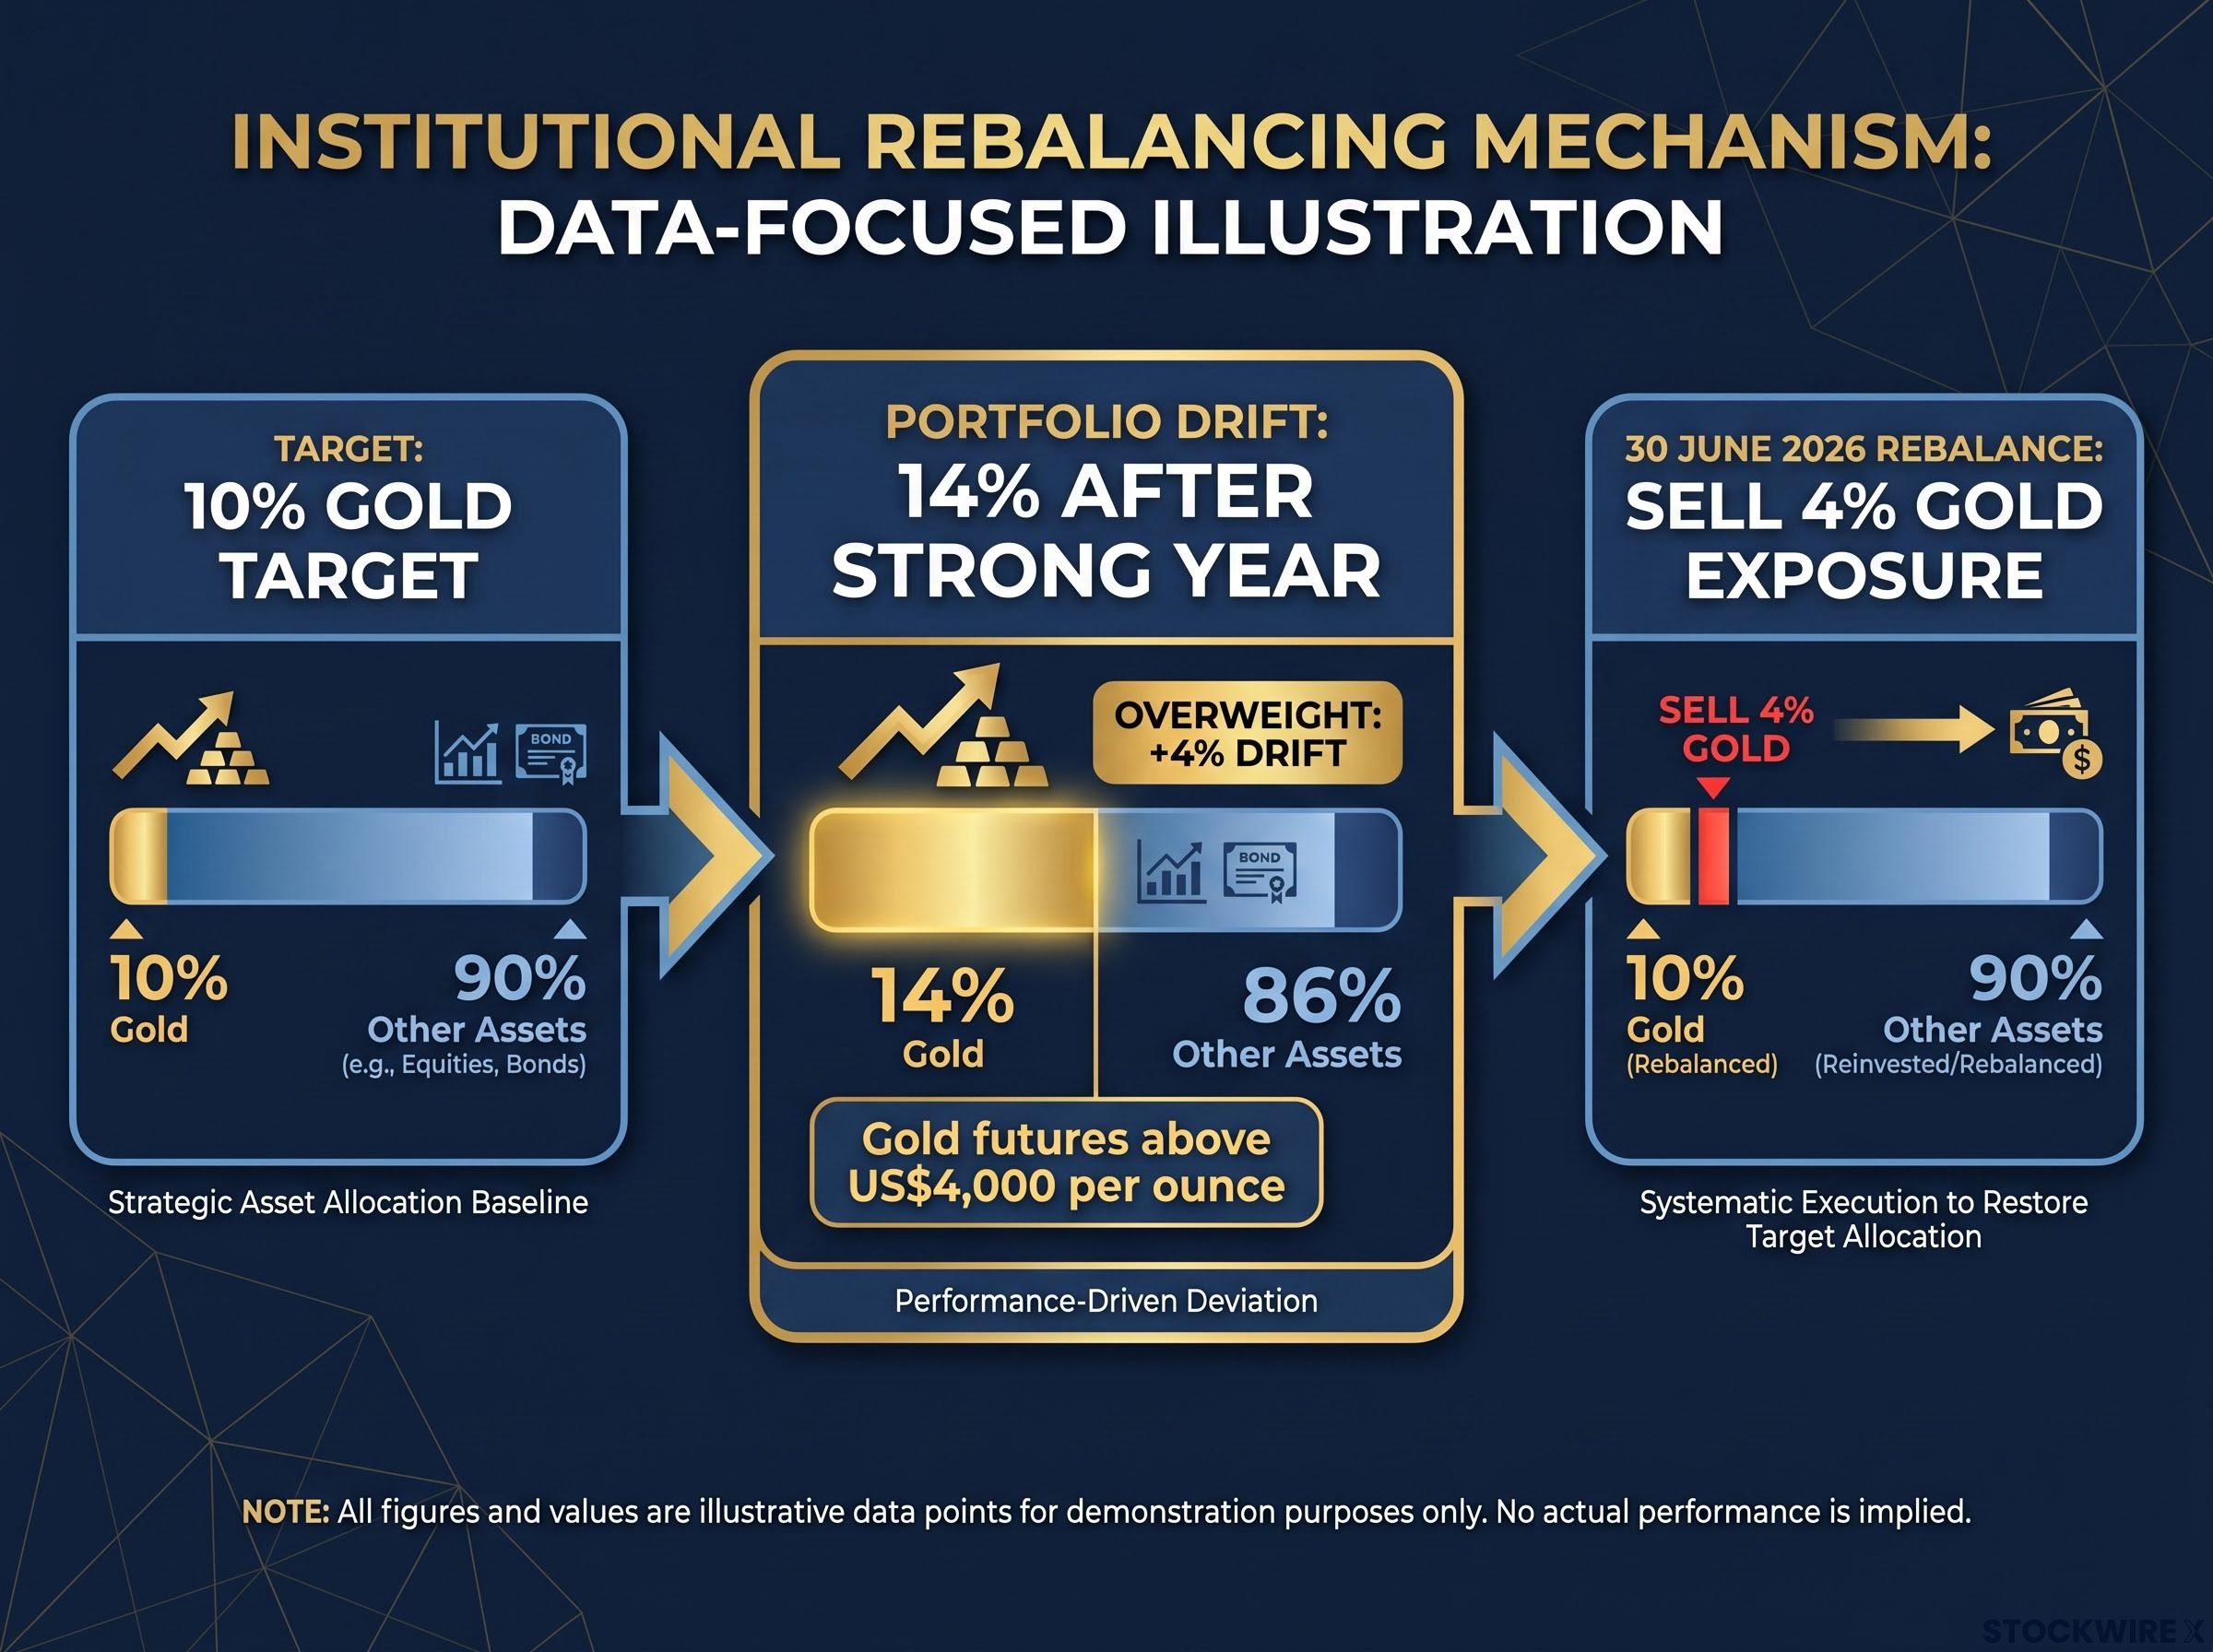
A simple example makes this concrete. A fund with a 10% gold target that is now sitting at 14% after a strong gold year must sell 4% of its gold exposure to return to mandate, regardless of today’s gold price. The sell order is an accounting adjustment, not an analytical judgment, and that changes how you should interpret the price signal entirely.
The individual movers tell the story more clearly than any index number. Look at the gold sector first:
| Stock | Ticker | Move |
|---|---|---|
| Perseus Mining | PRU | Down 7.0% to $4.80 |
| Regis Resources | RRL | Down 6.9% to $6.03 |
| Northern Star Resources | NST | Down 5.8% to $18.95 |
| Pantoro Gold | PNR | Down 5.3% to $2.31 |
| Evolution Mining | EVN | Down 5.2% to $11.75 |
| Goodman Group | GMG | Down 3.0% |
| Mirvac | MGR | Down 2.6% |
| Dexus | DXS | Down 2.2% |
| Stockland | SGP | Down 2.2% |
Now look at where the capital landed:
| Stock | Ticker | Move |
|---|---|---|
| Zip Co | ZIP | Up 3.5% to $3.24 |
| Washington H. Soul Pattinson | SOL | Up 1.1% |
| Commonwealth Bank | CBA | Up 0.6% |
| ANZ | ANZ | Up 0.4% |
The S&P/ASX 200 Financials sector rose 0.42%. CBA carried a full-year loss of roughly 11% heading into today’s session, leaving the major banks meaningfully underweight in institutional portfolios and the natural destination for rebalancing flows.
Five gold stocks from different companies, different balance sheets, different geographies: all down 5-7% in the same afternoon, with gold futures flat.
When five gold stocks with different operational profiles, different cost structures, and different mine locations all fall in the same narrow range on the same afternoon with no news, only one explanation is coherent: the selling is coming from the same source, for the same non-fundamental reason. The real estate pattern, with Goodman, Mirvac, Dexus, and Stockland all falling 2-3% without any identified fundamental catalyst, tells the identical story.
This is the section where the pattern shifts from “something unusual happened” to “I understand why this happens every year.” The mechanism is simpler than it looks.
Large superannuation funds, managed funds, and ETFs operate against strategic asset allocation targets. These are set weights for each sector or asset class: a fund might target 10% in gold equities, 20% in banks, 15% in real estate, and so on. The targets are part of the fund’s mandate, agreed with trustees and regulators.
Portfolio drift happens during the year without anyone making a decision. When gold stocks outperform, their share of the total portfolio rises above the target weight automatically. By 30 June 2026, with gold futures above US$4,000 per ounce, institutional gold holdings had ballooned well above target. Conversely, the banks had underperformed, with CBA down roughly 11% for the year, meaning bank weights had drifted below target.
The fund’s mandate requires correcting both drifts. Sell the overweight sector. Buy the underweight sector.
Rules-based fund mandates, including the position concentration caps under investment company regulations that prevent funds from exceeding set weights in any single name, are the structural reason institutional sell orders are non-discretionary: the manager is not expressing a view, the mandate is executing itself.
The question you are probably asking is: why does all of this land in one concentrated burst?
Institutional execution of rebalancing trades is typically timed to the close of the last trading day of the financial year. The reason is straightforward: a fund’s holdings are valued at the closing price for annual reporting purposes. Executing at or near the close ensures the rebalanced portfolio is reported at the year-end price, satisfying governance and compliance requirements.
A substantial sell order emerged in the final hour of today’s session, consistent with this pattern. The fact that the session low was also the closing level confirms that selling pressure built toward the close rather than fading.
This concentration is itself a diagnostic signal for you. A sharp move at 3:45 pm on 30 June carries a fundamentally different interpretation than the same move at 10:30 am in mid-April. The timing tells you who is selling, and why.
Knowing the mechanism is useful. Having a practical checklist you can run in real time is more useful. Here are six diagnostic signals, ordered from the easiest to check to the most analytical:
Institutional selling on 30 June is frequently rules-based and non-discretionary. It reflects portfolio mechanics, not an analyst’s fresh assessment of a stock.
Take Perseus Mining (PRU) as the worked example. PRU fell 7% to $4.80 on 30 June with gold futures flat and no company announcements.
Your diagnostic process: check the ASX Announcements page for PRU, confirming no news. Check COMEX gold futures and silver prices, confirming both are flat or up. Check whether the broader gold sub-index is moving uniformly (it is, down 4.6%). Assess whether your long-term thesis for the stock has changed (it has not, because no new information arrived).
The appropriate conclusion may be to hold, or to consider scaling in gradually if your thesis remains intact. What you should not do is treat a mechanical EOFY move as a signal to panic-sell a fundamentally unchanged business. Rebalancing-driven dips are temporary mispricings in otherwise sound businesses, not permanent verdicts.
The discipline of investing during a price dislocation starts before you open a price chart: confirming your income is stable, your portfolio is not already concentrated in the affected sector, and your time horizon is long enough to absorb further short-term moves are all prerequisites to any capital deployment decision.
This article is for informational purposes only and should not be considered financial advice. Investors should conduct their own research and consult with financial professionals before making investment decisions.
EOFY rebalancing is a structural, recurring feature of Australian equity markets. It is not a one-off event unique to FY26. The sectors involved change every year based on that year’s performance leaders and laggards, but the mechanism is constant:
In FY26, gold and real estate were the winners that got trimmed. Banks were the laggards that received the flows. In a year where technology leads and energy lags, the rebalancing flows would land in completely different sectors. The sectors rotate; the pattern does not.
Over FY26, the ASX 200 returned approximately 6.1%, its softest full-year result since FY22. That full-year backdrop shaped which sectors drifted furthest from target, and therefore which sectors bore the heaviest rebalancing pressure today.
Knowing this pattern repeats gives you something more durable than a trade idea. It gives you a structural understanding of how markets behave at a specific calendar date every year. On 30 June 2027, different sectors will move sharply in the final hour with no news. You will now recognise the pattern, run the diagnostic, and respond with clarity rather than confusion.
For readers wanting to build a framework that reduces the impact of sector drift before it reaches rebalancing thresholds, our comprehensive walkthrough of portfolio drift and allocation targets covers how to set dynamic weighting bands and match asset class exposure to different economic regimes rather than fixed percentage targets.
The calendar is a market participant. Today, it was rebalancing.
—
ASX EOFY rebalancing is the process by which large institutional funds sell overweight sectors and buy underweight ones at 30 June to restore their mandated target allocations. It is a mechanical, rules-based obligation, not an analytical judgment about the stocks being sold.
Gold stocks fell 4.6% to 7% on 30 June 2026 because institutional funds were trimming overweight gold positions to meet year-end rebalancing obligations, not because of any new information about gold or the companies involved. COMEX gold futures actually gained 0.1% on the same session.
Window dressing is cosmetic: managers dump underperformers before a reporting date to make the portfolio look better on paper. Rebalancing is structural: it restores sector weights to mandated targets by selling the year's outperformers and buying its laggards, regardless of any new view on those assets.
Six signals point to rebalancing: the move is concentrated in the final trading hour of 30 June, the underlying commodity is flat or rising while the equities fall, there are no company announcements, the sector was a strong performer during the year, multiple stocks in the sector fall by similar amounts simultaneously, and the year's laggards are rising at the same time.
The S&P/ASX All Ordinaries Gold Sub-Index fell 4.6%, the S&P/ASX 200 Real Estate sector fell 2.22%, and Materials fell 1.61%, while Financials rose 0.42% as rebalancing flows rotated capital into underweight bank stocks including CBA and ANZ.