
A defined-risk vertical spread feels like a small, contained bet. Yet on one platform snapshot, the same call spread on the same stock, at the same strikes and the same share price, carried about 8 shares of exposure with 59 days left and about 55 shares with one day left. That jump is what vertical spread delta measures, and it often surprises traders who assumed their risk was fixed.
The timing matters more than it used to. Contracts expiring within 30 days made up 75.8% of U.S. options volume in 2025, and zero-days-to-expiration (0DTE) contracts averaged 14 million a day, according to Traders Magazine. A zero-days-to-expiration contract is one that expires on the day it trades.
That means late-life delta behaviour is now part of everyday trading for a large share of the market.
After reading this, you will be able to work out a vertical’s net delta yourself, explain why it climbs as expiration nears, and decide where that exposure stops feeling comfortable.
What does delta actually tell you about an option?
Every options trader eventually asks the same question: if the stock rises $1, how much does my option move?
Delta is the answer. It is a theoretical estimate of how much an option’s premium should change for a $1 move in the underlying stock, with everything else held constant. The Options Industry Council (OIC) and Charles Schwab both use the same illustration: a delta of 0.40 suggests about a $0.40 premium change for each $1 rise.
The ranges are simple:
- Long calls: delta between 0 and +1.00
- Long puts: delta between 0 and -1.00
- Deep in-the-money options: delta near +1 for calls or -1 for puts
- Far out-of-the-money options: delta near 0
Delta also tells you how many shares your position behaves like. A standard contract covers 100 shares, so you multiply delta by 100.
Delta also works as a measure of stock-equivalent exposure, so you can read your position as a number of shares rather than an abstract Greek, and see how moneyness and time reshape that figure.
Rule of thumb A 0.40 delta call behaves roughly like 40 shares of stock per contract, at that moment.
You can see these values on a real platform. In one presenter’s demonstration, with the stock near 341, the 220 calls showed about 0.97 delta. The one-day 280 calls read about 1.0, and the 400 puts about -1. Fidelity notes that at expiration, a call’s delta heads to either 0 or 1 and a put’s to 0 or -1.
The phrase “at that moment” matters. Delta depends on implied volatility, interest rates, dividends and time remaining, so it changes constantly. Implied volatility is the market’s estimate of how much a stock is likely to move, built into option prices. Treat delta as a live gauge of your directional exposure, not a fixed label on the trade.
Delta as a probability proxy, and why to be cautious with it
Schwab also describes delta as an approximate chance that an option expires in the money. A 0.40 delta suggests roughly a 40% chance.
That reading is useful but rough. Pricing models use risk-neutral assumptions, which means they calculate odds as if investors were indifferent to risk. Volatility skew (different implied volatilities across strikes), rates and dividends all push the number away from real-world odds, so you should treat it as a proxy rather than a forecast.
When big ASX news breaks, our subscribers know first
How do you calculate the net delta of a vertical spread?
Once you think of delta as shares, the spread maths follows directly.
A vertical spread pairs a long option with a short option on the same stock and expiration but at different strikes. A long call vertical buys the lower-strike call and sells the higher one. A long put vertical buys the higher-strike put and sells the lower one.
The calculation takes three steps:
- Find the delta of each leg.
- Subtract the short leg’s delta from the long leg’s delta, or add each leg’s signed delta.
- Multiply by 100 to get share-equivalents per contract.
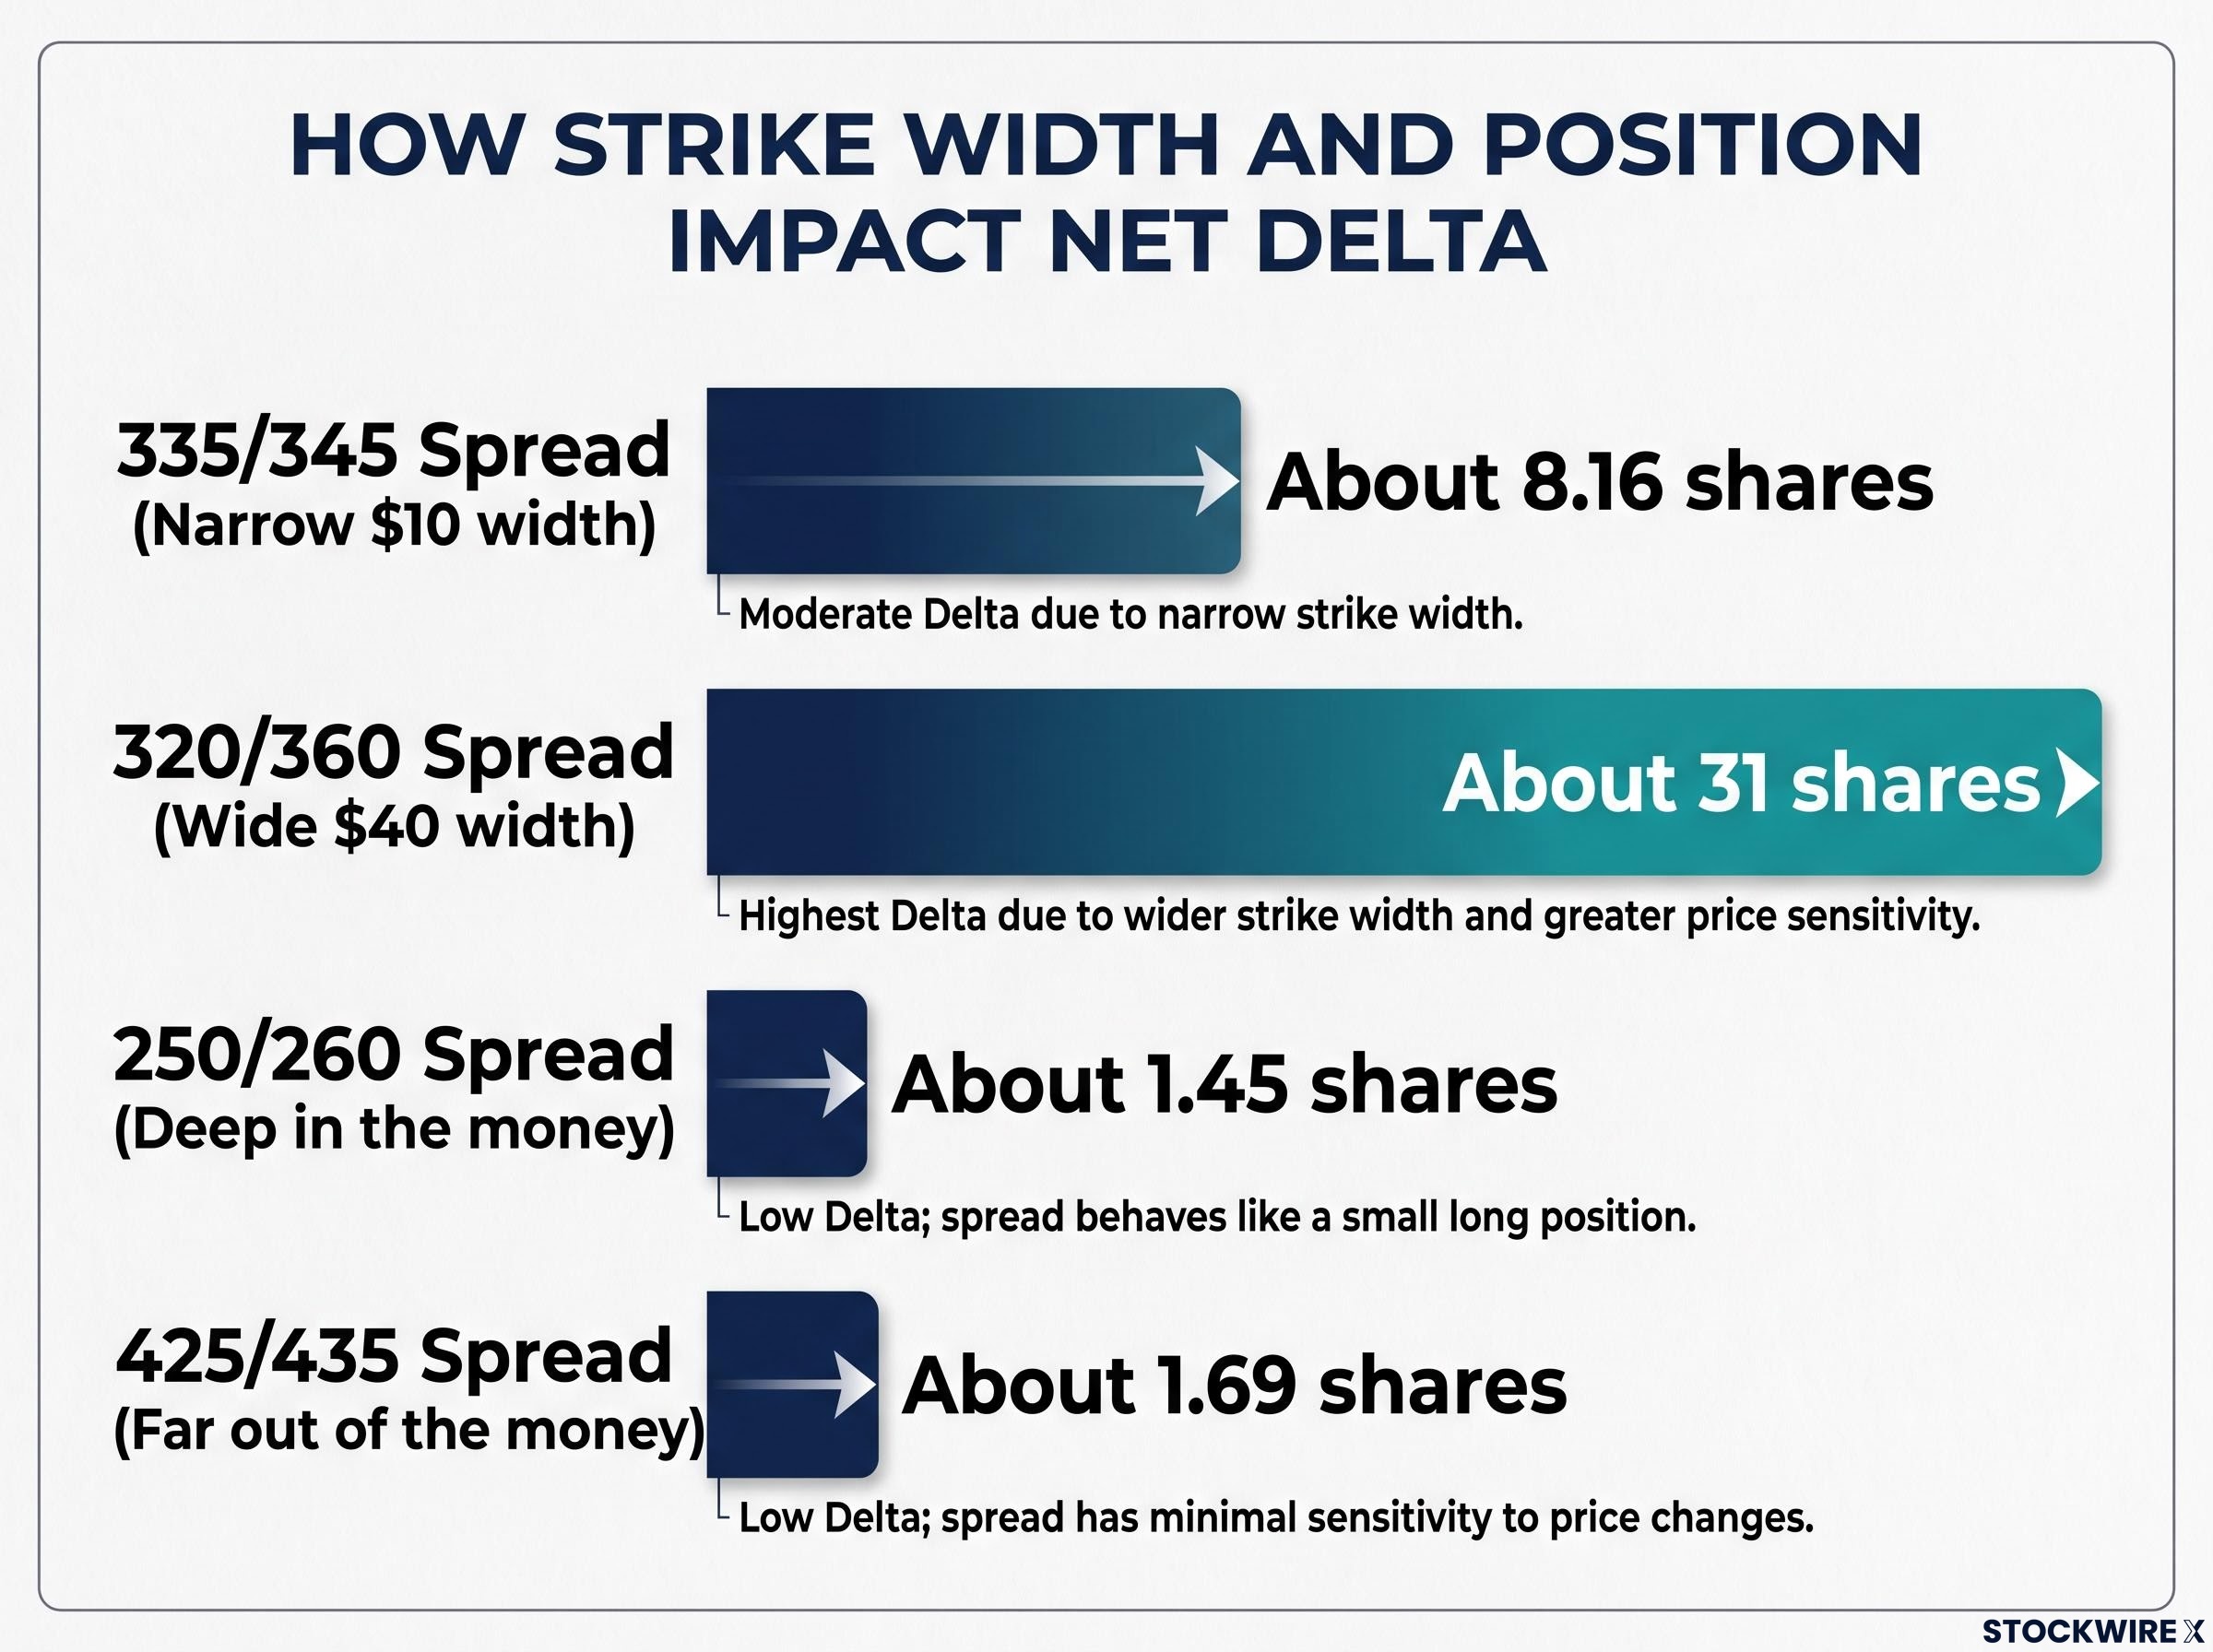
Take a 335/345 call spread with 59 days left. The platform reported a net delta of about 0.08, or 8.16 shares. The presenter’s on-screen leg readings were rounded to about 0.48 and 0.49. That rounding is too coarse to reproduce the net figure by subtraction, so the platform’s net number is the one to rely on.
A cleaner example is the 320/360 spread. The 320 call sat near 0.69 and the 360 call near 0.37. The difference is about 0.32, and the platform showed roughly 31 shares.
Schwab gives a third example: a short 135 / long 137 call vertical with deltas of 0.22 and 0.11. Fidelity notes that a bull call spread carries positive net delta and near-zero gamma when price and time stay unchanged.
| Spread | Long leg delta | Short leg delta | Net delta (share-equivalent) | Why it differs |
|---|---|---|---|---|
| 335/345 | About 0.48 (rounded) | About 0.49 (rounded) | About 8.16 | Narrow $10 width, strikes close together |
| 320/360 | About 0.69 | About 0.37 | About 31 | Wide $40 width, stock between strikes |
| 250/260 | Not reported | Not reported | About 1.45 | Both strikes deep in the money |
| 425/435 | Not reported | Not reported | About 1.69 | Both strikes far out of the money |
How strike width and stock position change the answer
Wider strikes produce a bigger gap between the two leg deltas, so net delta grows. Net delta peaks when the stock sits between the strikes.
When both strikes are deep in the money, both legs sit near 1 and cancel out. When both are far out of the money, both sit near 0. Either way, the spread barely moves with the stock, which is why the 250/260 and 425/435 spreads show under 2 shares each.
With that pattern in mind, you can estimate a spread’s delta by eye before you open your platform.
Why does spread delta rise as expiration approaches?
Now hold everything constant except the calendar. Keep the same 335/345 spread and the same stock price, and simply let the days pass.
| Days to expiration | Spread delta (share-equivalent) |
|---|---|
| 59 | About 8 |
| 38 | About 10 |
| 24 | About 11.6 |
| 15 | About 13 |
| 10 | About 14 |
| 3 | About 34 |
| 1 | About 55 |
For seven weeks, the number barely moves. Then the final days arrive and it surges.
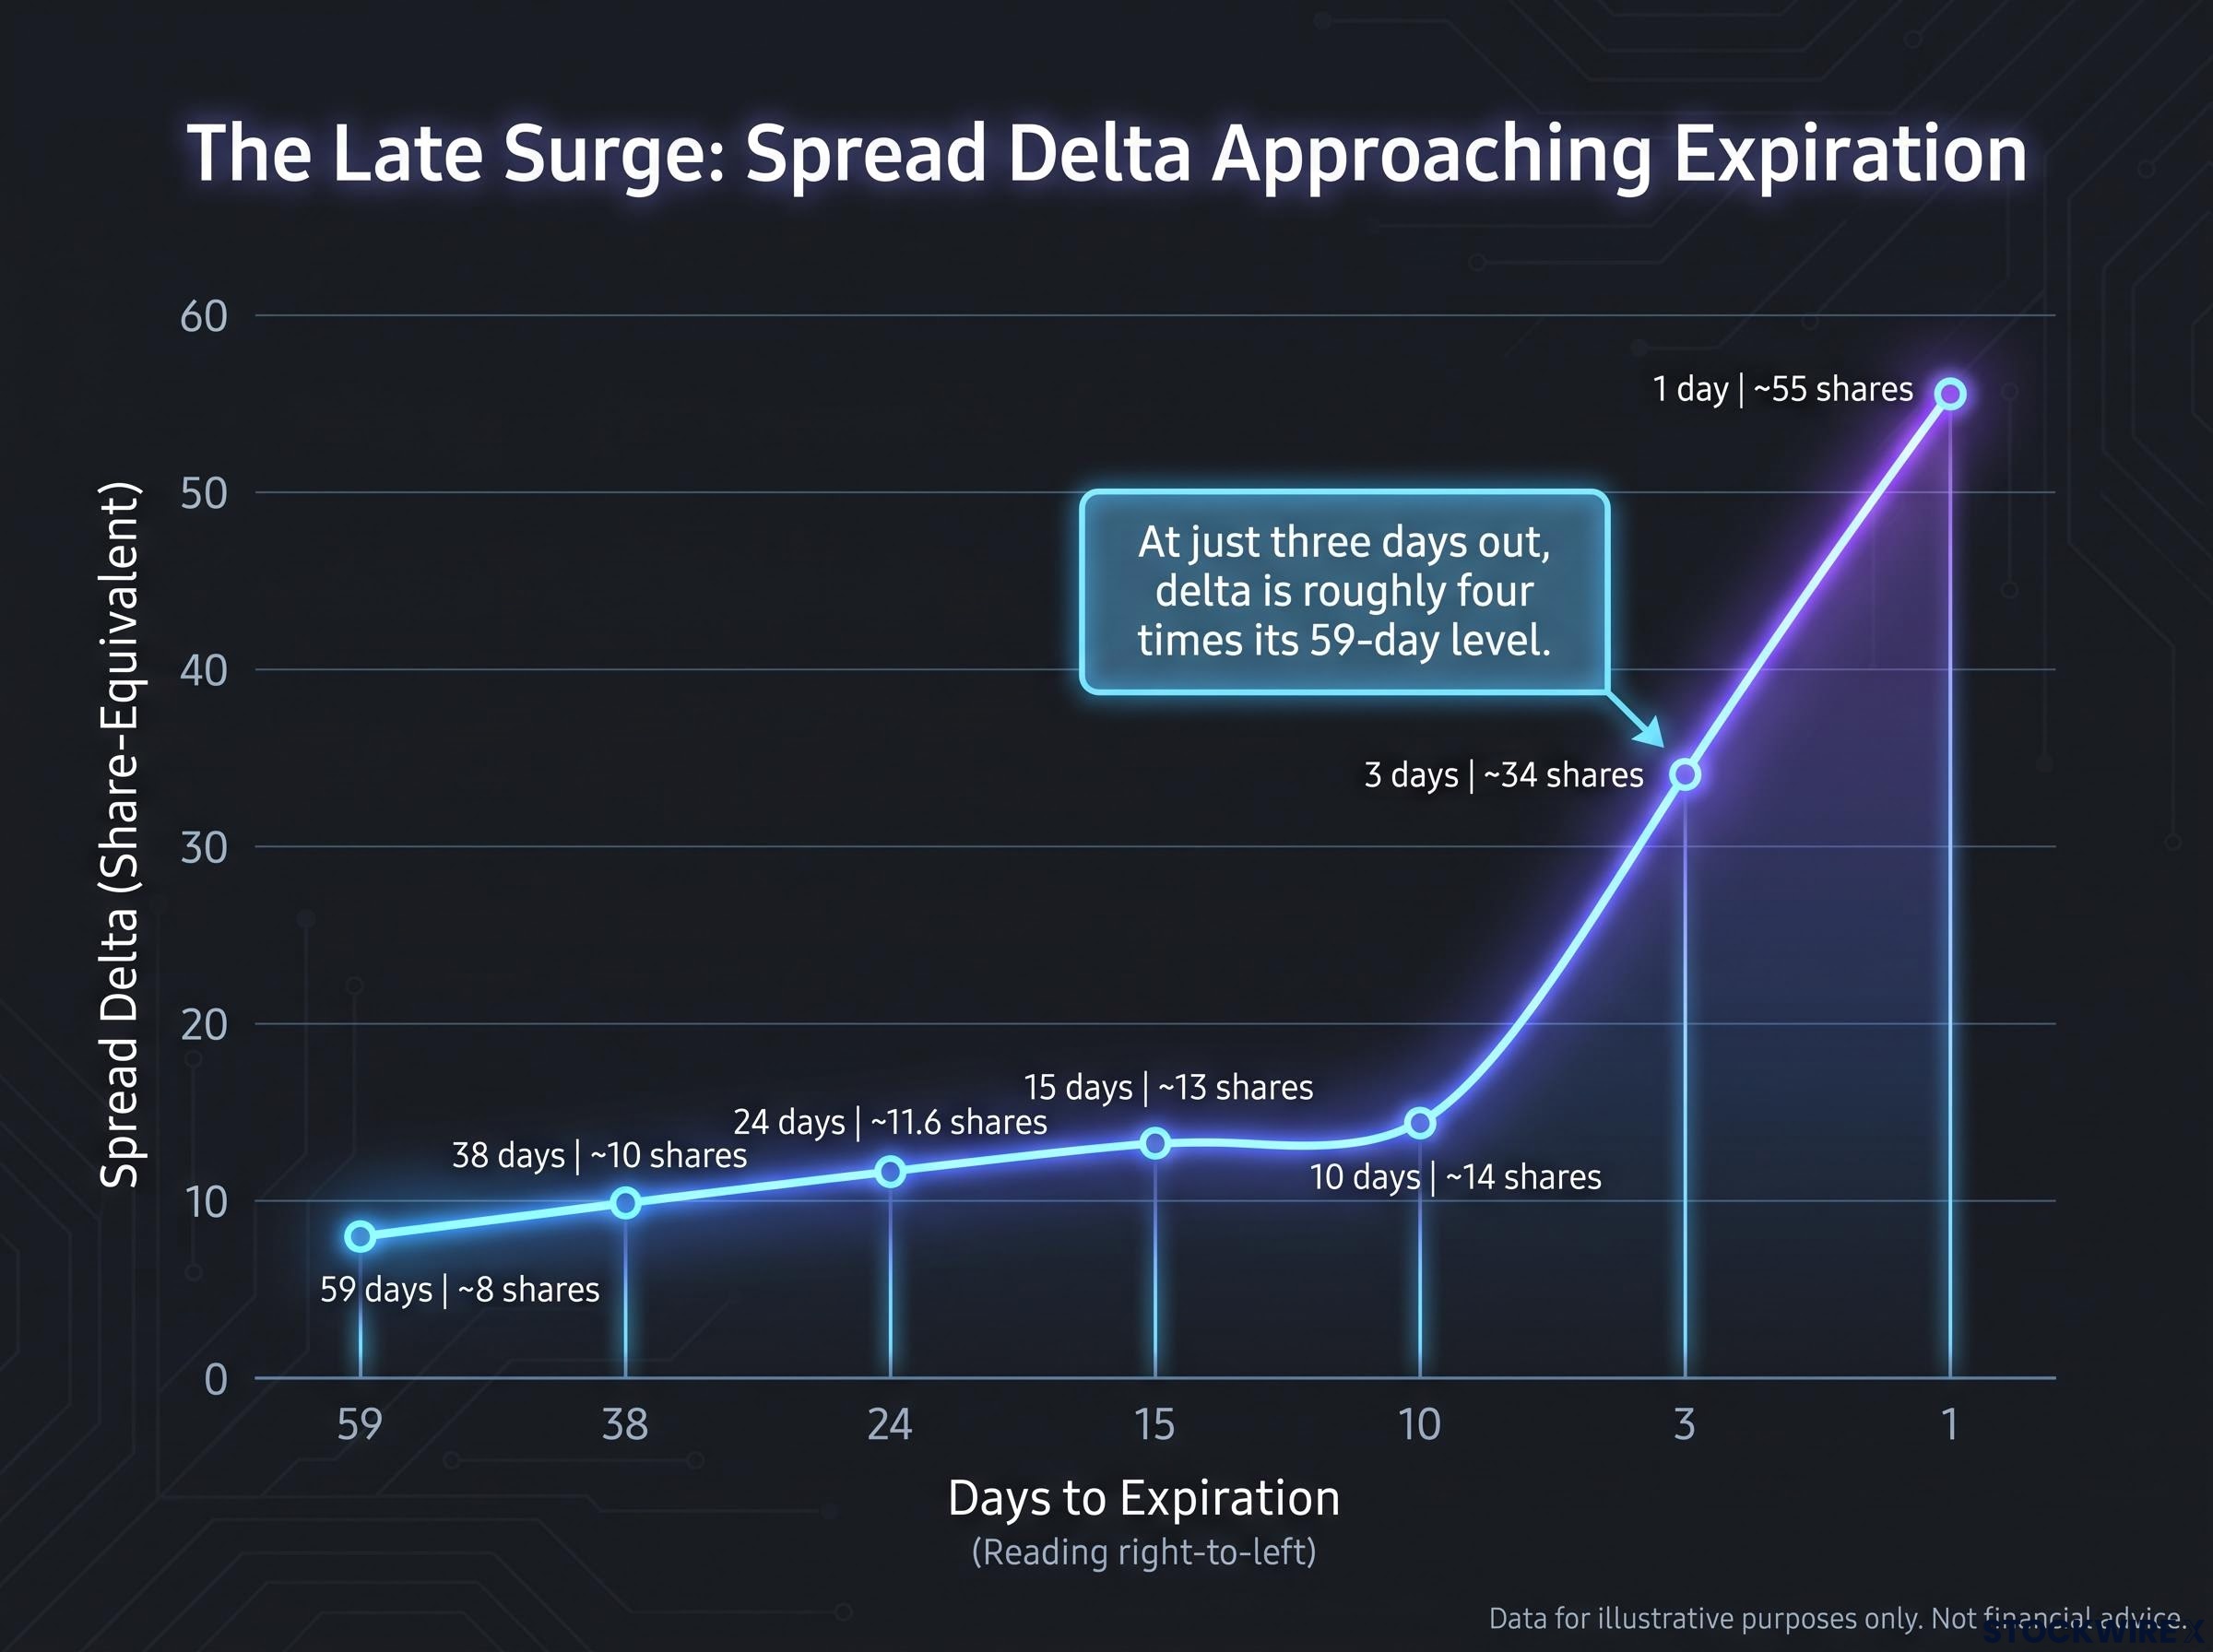
The late surge At just three days out, the spread’s delta is roughly four times its 59-day level.
You placed no new trade, and the stock did not move. Time alone turned an 8-share position into a 55-share one.
The gamma mechanism in plain language
Gamma is the rate at which delta changes for each $1 move in the stock. Schwab says gamma is largest for at-the-money options and grows more sensitive as expiration nears. Fidelity adds that options expiring within the week generally carry the largest gamma.
Zero DTE gamma effects are especially visible near the close, where gamma can run several times higher than on weekly contracts and small price moves force outsized hedging trades.
Fidelity’s example shows the effect clearly. An at-the-money call with 0.50 delta and 0.10 gamma moves to about 0.60 delta after a $1 rise, with gamma easing to about 0.07.
Inside a spread, the two legs pull apart as time runs out. With less time for the stock to wander, the lower-strike long call behaves more like stock and its delta climbs toward 1, while the higher-strike short call fades toward 0. The difference heads toward about 1, or 100 shares, for a call debit spread finishing between the strikes. Schwab describes this as the spread’s delta moving closer to the long call’s delta.
There is one qualification. Net gamma is the difference between the legs’ gammas, so if both legs sit near the money, their gammas partly cancel. The sharpest late jumps happen when one strike is near the stock and the other is farther away. Tastylive attributes the volatility surge near expiration primarily to gamma.
The practical point is simple: check delta again as expiry nears, not just at entry.
What does rising delta mean for managing the trade?
Rising delta is not only a number on a screen. It shapes the decisions you face in the final week.
Assignment and pin risk
Assignment means the buyer of your short option exercises it, so you must deliver or buy the shares. Tastylive notes that the risk grows near expiration. If both legs finish in the money, exercising your long leg offsets the assignment. If only the short leg finishes in the money, you can be left holding a stock position.
Pin risk arises when the stock settles at or very near a strike. You cannot know how many contracts will be assigned, and a late move can flip an option in or out of the money. You may wake up the next trading day with unexpected long or short stock. Defined risk does not mean defined settlement mechanics.
Investors exploring the dangers of rolling short spreads near expiry will find our full explainer on rolling losing spreads, which shows how a 2025 zero-day blowup stacked losses.
Comparing management approaches
Schwab notes that a vertical limits your loss to the strike difference less the premium received, plus costs. How you handle the final days is still your choice.
| Approach | Reasoning | Limitation |
|---|---|---|
| Close at 21 DTE or 50% profit | Tastylive’s 2024 study found 21-DTE exits gave the highest average return and lowest volatility among tested SPY 45-DTE strangle approaches | Tested on strangles, not every vertical |
| Roll or close early | Tastylive’s 2023 study found 21-DTE exits had lower volatility than holding through expiration | Results may not hold in every market regime |
| Hold to expiry | Known maximum loss; can capture the full payoff | Exposes you to assignment and pin risk |
| Profit target only | Avoids over-managing the position | Leaves you exposed if the target is not reached before the final days |
DTE stands for days to expiration. In a separate October 2024 tastylive study, the 21-DTE/50% approach lost to legging out (closing legs separately) in fewer than 2% of scenarios.
Be honest about the limits. Most support for early exits comes from tastylive’s own research on strangles, and it points to guidelines rather than universal rules. Changes in implied volatility can also outweigh a simple delta-times-move estimate. With 24.1% of 2025 U.S. volume in 0DTE contracts and 32.7% expiring in one day or less, these dynamics are common, not rare.
Before you enter, check:
- Your current net delta
- The likely delta at 3 days and 1 day out
- Your assignment exposure if only the short leg finishes in the money
- How close each strike sits to the stock
The real decision is how much share-equivalent exposure you will accept in the final days. Set that limit before the delta jumps, not after.
Reading your spread’s delta before the final days arrive
Three ideas carry the whole picture. Delta measures how many shares your position behaves like. A vertical’s net delta is the signed difference between its legs, shaped by strike width and where the stock sits. Time then pushes that figure toward about 100 shares when the stock finishes between the strikes.
You have already seen how 8 shares became 55 without a single trade. That pattern gives you a clear rule: decide your maximum comfortable share-equivalent delta before entering, then check it as each expiry week approaches.
This explainer is educational and not a trade recommendation. The worked figures come from a single platform snapshot and will vary with model inputs.
This article is for informational purposes only and should not be considered financial advice. Investors should conduct their own research and consult with financial professionals before making investment decisions. Past performance does not guarantee future results, and option values are subject to market conditions and various risk factors.