Most people treat a short position as a simple bet that a stock will fall. In practice, a short is a claim about timing, financing and how long the market will keep paying for a story. George Noble’s long short investing record shows why: his longs beat his shorts by a raw spread of 67%, roughly 120% annualised, and he still says part of that result was luck.
The backdrop makes the question urgent. The Federal Reserve raised rates in September 2026 for the first time in three years. The US 10-year Treasury yield sits near 5.10% after touching 5.34% on 1 October, and the US midterm elections are only weeks away.
Tightening and volatility are testing speculative and defensive portfolios alike. Noble, who has invested since 1981, makes a useful case study for that test. He is not an oracle.
This piece covers how longs and shorts are balanced, why his sit where they do, and which risks and counterarguments deserve as much weight as his thesis.
How does long-short investing actually work, and why does exposure matter more than the label?
The basic idea is simple. A long position means you own a stock and profit if it rises. A short position means you borrow shares, sell them, and aim to buy them back later at a lower price, keeping the difference.
Pair the two and you have a long-short portfolio. You buy what you expect to outperform and short what you expect to lag, so part of your return comes from the gap between them rather than from the market’s direction.
The label, though, tells you far less than two numbers on the factsheet.
Even a correct thesis can lose money once you count the hidden costs of short selling, including daily borrow fees, margin requirements and the cost of waiting for the market to agree with you.
Gross versus net, in one example
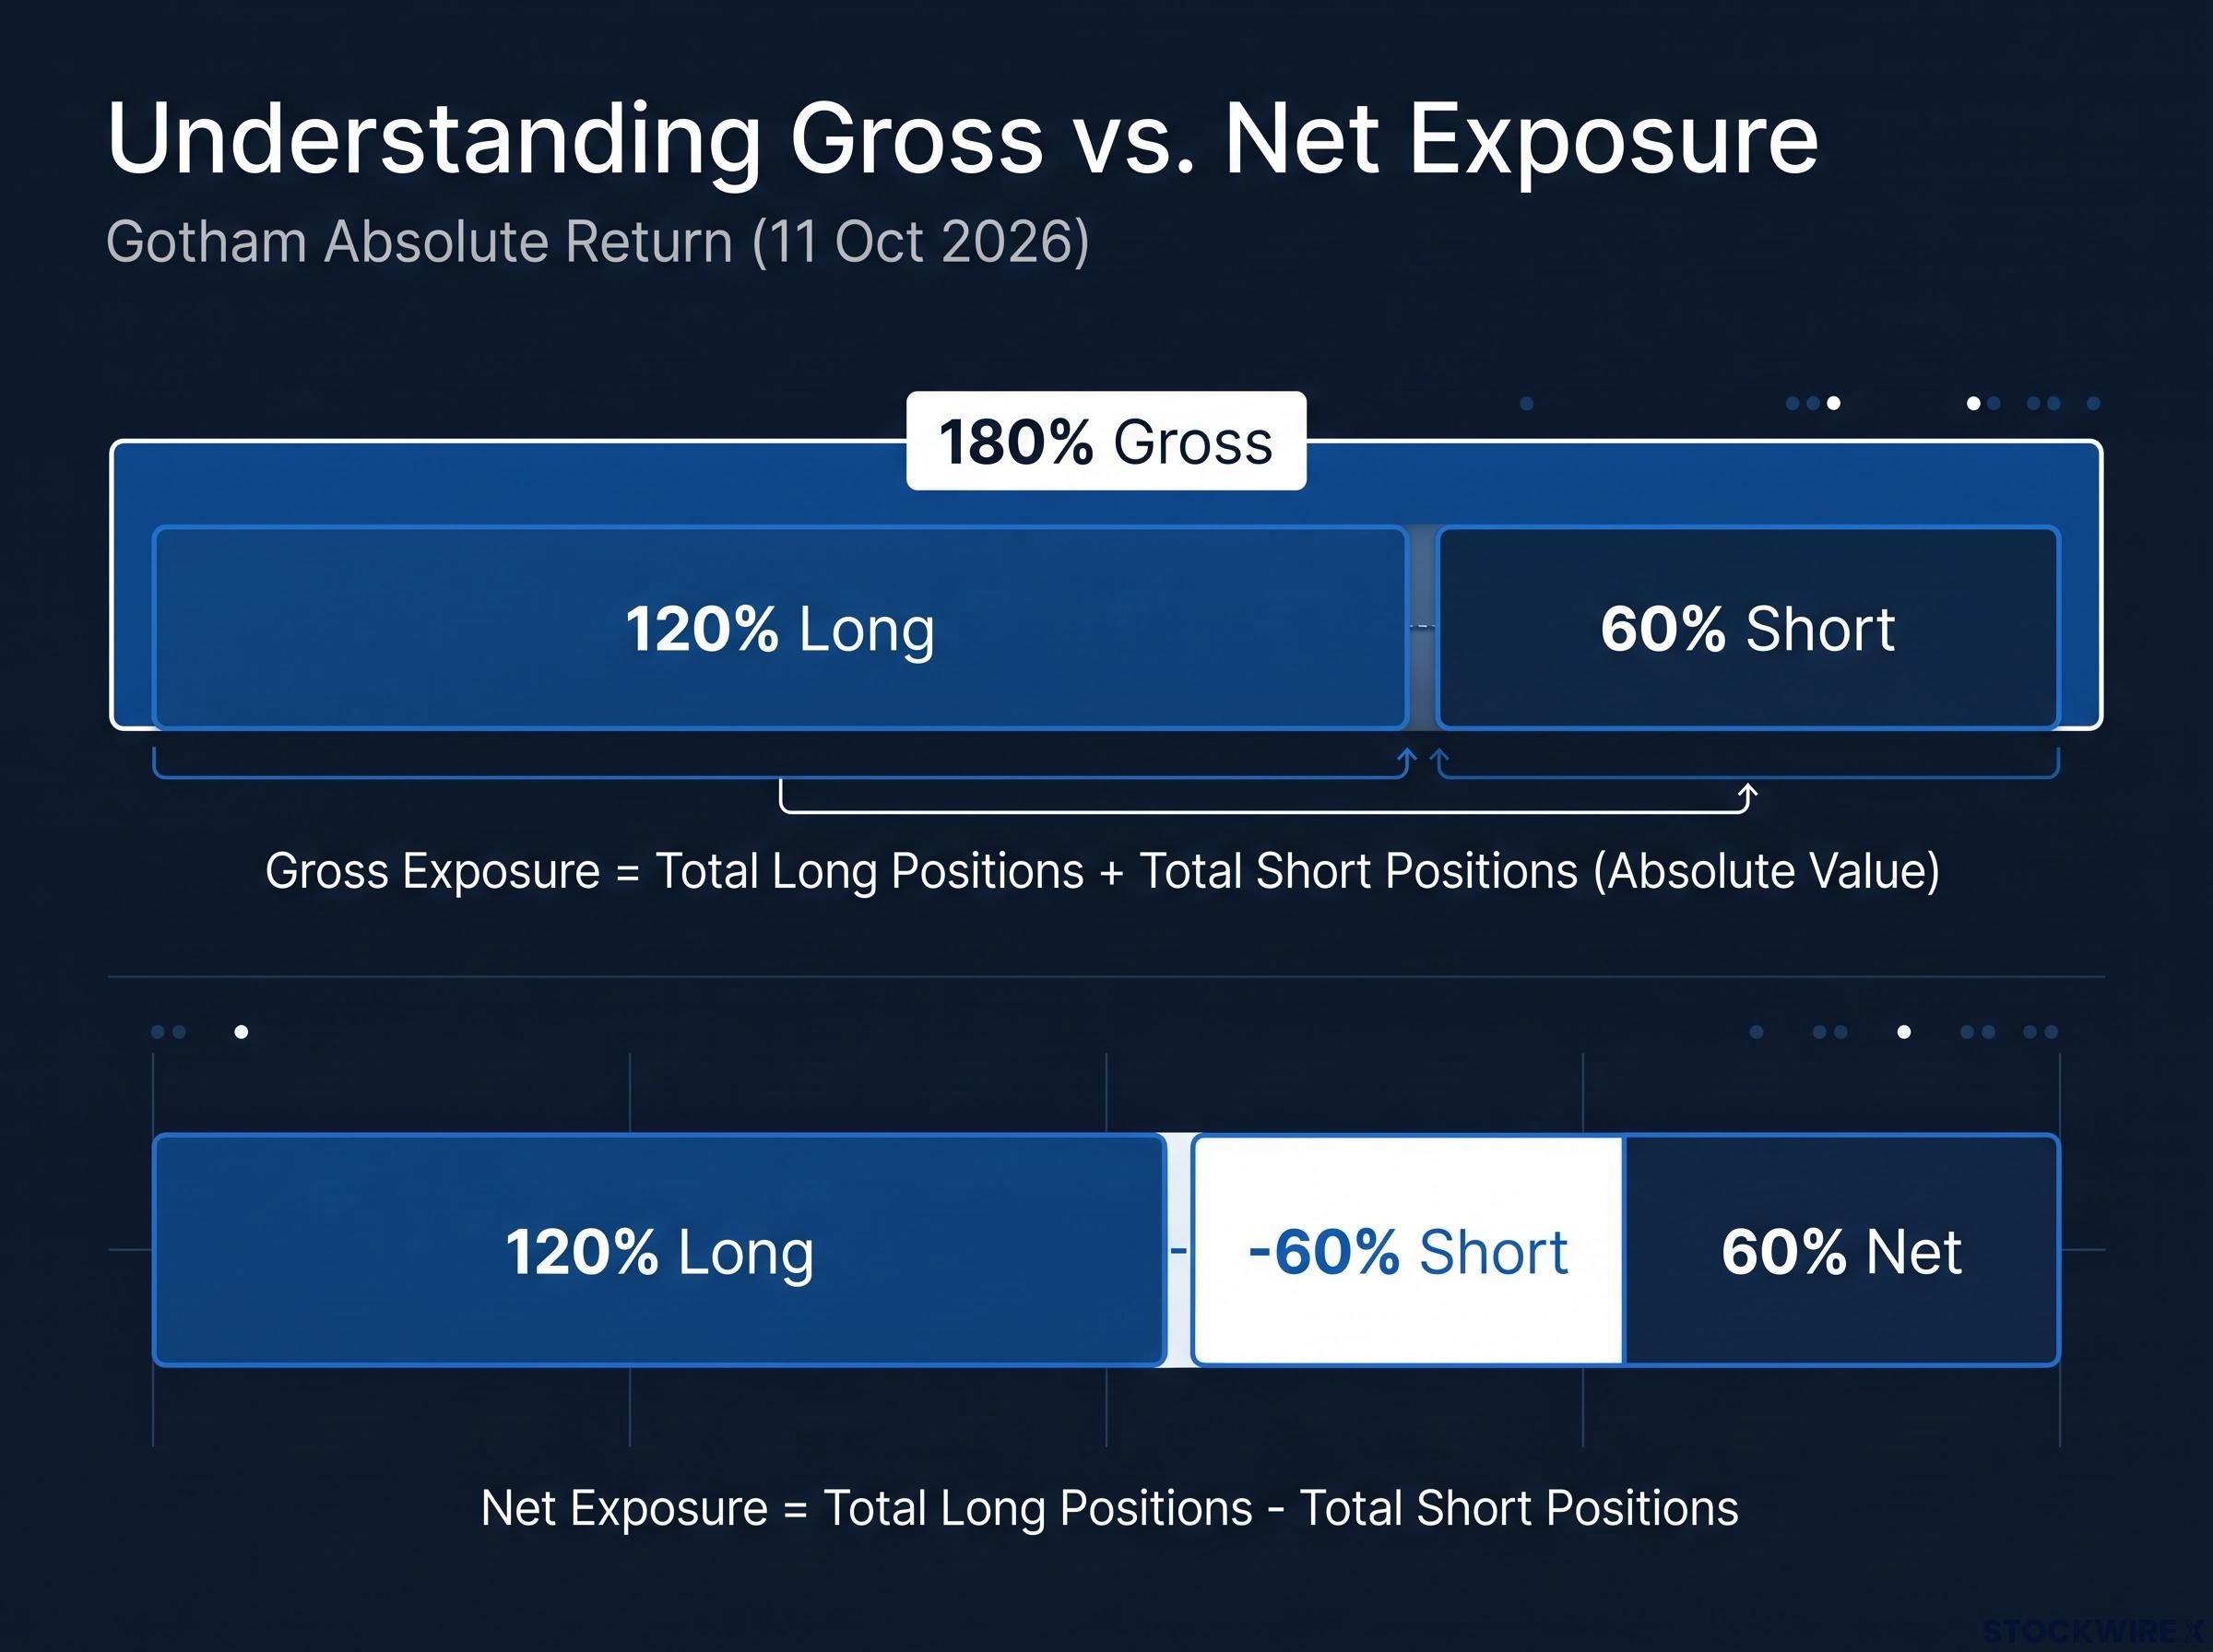
Gross exposure is the total size of your longs plus your shorts, measured against your capital. Net exposure is your longs minus your shorts, and it shows how much market direction you are still carrying.
Take the Gotham Absolute Return Fund, which reported its book on 11 October 2026. It held 120% of capital in longs and 60% in shorts. Add them and gross is 180%; subtract the shorts and net is 60%.
| Fund (reported date) | Long / short | Gross | Net |
|---|---|---|---|
| Gotham Absolute Return (11 Oct 2026) | 120% / -60% | 180% | 60% |
| Neuberger long-short fund (August 2026) | Not reported | 138.1% | 47.7% |
These are fund-reported figures, accurate only for their dates. The Neuberger fund returned 0.98% in August, against 1.38% for the HFRX Equity Hedge Index and 2.72% for the S&P 500.
The wider industry looks similar. UBS put equity-hedged net exposure at 70.2%, down 1.1 points, and hedge-fund net exposure to the Magnificent Seven is reportedly about 22%, the highest since 2023. The evidence points to net-long books with meaningful gross exposure, not market-neutral ones.
Even a low net number leaves risks in place:
- Factor risk: your longs and shorts may share hidden traits, such as size or rate sensitivity
- Liquidity risk: positions may be hard to exit in a sell-off
- Borrow risk: lenders can recall shares or raise fees
- Correlation risk: longs and shorts can fall or rise together
- Squeeze risk: a rising short can force you to buy at the worst moment
So when you see “long-short” on a fund, assume it still carries real market risk until the exposure numbers prove otherwise.
When big ASX news breaks, our subscribers know first
What does a real-asset long book look like when rates are rising?
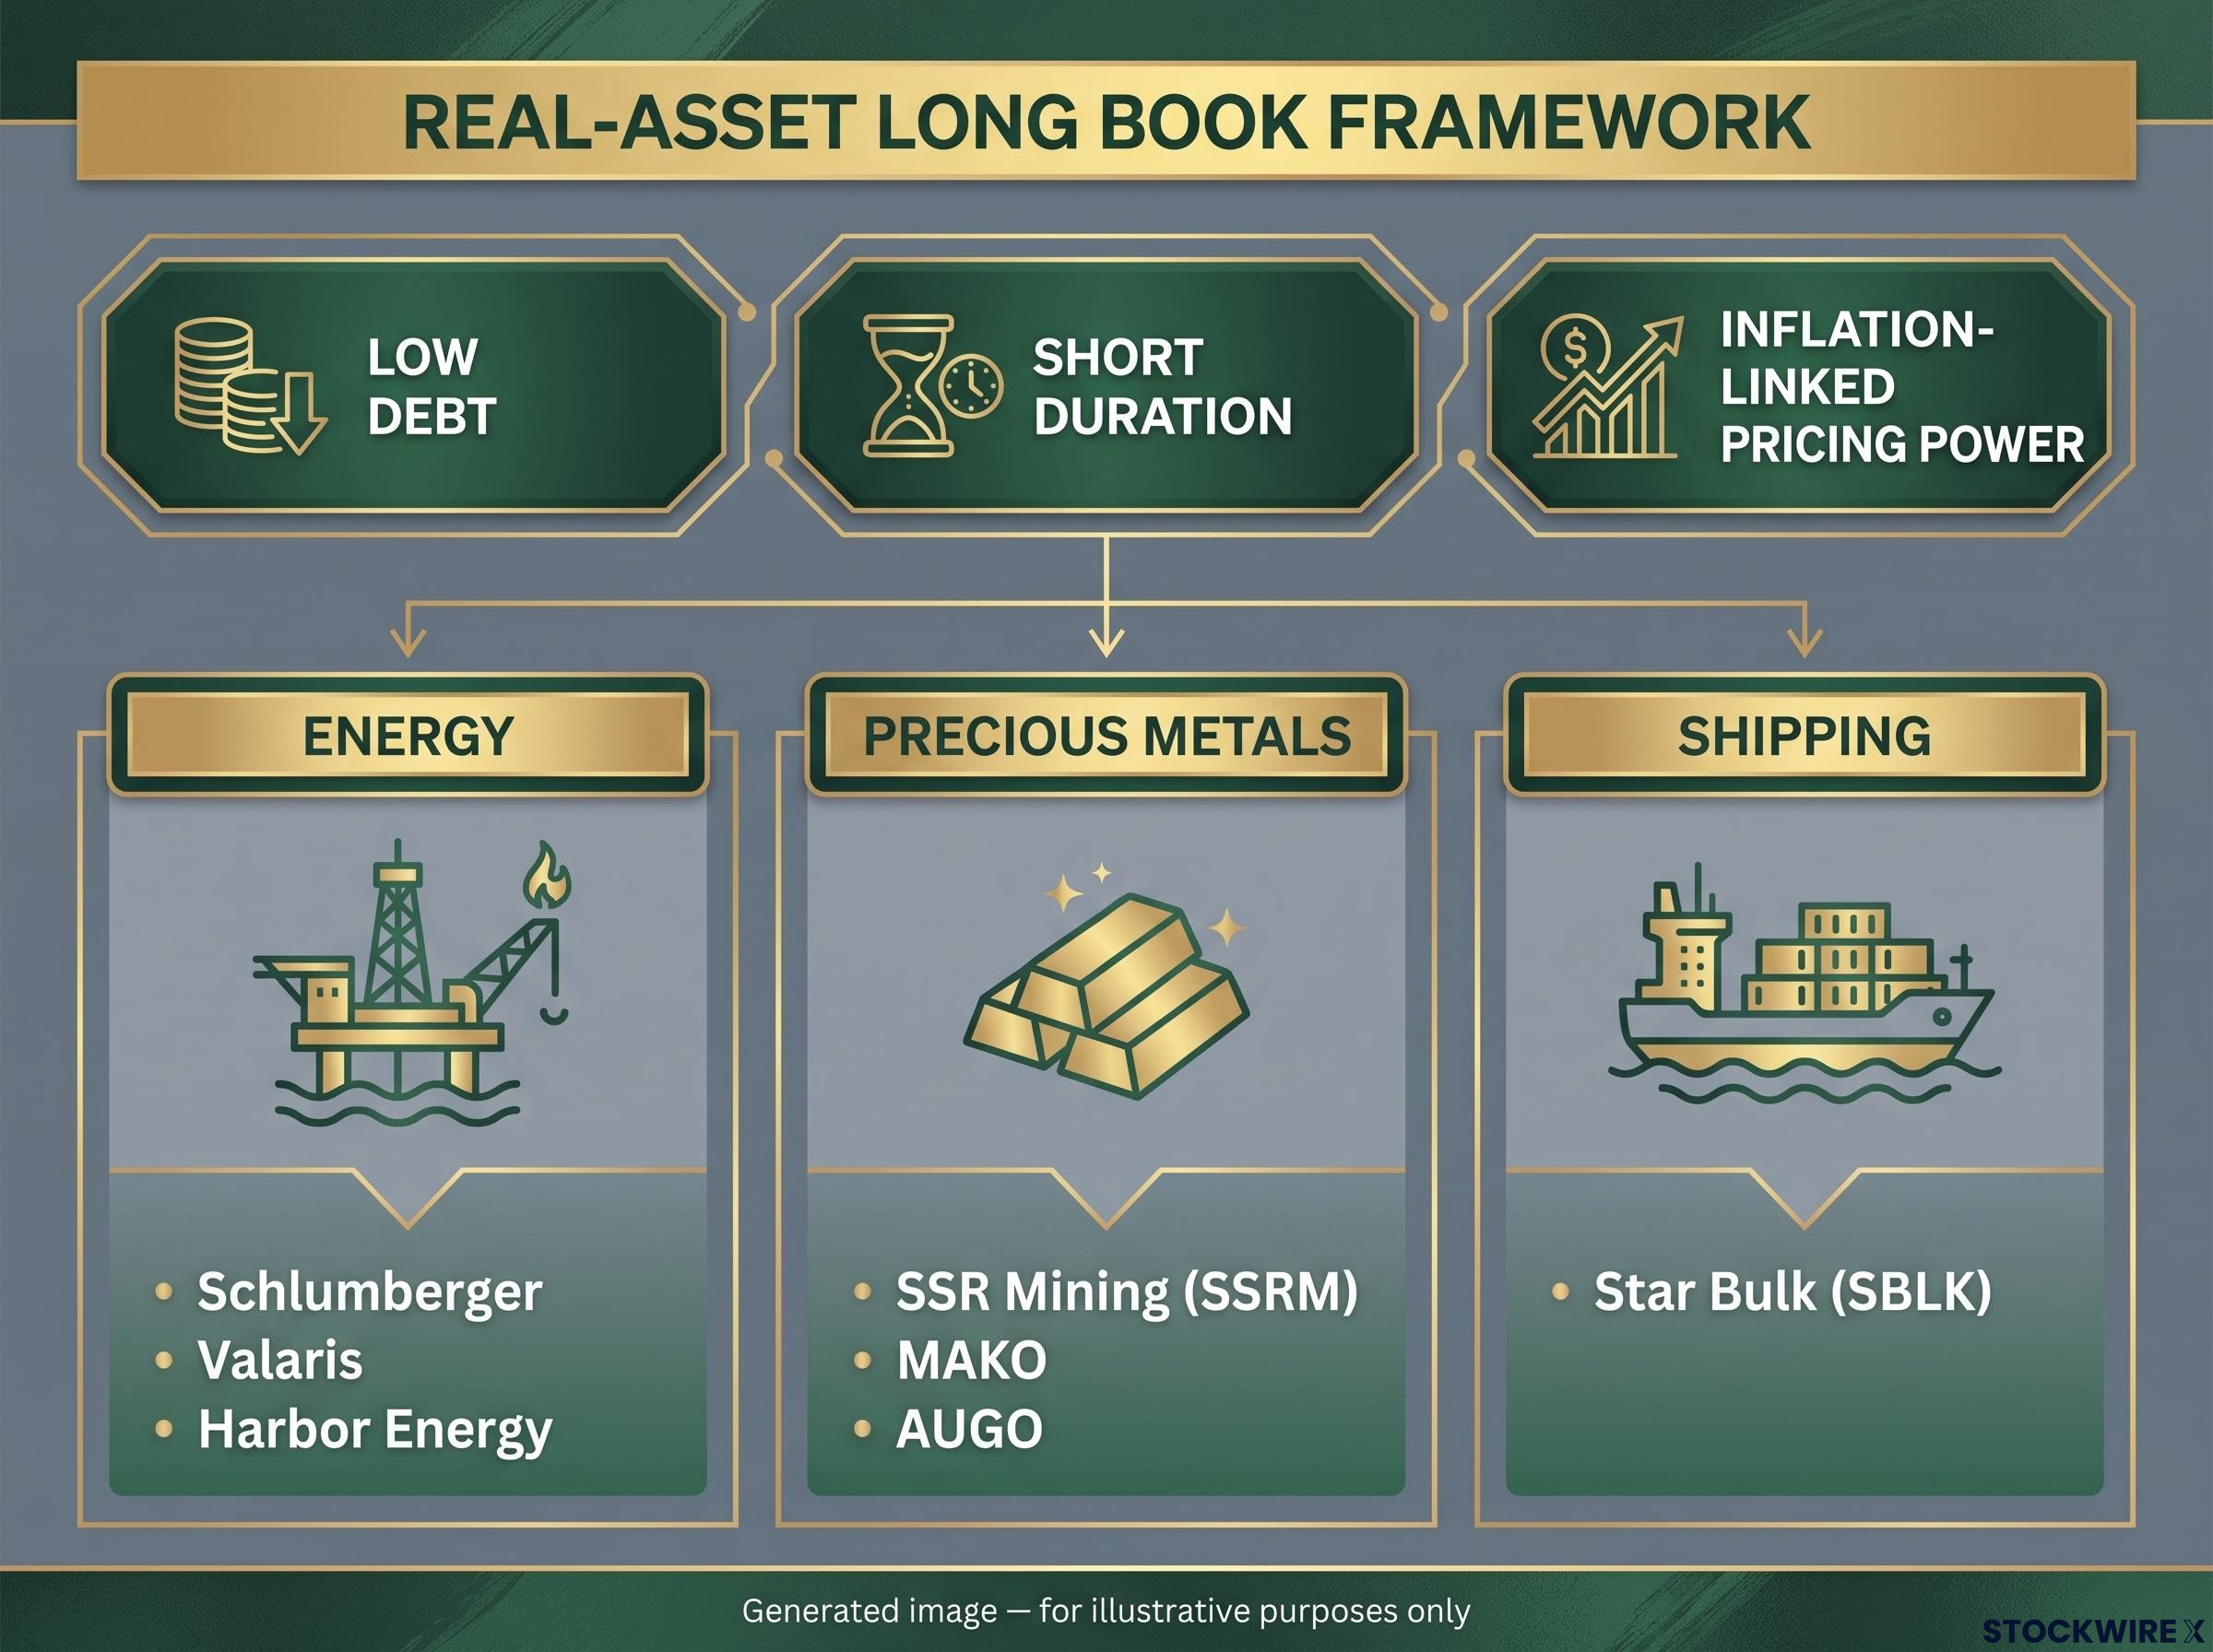
Before naming any stock, Noble’s long book starts with three traits:
- Low debt: fewer interest and refinancing costs as rates climb
- Short duration: more value comes from near-term cash, so higher discount rates hurt less
- Inflation-linked pricing power: the ability to pass rising costs on to customers
Duration matters here. A discount rate is the rate used to convert future cash into today’s value, and when it rises, distant cash is worth less. A cash-burning growth company whose payoff sits years away takes the bigger hit.
From there, the sectors follow. Inflation raises the replacement cost of rigs, pipelines and vessels, so constrained energy supply supports prices. Miners have operating leverage, meaning revenue can rise faster than their largely fixed mine costs, and freight rates can spike when vessel supply is tight.
Noble’s positions illustrate that logic; they are his holdings, not recommendations. In energy he holds a Canadian name, reportedly up 80-90% since his December pick, plus Schlumberger, Valaris, Harbor Energy and a Southeast Asian company. In precious metals he owns SSR Mining (SSRM), MAKO and AUGO, and in shipping, Star Bulk (SBLK).
The numbers give the theme some weight. SSR Mining posted Q2 adjusted EPS of $0.66 on revenue of $443.8M, realising $4,301/oz for gold and $74.24/oz for silver. Star Bulk earned $144.9M net with adjusted EBITDA of $184.2M, while Valaris reported revenue of $539.2M and EPS of about $0.72-$0.73.
| Sector | Structural argument | Cyclical risk |
|---|---|---|
| Energy | Underinvestment and permitting delays keep supply tight | Recession or rising inventories can reverse prices |
| Gold and miners | Fiscal and monetary distrust supports gold | Labour, fuel and permitting costs; grades can disappoint |
| Shipping | Sanctions and war can keep routes disrupted | New vessel deliveries can crush freight margins |
This book is a bet on constrained supply plus resilient nominal demand. If inflation falls because demand collapses, it works against its own thesis.
Noble’s real-asset long book is one version of an inflation hedge portfolio, though no single asset hedges every regime, so you would normally layer dividend equities, real assets and broad index exposure.
Why the valuation number depends on the date
One stock, four multiples Noble cites SSR Mining at 7-8x earnings. Forward estimates sit near 8.0-8.3x, while other sources show about 11.0x and 27.8x.
The gap comes largely from timing and basis. Trailing earnings use the past year’s profit; forward earnings use forecasts. Before you compare any two multiples, check which basis and which date each one uses.
Why short Tesla and SpaceX, and what could make that short wrong?
The short side runs on the opposite logic: long-duration, cash-hungry companies priced on distant promises.
The bear case in numbers
Noble argues Tesla trades on a “Musk premium” while its cash burn intensifies. In Q2 2026, revenue rose 25.5% to $28.24B, but adjusted EPS of $0.33 missed consensus of about $0.54, and free cash flow was roughly -$1.09B on capex of $5.79B.
Spending is accelerating. Tesla guided to capex above $25B for 2026, against about $8.5B the year before. Consensus estimates for Q3 (results are due 21 October and are not yet out) point to capex of $7.77B and free cash flow near -$4.51B.
Noble benchmarks Tesla’s robotics venture at $30-40B against a market capitalisation he puts at about $1.49T, his figure rather than an exchange’s. He dismisses the flying Roadster demo as stock promotion, noting there is no firm production date and the thrusters are not road legal. He shorted near $475-485 and says he is about 25% ahead, and he estimates fundamental value at $30 a share for both Tesla and SpaceX, his own unverified numbers.
SpaceX listed in June 2026 at about $1.77T, pricing at $135 a share. KeepTrack.space put it near $2.2T at the 9 October close, uncorroborated, and secondary reporting cites Q3 revenue of $14.58B against capex of $19.6B.
The case against the short
| Position | Reasoning |
|---|---|
| Bear, Tesla (Noble) | Musk premium, pressured auto margins, rising capex, negative free cash flow |
| Bull, Tesla | Autonomy, robotaxis, Optimus, energy storage; 486,532 Q3 deliveries and a SpaceX stake add optionality |
| Bear, SpaceX (Noble) | Capex dwarfs operating cash flow, relying on capital-market enthusiasm |
| Bull, SpaceX | Starlink-type recurring revenue, launch infrastructure and scarcity |
The point is not that the stocks are cheap Conventional valuation may understate successful autonomy, robotics or satellite dominance. New high-margin businesses can grow into the multiple.
SpaceX’s reported cash of about $90B (unverified) buys time. A cash-burning company survives as long as investors keep funding it, which means your short depends on capital-market appetite as much as fundamentals. Being early looks identical to being wrong.
What can go wrong: macro tightening, squeezes, elections and the limits of skill
Noble’s macro case is that tightening raises the cost of capital everywhere at once.
| Institution | Latest move |
|---|---|
| Federal Reserve | Raised 25bp to 3.75%-4.00% (September) |
| ECB | Raised to 2.50% |
| Bank of England | Held at 3.75% |
| Bank of Japan | Raised to 1.25%, reportedly highest since 1995 |
“a synchronous tightening in monetary policy in most places around the world,” with “no free riders.” Kevin Warsh, Federal Reserve
The 10-year yield’s 5.34% peak was its highest since 2002. Noble also criticises Treasury Secretary Bessent over an August buyback expansion he describes as roughly $4B to $8B, made when yields were near 4.70%, and compares him to Norman Lamont. The research does not confirm the buyback details, so treat that as his claim.
Six ways a short loses money
- Unlimited loss: a stock can rise without ceiling.
- Squeezes: forced covering adds buying pressure.
- Borrow costs: fees spike or shares get recalled.
- Margin calls: brokers demand collateral or liquidate you.
- Timing: a correct thesis entered early still loses.
- Crowding: public shorts attract activist or retail buyers.
On Black Wednesday, 16 September 1992, speculators were right about sterling because the policy break came before their financing ran out. In the 2021 meme-stock squeezes, retail buying forced short sellers in GameStop and others to cover at painful prices.
Short squeeze mechanics matter because forced covering by one trader becomes buying pressure for everyone else, so you can be right on the business and still be forced out at the worst price.
Elections, luck and lower expected returns
Noble thinks oil and volatility are being held down before the vote. Capital Group finds midterm-year volatility near 16% versus 13% otherwise, and Morningstar reports 4 in 10 investors have already adjusted portfolios. Vanguard, however, finds no significant link between the party in power and returns.
Then there is Noble’s own admission: his results were partly lucky, and he expects future returns to be lower. A strong record, including his, does not prove a repeatable edge, so your sizing and process matter more than anyone’s conviction.
What a long-short mindset takes, and what it does not guarantee
Three lessons carry over. Manage your net exposure deliberately, match your longs to the rate environment, and size your shorts on the assumption you will be early. Noble’s holdings remain one investor’s positions, and pending or unverified data, including Tesla’s Q3 results, SpaceX’s figures and the Treasury buyback details, may change the picture.
Before taking either side, ask what would prove your thesis wrong, and how long you could afford to wait. Past performance does not guarantee future results, and forward-looking views here are speculative. This article is for informational purposes only and should not be considered financial advice. Investors should conduct their own research and consult with financial professionals before making investment decisions.