A sideways market can look like nothing is happening. On Monday it was full of signals. The Nasdaq-100 was hanging onto a trendline it had already broken, semiconductor support kept refusing to give way, and then a sharp late-session turn sent oil, yields and volatility lower while stocks pushed higher.
That is how a range-bound market behaves. Price drifts between a floor and a ceiling, and each test of those edges tells you something about who is in control.
The timing makes this worth understanding now. Earnings season is in full swing, the 3 November midterms are about two weeks away, and the data calendar has been thin since the last consumer price index (CPI) report. Traders are waiting for a catalyst, and until one arrives, the edges of the range carry most of the information.
Here is how to read these sessions: what support and resistance are telling you, why a reversal can mislead, and which signals to watch before the range breaks.
What a range-bound market is and how traders read support and resistance
Think of a ball bouncing between a floor and a ceiling. A range-bound market works the same way: prices rise, stall, fall, find buyers and rise again, without making lasting progress in either direction.
The floor is support, a price level where buying has repeatedly stopped declines. The ceiling is resistance, a level where selling has repeatedly capped rallies. A trendline is a line drawn across a series of rising lows or falling highs that shows the direction of a trend.
These levels can switch roles. Once support breaks, it often turns into resistance, because buyers who entered there may sell to get their money back when price returns to that level.
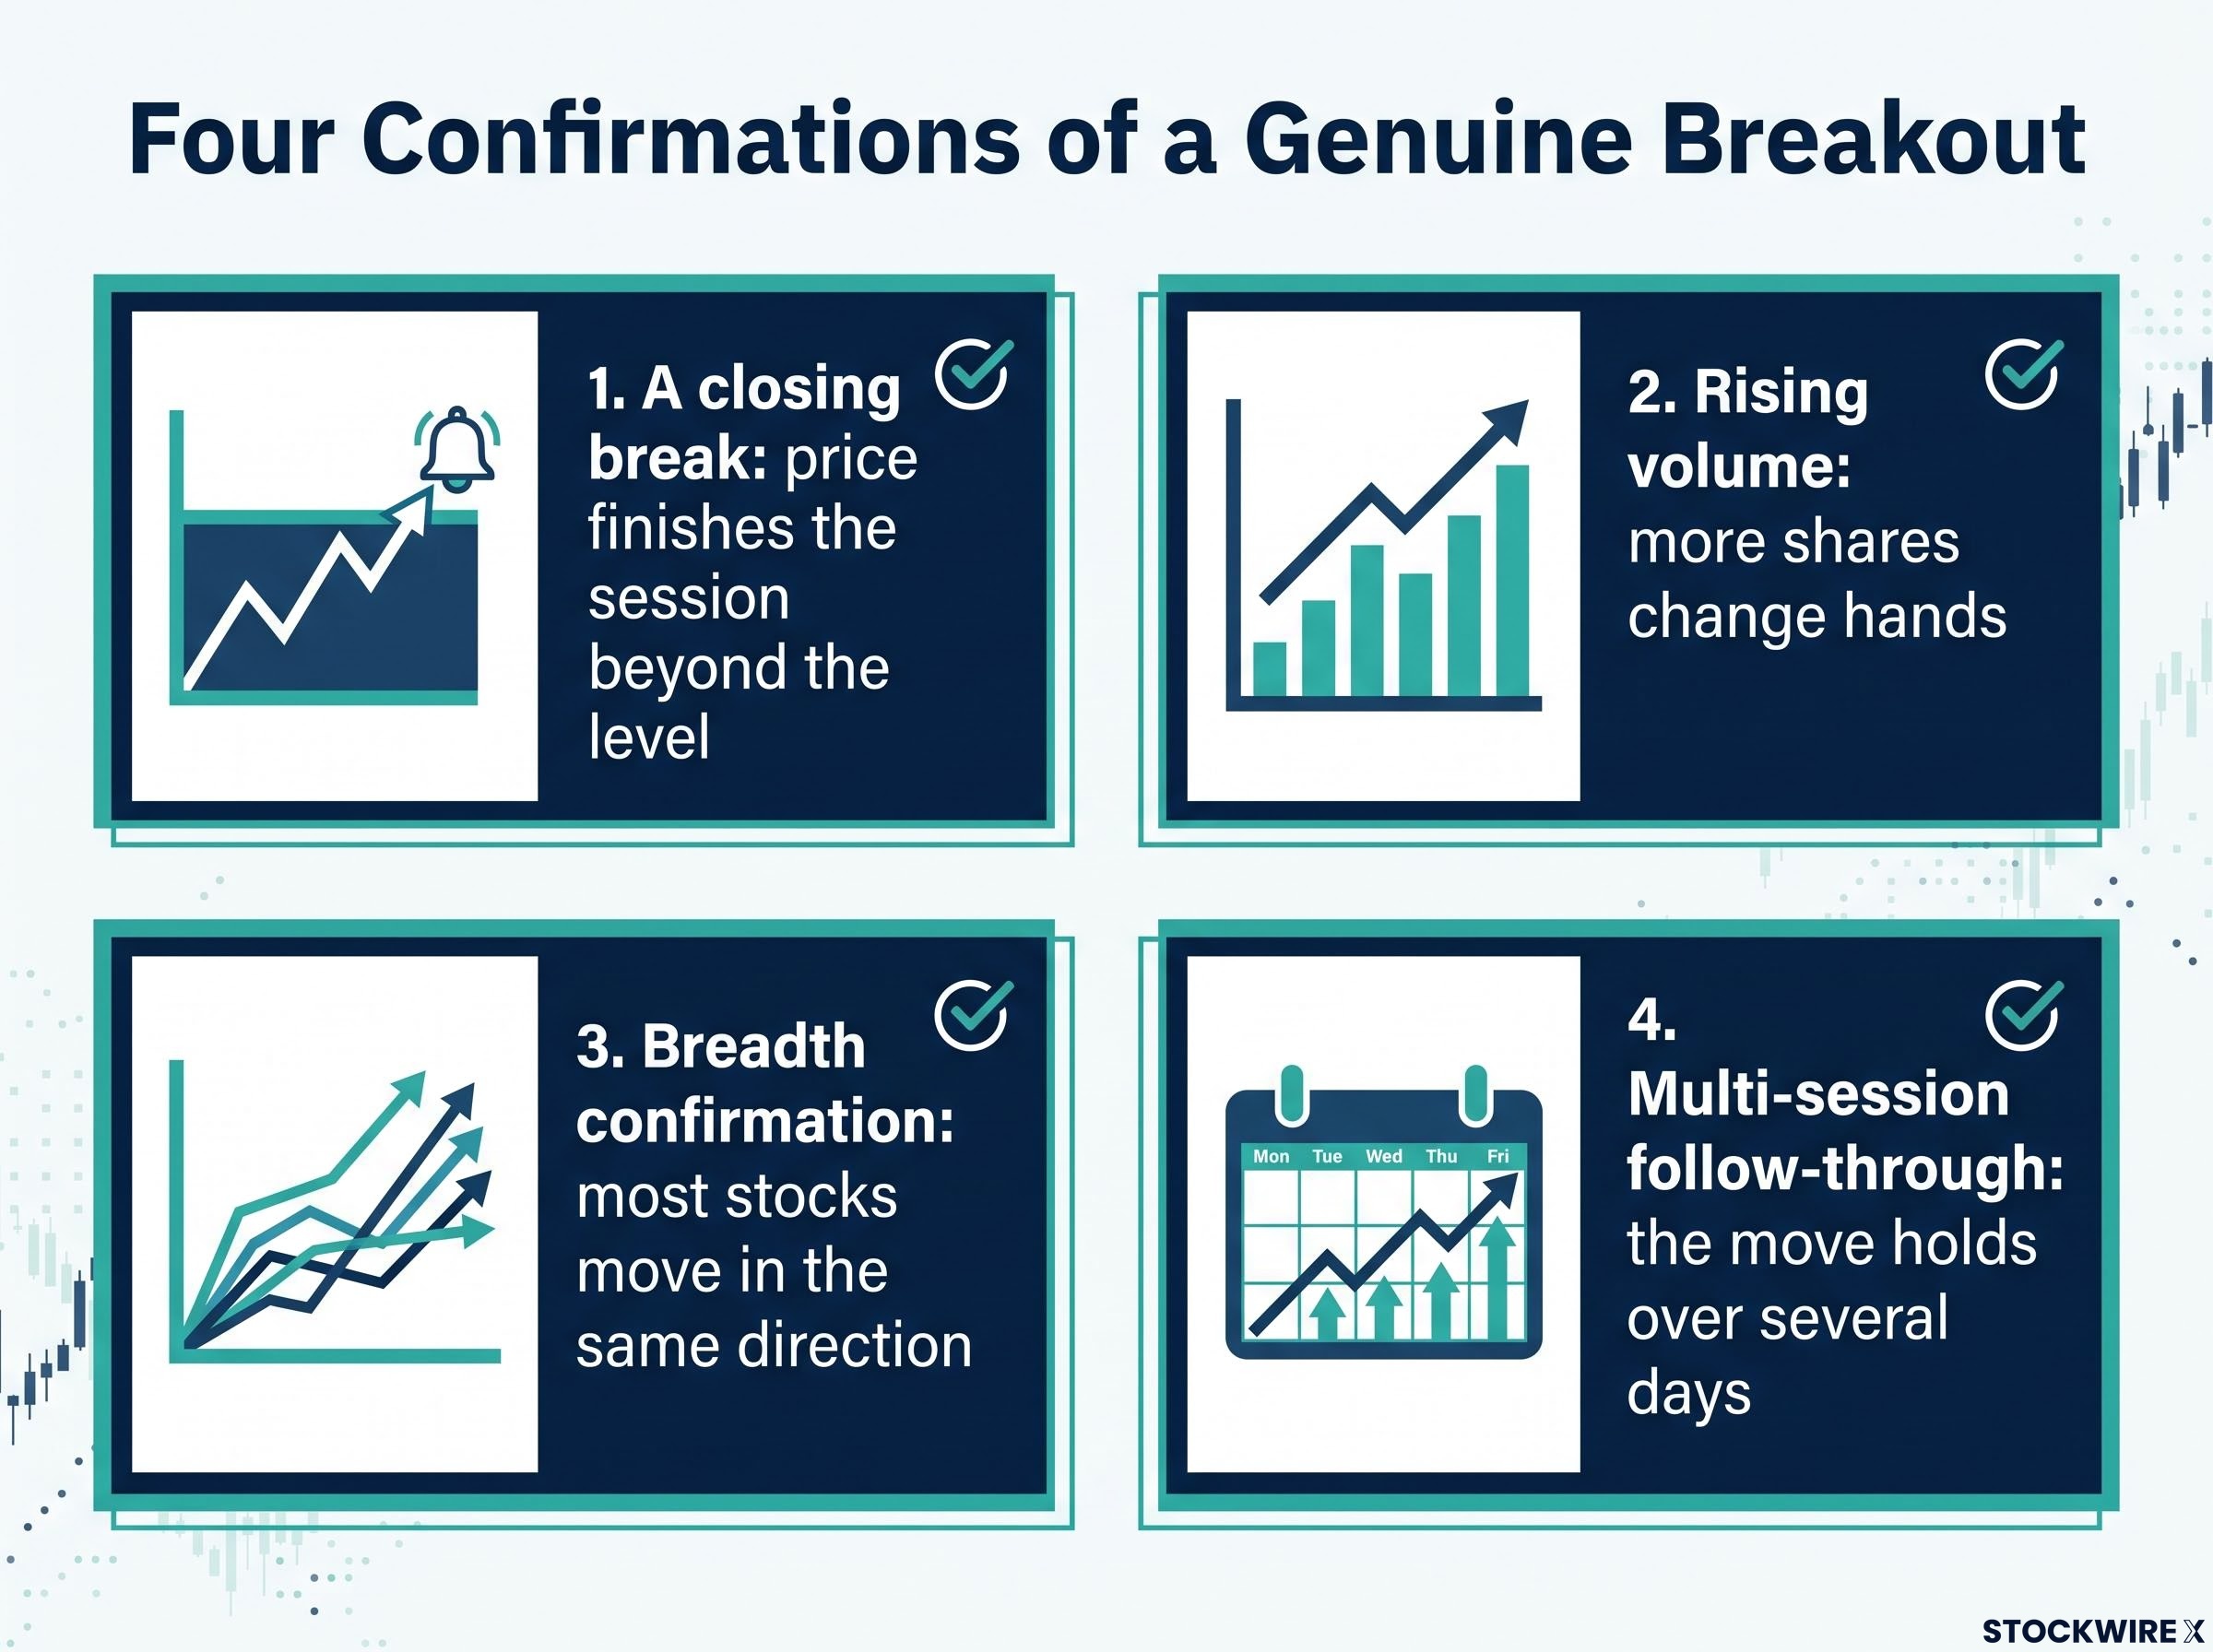
The edges of a range are decision points, not predictions. Absent follow-through, traders tend to buy near support and trim near resistance. Before treating a break as genuine, they usually look for four confirmations:
- A closing break: price finishes the session beyond the level, rather than just touching it intraday.
- Rising volume: more shares change hands, which shows conviction behind the move.
- Breadth confirmation: most stocks move in the same direction, not just a handful of large names.
- Multi-session follow-through: the move holds over several days.
Lawrence McMillan showed why that checklist matters in his 16 October commentary on the S&P 500.
McMillan’s read: He described the early-October move as a false breakout, with the index back in what he called a “dull trading range”. He put resistance at 7,820-7,840 and support at 7,580-7,620.
Real break or false break?
An intraday dip below support is not the same as a close beneath it. Dorsey Wright draws this line explicitly. It flagged the Russell 2000 slipping below about 2,740 and the S&P 500 reversing near 7,650 as support failures, while separating intraday violations from confirmed breakdowns.
A bear trap is a brief drop below support that triggers sell orders before buyers push price back above the level. If price keeps failing to close beyond either edge, you are looking at indecision rather than a trend. Treat early signals at the edges with scepticism until the confirmations line up.
For readers wanting a repeatable method for judging breaks, our dedicated guide to failed breakout trading walks through four observable tests: location, break, reclaim, and follow-through.
When big ASX news breaks, our subscribers know first
Where the levels sit: the Nasdaq-100, semiconductors and the major indexes
That checklist becomes more useful when you apply it to real levels. The figures below use the 19 October 2026 closing data only. Some earlier commentary quoted very different index levels that appear to come from another session or measure, so those numbers are not mixed in here.
| Index | October 19 close | Move | Key support | Key resistance |
|---|---|---|---|---|
| Nasdaq-100 | 29,529.34 | Not identified | Near 28,700 | Near 29,620 (former 100-day average) |
| S&P 500 | 7,690.73 | +31.29 (0.41%) | 50-day average; broader support near 7,600 | About 7,780 |
| Dow Jones Industrial Average | 51,966.03 | -36.38 | Not identified | Near 52,010 (50-day EMA) |
| Russell 2000 | 2,728.30 | +6.93 (0.25%) | Near 2,722.85 | Near 2,825 (earlier coverage) |
The Russell 2000’s 14-day relative strength index (RSI14), a gauge of recent buying and selling momentum on a 0-100 scale, sat at 33.2, the weakest of the major indexes cited. A tech rebound alongside a soft Dow and weak small caps tells you the market lacks broad confirmation. Do not mistake one index bouncing for a new trend.
Nasdaq-100: a broken trendline under test
The index broke its rising trendline but has kept clinging to it. Resistance sits where that broken line meets the horizontal level of the former lifetime high. Charles Schwab analysts called the index neutral to bearish after it lost its 100-day average near 29,620, a level that may now cap rallies.
SMH: support that keeps frustrating bears
The VanEck Semiconductor ETF (SMH) tells a sturdier story. A horizontal support line dating from roughly late July or August has held repeatedly, with one exception tied to a brief wipeout event. On Friday it dipped slightly below that line intraday and still did not break down.
The fund has fallen for six sessions to the 61.8% retracement of its advance, meaning it has given back that share of its prior gain. Analysts see channel resistance near $594.58 and a price gap near $573 as a lower reference.
Why did stocks reverse late in the session as oil, yields and volatility fell?
The levels show where the market is stuck. The late-session turn shows what can move it.
According to the original market commentary, crude fell late in the session, yields and volatility dropped, airline stocks surged and equities rallied. One airline the hosts checked was up about 5.23% on the day. No single report confirmed every element of that account, so treat it as one desk’s description.
The closing data supports the direction. On 19 October, West Texas Intermediate (WTI) crude settled at $98.41, down 2.96%, while the CBOE Volatility Index (VIX), which measures expected stock market swings, fell 1.55 points to 18.44. This chain shows why each asset moved:
- Airline fuel costs: Jet fuel is a major expense, so cheaper crude can lift margins. United Airlines outperformed earlier when a G7 strategic reserve release pushed oil lower.
- Inflation expectations: Lower energy prices ease headline inflation and the risk of further rate rises.
- Discount rates: Lower Treasury yields reduce the rate used to value future profits, which helps growth and tech shares most.
- Risk appetite: A lower VIX cuts hedging costs and can draw buyers back into higher-risk positions.
Oil and yields have been the market’s twin pressure points for weeks.
Reuters’ framing: Higher oil and Treasury yields were described as “dueling headwinds” for stocks.
Art Hogan of B. Riley Wealth Management described a market searching for positive signals while waiting on earnings amid light data.
When reversals fail
One down day does not change crude’s bigger picture. WTI was still up 4.98% for the week and more than 70% year to date, and it holds above its rising 200-day average with a series of higher lows intact.
History suggests $100 oil acts as a headwind rather than a mechanical sell signal, which helps explain why a one-day drop in crude can lift stocks without resolving the bigger picture.
If oil rebounds, yields climb, or major tech names disappoint, the leaders of the rebound can retreat quickly. Thin late-session liquidity can also make moves look more decisive than they are. A rally built on falling oil and yields is only as durable as those inputs, so watch crude and Treasury yields as the real test.
Earnings, the midterms and futures: what could end the range
If oil and yields set the mood, earnings are the event the market is waiting for. Election caution is what keeps conviction in check.
Earnings as the catalyst
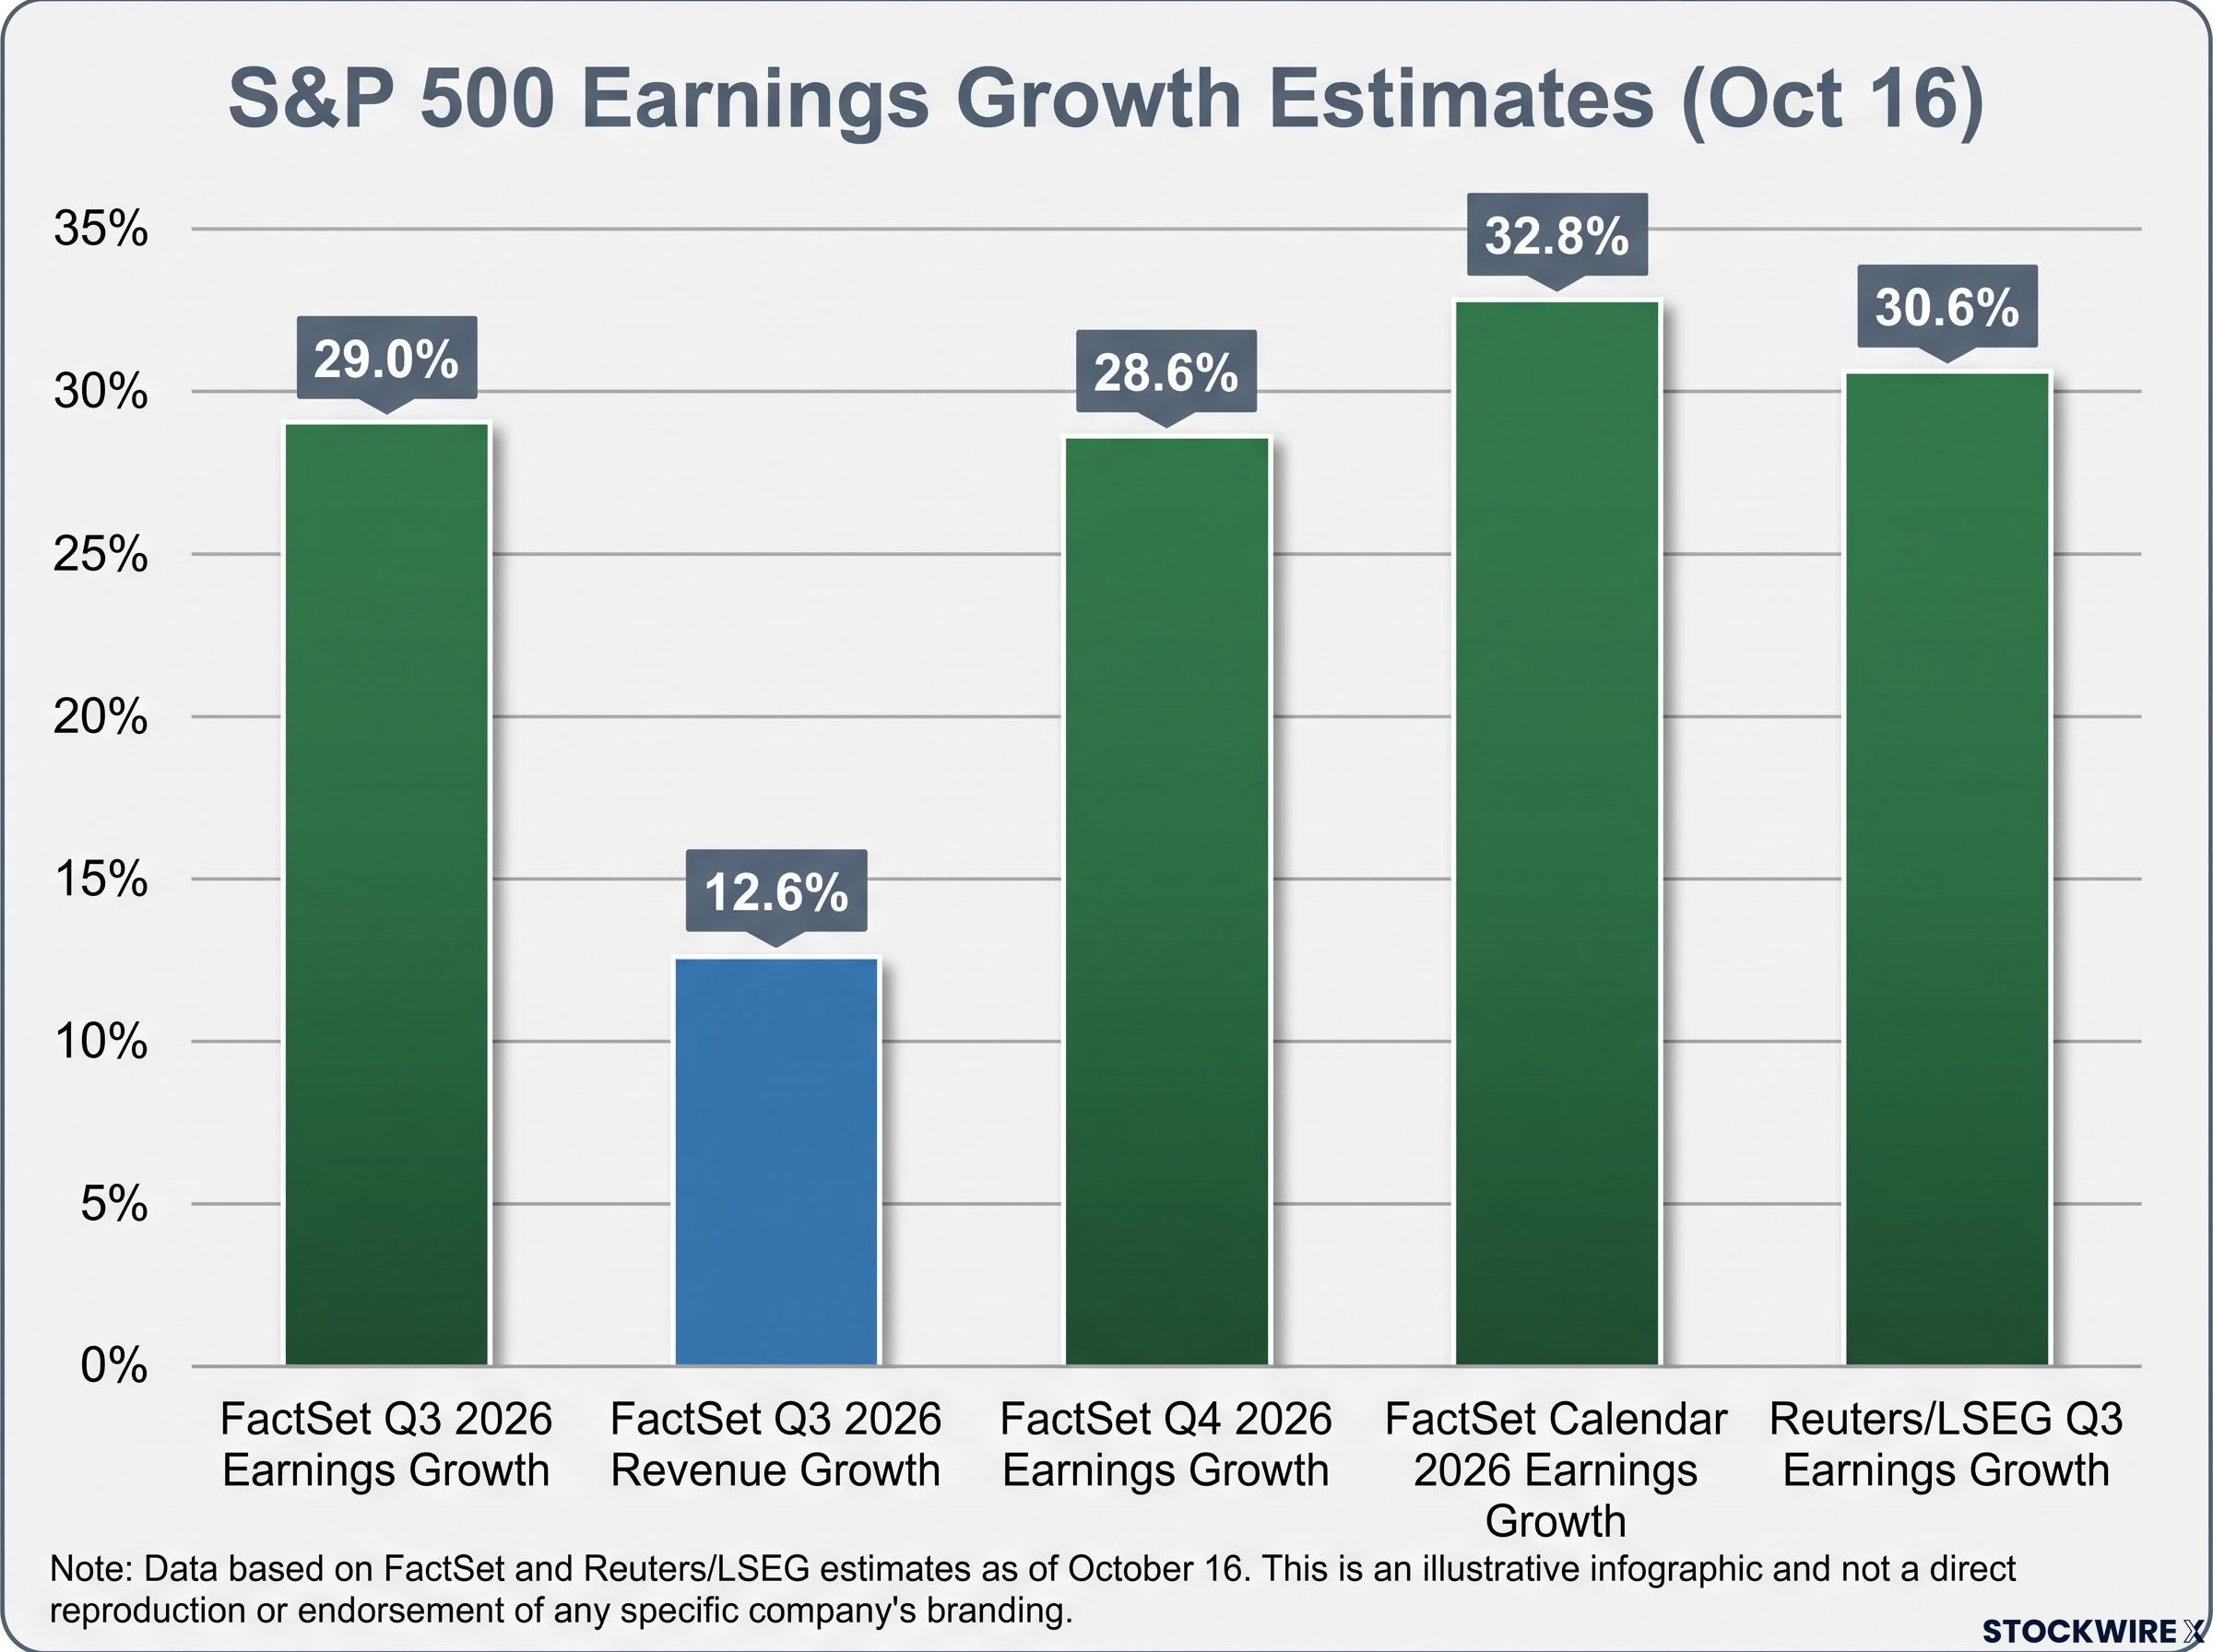
FactSet’s 16 October update put blended Q3 2026 S&P 500 earnings growth at 29.0%, with revenue growth of 12.6%. It expects 28.6% growth in Q4 and 32.8% for calendar 2026. Reuters, citing LSEG data, reported about 30.6% for Q3, using a different method and date.
That growth is concentrated in AI and mega-cap tech. The week of 19 October puts Meta Platforms and other AI-linked reporters in focus, testing whether heavy AI spending justifies current valuations. Strong forecasts are largely priced in, so judge results by guidance and market reaction rather than headline beats.
Election caution and positioning
Commentators on the original broadcast said they would avoid aggressive macro bets until results are clear, with attention fixed on the 24 hours around the vote. Major strategists are also split:
- Goldman Sachs: upgraded global equities to overweight over three months, favouring a barbell of technology and bond-like stocks, while warning midterm uncertainty could lift volatility.
- RBC Capital Markets: cut US technology to market weight and rotated towards healthcare.
- Citigroup: removed its US equity overweight after indicators reached levels historically linked to market peaks.
Polling and prediction markets lean Democratic, though these are forecasts and betting prices, not results.
| Source (forecast or betting price) | House odds (Democratic) | Senate odds (Democratic) |
|---|---|---|
| Decision Desk HQ | 77% | 56% |
| Polymarket | 91% | 65% |
| Kalshi | About 90% | About 62%-64% |
Sam Stovall of CFRA notes that fourth quarters of midterm years have averaged a 6.4% gain historically. He also warned of a possible pre-election pullback if Democrats look likely to win both chambers. Treat the odds as a volatility risk rather than a directional call. Past performance does not guarantee future results.
Options markets are pricing ordinary event risk around the vote rather than a disorderly outcome, with the VIX near 16, which supports treating the odds as a volatility factor and not a directional call.
Using futures wisely
Index futures trade outside regular hours, so they react quickly to earnings, oil and election news. That speed has limits: thin overnight trading can exaggerate moves, and the regular session often reverses the first signal.
What a sideways tape does and does not tell you before the next catalyst
A range is a decision zone, not dead air. A failed break is information, and Monday’s reversal leaned heavily on oil and yields that could easily turn back.
Earnings and the midterms are the next tests. Three signals will tell you whether the range is ending:
- A closing break of the key levels, confirmed by volume and breadth.
- Crude and Treasury yields, which decide whether the late-session rally can last.
- Guidance from large tech and AI reporters, not just headline beats.
Levels and probabilities can shift within a single session, so check them against fresh data before acting. These statements are speculative and subject to change based on market developments.
This article is for informational purposes only and should not be considered financial advice. Investors should conduct their own research and consult with financial professionals before making investment decisions.