A PE ratio told you NAB was trading at 16.3x against a sector average of 18x in May 2026. A dividend discount model (DDM) produced a valuation range of $35.74 to $51.66 on the same stock, depending on assumptions that were, in practice, invented. Both numbers feel precise. Neither tells you whether the earnings behind them are about to deteriorate.
Simple valuation models are legitimate starting points for bank stock analysis, but they capture the output of a highly complex, regulated, and cyclical business without illuminating any of the inputs. Australian major banks operate in an environment shaped by APRA capital requirements, RBA rate cycle volatility (the cash rate was cut to 3.85% in May 2025, then re-hiked to 4.35% in May 2026), and a loan book concentrated in residential mortgages. Each of these forces can move earnings materially in ways a PE multiple cannot anticipate.
This guide walks through the specific balance sheet and income statement factors that basic valuation models miss, providing a practical due diligence framework for investors who have already run their initial numbers and want to know what else to check before trusting them.
Why bank earnings are uniquely hard to take at face value
A manufacturer reports revenue, subtracts costs, and arrives at profit. A bank reports revenue, subtracts costs, then passes the result through a series of management judgements about how much to set aside for loans that might go bad, how to classify assets that are deteriorating, and how much capital regulators require it to hold. The number that emerges as “earnings” is downstream of dozens of discretionary decisions a PE ratio never interrogates.
Consider a single bad loan. At the point of origination, the bank books an expected credit loss provision based on modelled assumptions. The loan may perform for years before defaulting. The income statement reflects the provision judgement at origination and again at impairment, not the actual loss at the point it crystallises. This means bank earnings are a lagging indicator of loan book health, not a real-time one.
Morgan Stanley noted in December 2024 that “simple PE comparisons ignore differences in capital intensity, risk profiles, and sustainability of returns across the cycle.”
Even the dividend that a DDM discounts is not freely determined by the board. As UBS observed in February 2025, DDMs are “particularly sensitive to assumptions about long-run payout ratios and credit losses; for banks, dividends are ultimately constrained by APRA capital requirements.” An RBA Bulletin from December 2024 reinforced this, noting that bank payout policies have been “pro-cyclical and increasingly influenced by regulatory guidance.”
Three structural features make bank earnings uniquely opaque:
Reading a bank result requires distinguishing between metrics that reflect genuine earnings improvement and those that reflect accounting choices or capital base changes: a bank can mechanically lift ROE by shrinking its equity denominator rather than growing profits, which is why Bendigo and Adelaide Bank’s NIM of 1.90% sitting above the major bank average of 1.78% yet producing a cash ROE of only 7.9% illustrates why no single metric tells the whole story.
- The provision judgement layer: Management decides how much to set aside for expected credit losses, using models and overlays that can differ substantially between institutions reporting similar loan books.
- The NIM compression mechanism: Net interest margin (the difference between what a bank earns on loans and what it pays on deposits and funding) can shift by several basis points in a single half, moving earnings materially without any change in loan volume.
- The APRA dividend constraint: The regulator’s capital requirements set a floor on retained earnings, meaning the board cannot freely distribute profits regardless of how strong headline earnings appear.
Understanding these structural differences is the prerequisite for every analytical layer that follows.
When big ASX news breaks, our subscribers know first
What loan book growth tells you that the PE ratio does not
Loan growth is not a neutral volume metric. The same headline number can signal prudent market share gain or aggressive risk-taking, depending on which segment is growing and where the bank sits in the credit cycle.
Rapid loan book growth ahead of system can indicate loosening credit standards, particularly if concentrated in higher-risk segments. Deliberately sub-system growth, by contrast, may reflect a de-risking phase rather than competitive weakness. Across FY24, all four Australian major banks reported low-to-mid single-digit lending growth, at or below system, with management commentary consistently framing the result as margin-over-volume discipline.
| Bank | Housing loan growth | Business loan growth | Growth vs. system | Management framing |
|---|---|---|---|---|
| NAB (FY24) | 3.4% | 5.2% | Broadly in line | Preserving margins over volume |
| CBA (1H FY25) | 4.4% | 5.6% | In line (housing); above system (business) | Disciplined pricing and service |
| Westpac (FY24) | ~3% | ~4% | Below system (housing) | De-risking and remediation phase |
| ANZ (FY24) | Below system | Institutional focus | Below system (housing) | Selective on price; lower-risk transaction banking |
Two banks can report identical earnings-per-share growth, but one may have achieved it by pushing further into higher-risk borrowers while the other pruned its book. Morgan Stanley characterised NAB’s tilt toward business lending as conservative rather than risk-seeking, while Macquarie described Westpac’s below-system mortgage growth as improved risk controls post-remediation.
Three questions investors should ask when reading any bank’s loan growth disclosure:
- Is the bank growing above or below system, and in which segments?
- Has management commentary shifted toward volume language or margin language compared with the prior period?
- Is business lending growth concentrated in lower-risk transaction banking or in higher-risk commercial exposures?
Reading the provisions: what bad debt numbers actually signal
Impairment charges are where the next earnings shock is most likely to first appear. Yet two banks with identical headline charges can have very different underlying asset quality stories, depending on coverage ratios, overlay philosophy, and how they classify non-performing loans (NPLs).
Bank provisions fall into three categories. Collective provisions cover expected losses across the entire loan book, modelled statistically. Specific provisions cover individual loans already identified as impaired. Management overlays sit on top of both, reflecting the board’s judgement about risks the models may not fully capture, such as cost-of-living stress, commercial property exposure, or climate-related scenarios.
The ratio of collective to specific provisions matters as a forward-looking indicator. A bank with a high collective provision balance and significant overlays is building a buffer ahead of potential stress. A bank running lean on overlays may be reporting stronger earnings today but carrying less headroom if conditions deteriorate.
NPL classification also varies. “Non-performing” can mean different things depending on whether a bank uses a 90-plus-day arrears threshold, an “impaired” classification, or a “troublesome and impaired” measure. The trend direction matters more than the absolute level.
Credit impairment disclosures can signal fundamentally different risk profiles depending on whether the charge reflects a forward-looking management overlay or a specific loan already identified as impaired: NAB’s $706 million charge in April 2026, linked to geopolitical volatility and stress in agriculture, transport, and manufacturing, triggered a 3.6% single-day share price fall precisely because the market read it as a prospective provisioning signal rather than a clean-up of known losses.
APRA noted in December 2024 that “asset quality remains strong by historical standards,” with impaired facilities at 0.7% of total gross loans for major banks and annualised loan impairment expense at 0.09% of gross loans.
What to check in the footnotes
Investors should look at the accounting notes in annual reports for NPL classification methodology, the definition of “impaired” versus “past due,” and whether the bank has changed its classification approach between periods. Changes in classification standards can create artificial improvements or deteriorations in reported NPL ratios that have nothing to do with actual loan quality.
Against that system-level backdrop, impairment charges across the four majors rose sharply from the abnormally low FY23 base but remain historically moderate.
| Bank | Impairment charge (most recent) | Gross impaired assets (% of loans) | Year-on-year change |
|---|---|---|---|
| NAB (FY24) | $528M | 0.72% | From write-backs of $158M in FY23 |
| CBA (1H FY25) | $496M | 0.54% (of credit risk-weighted assets) | Up from $276M in 1H FY24 |
| Westpac (FY24) | $671M | 0.74% | Up from $274M in FY23 |
| ANZ (FY24) | $521M | 0.65% | Up from $133M in FY23 |
JPMorgan noted that CBA maintains “the highest coverage ratios in the sector,” while Macquarie flagged that Westpac has “less headroom than CBA if conditions deteriorate.” Citi described ANZ’s provisions as “comfortably above through-the-cycle levels.” APRA’s own commentary acknowledged “some deterioration evident in lower-income households and small business borrowers,” calibrating where stress is building even as system-wide metrics remain contained.
Understanding coverage ratios and overlay buffers tells an investor whether a bank is getting ahead of potential credit stress or running lean on reserves.
Funding mix and the risk retail investors most commonly overlook
Banks fund themselves from two primary sources: customer deposits and wholesale debt markets. The balance between these two sources determines how exposed a bank’s earnings are to global credit conditions, currency movements, and investor sentiment, none of which appear in a PE screen.
Customer deposits are relatively stable. They reprice slowly, and depositors rarely withdraw in large volumes outside a crisis. Wholesale debt is different. It must be refinanced at maturity, often in global capital markets where pricing reflects conditions entirely unrelated to the Australian economy. When credit spreads widen or risk appetite contracts, wholesale funding costs can spike quickly.
Two regulatory metrics capture this risk. The Net Stable Funding Ratio (NSFR) measures whether a bank has enough stable funding to cover its assets over a twelve-month stress horizon; a ratio above 100% means it does. The Liquidity Coverage Ratio (LCR) measures whether a bank holds enough high-quality liquid assets to survive a 30-day stress scenario.
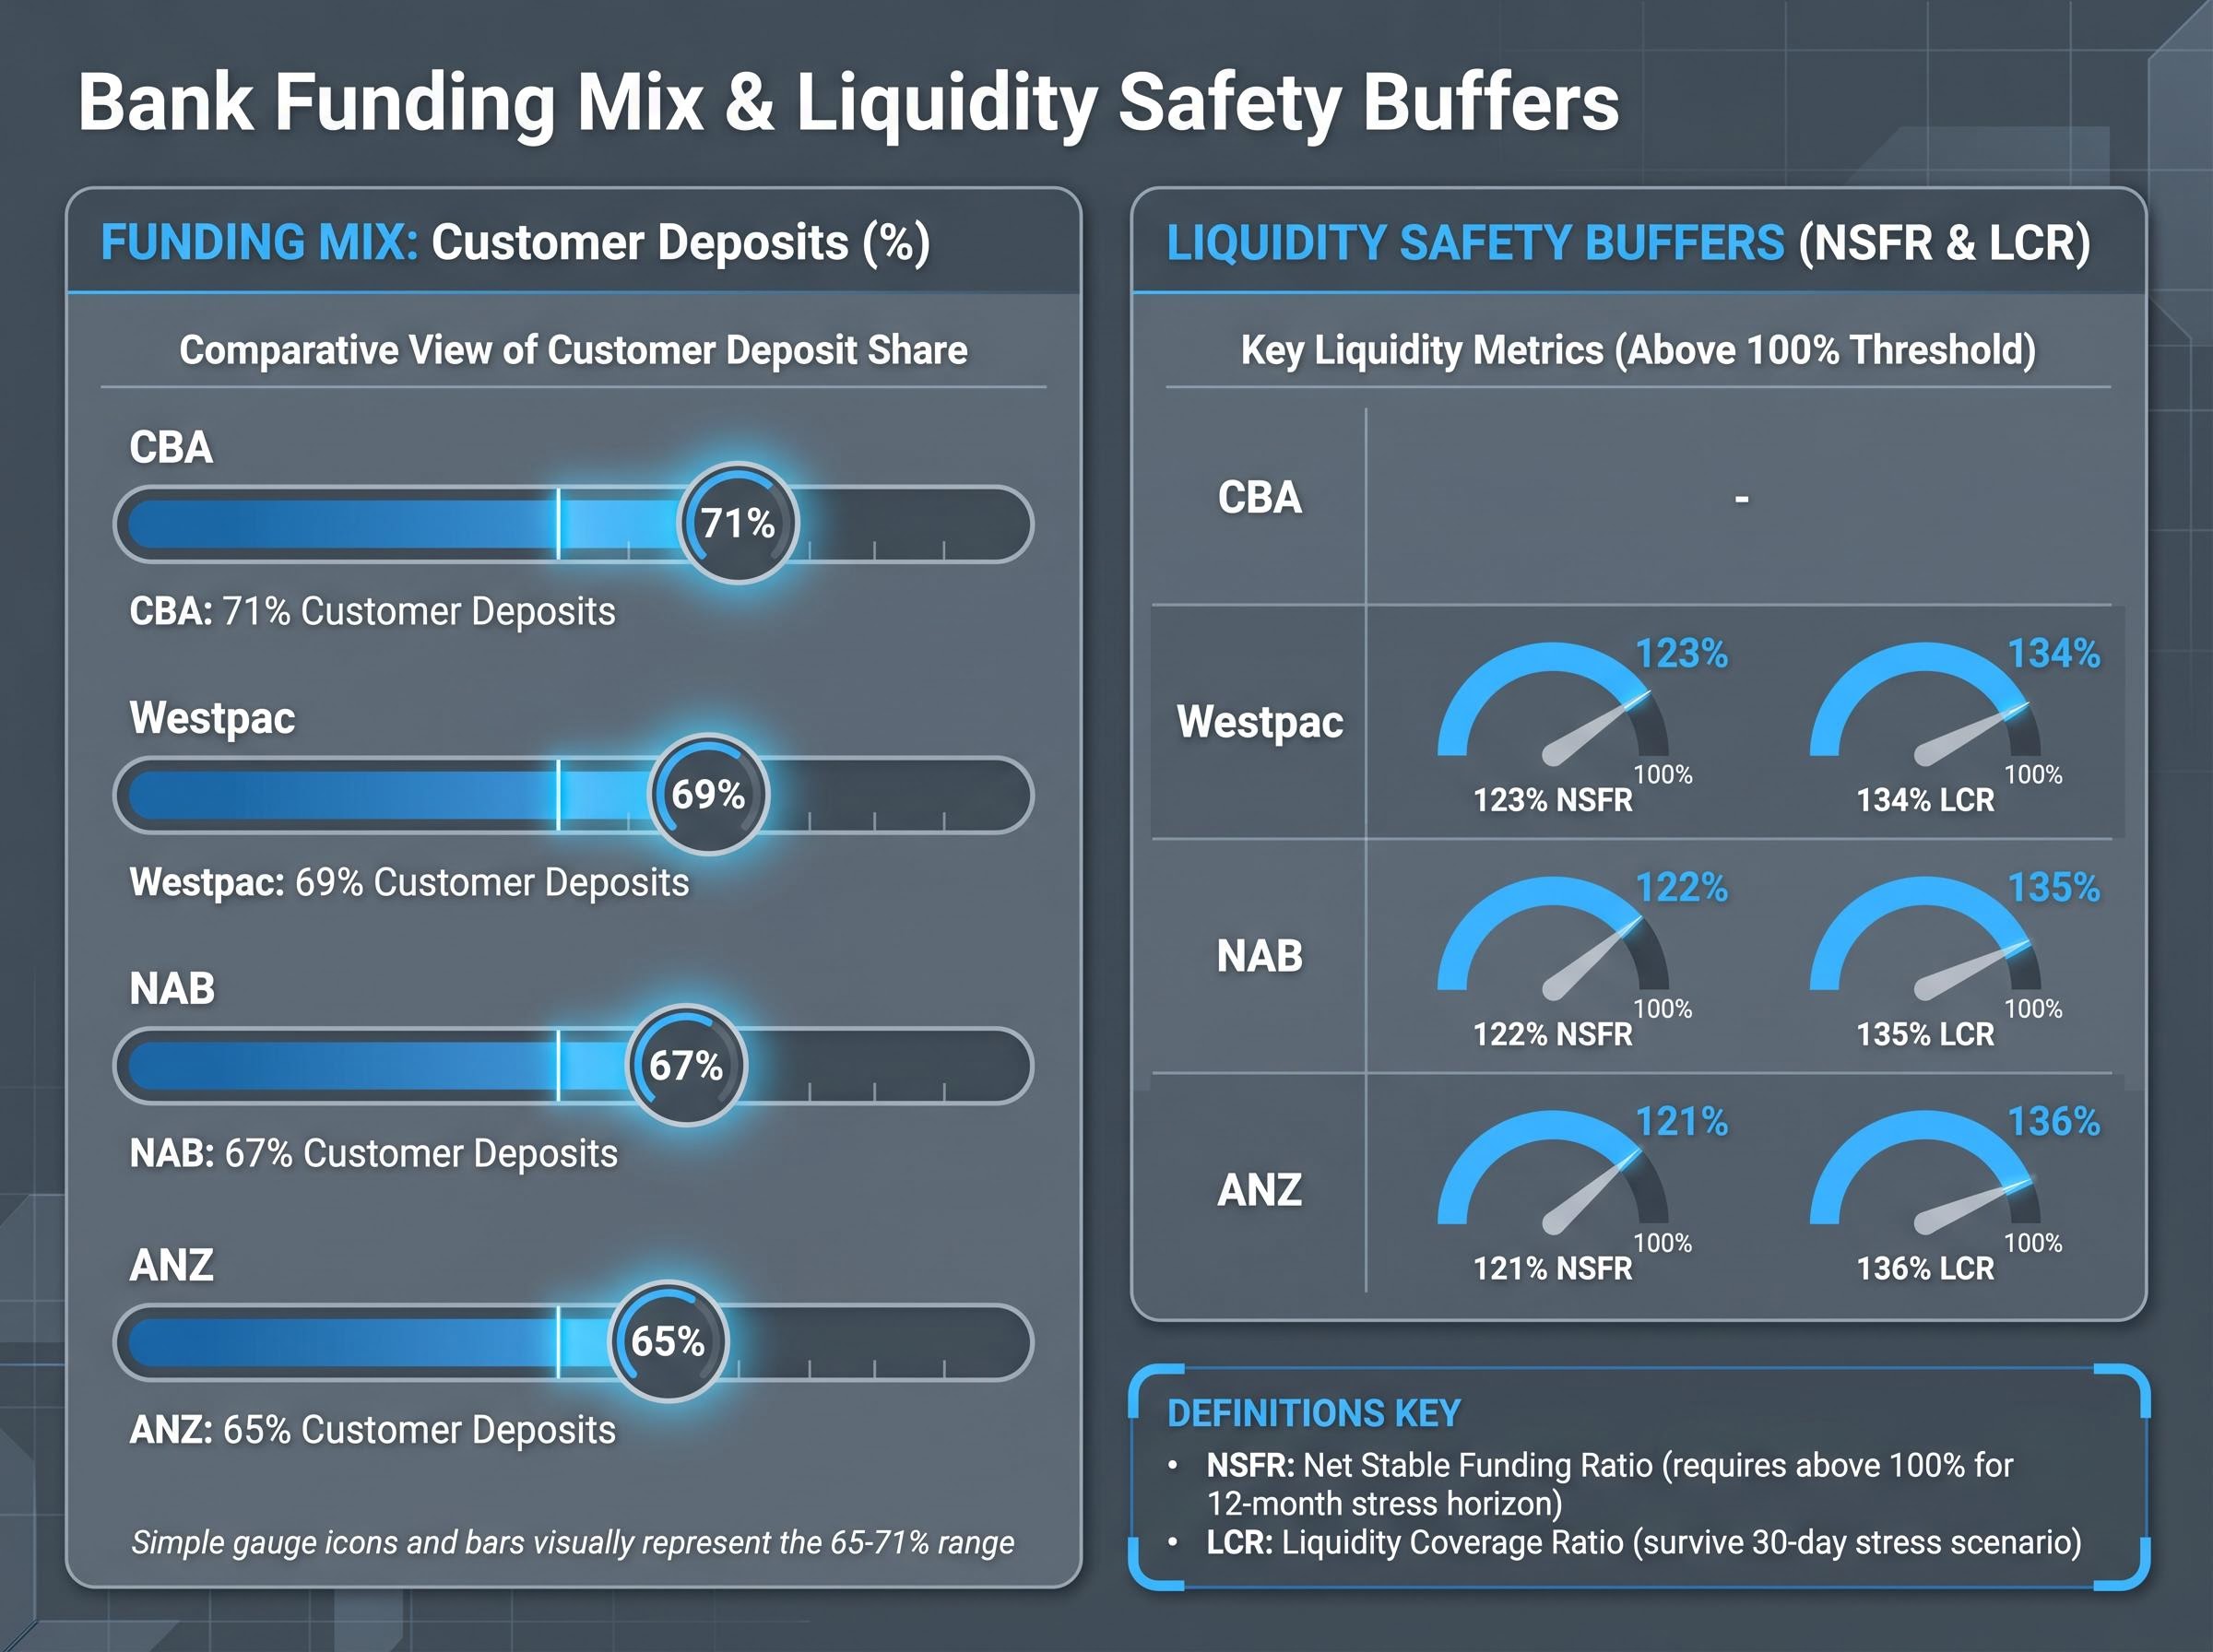
| Bank | Customer deposits (% of funding) | NSFR | LCR |
|---|---|---|---|
| CBA | 71% | Not separately stated | Not separately stated |
| Westpac | 69% | 123% | 134% |
| NAB | 67% | 122% | 135% |
| ANZ | 65% | 121% | 136% |
A six-percentage-point gap in deposit share between CBA at 71% and ANZ at 65% translates into meaningfully different earnings sensitivity when wholesale credit spreads blow out. UBS described CBA as “least exposed to wholesale funding volatility” among the majors.
Wholesale funding exposure varies meaningfully across the Big Four, with ANZ carrying approximately 30% of its funding from wholesale markets versus CBA’s 26%, a gap that translates directly into earnings sensitivity whenever global credit spreads widen or risk appetite contracts in ways unrelated to domestic economic conditions.
The Term Funding Facility (TFF), the RBA’s pandemic-era programme that provided cheap funding to all four majors, has now fully rolled off. The RBA’s Financial Stability Review (October 2024) warned that “the transition from the RBA’s Term Funding Facility to more expensive wholesale funding will weigh on margins.” AFR reporting from March 2025 confirmed the majors are rolling into higher-cost term issuance, “raising the sensitivity of margins to further rate volatility.”
The RBA Bulletin analysis of bank funding in 2024 documents how the Term Funding Facility roll-off contributed to rising wholesale funding costs and declining net interest margins across the major banks, providing a detailed breakdown of the structural cost shift that distorts year-over-year earnings comparisons for all four majors.
Three questions investors should ask about any bank’s funding profile:
- What share of total funding comes from customer deposits, and is it rising or falling?
- What is the average tenor of wholesale debt, and how much matures in the next twelve months?
- How has the post-TFF cost trajectory affected the bank’s reported NIM compared with its pre-pandemic baseline?
How interest rates reshape bank earnings in ways static models cannot follow
Higher rates affect banks through two opposing forces simultaneously. On one side, floating-rate loan yields rise, boosting revenue on the asset book. On the other, funding costs increase as wholesale markets reprice and depositors switch savings into higher-rate term products. The net effect depends on a variable called deposit beta: the speed and completeness with which a bank passes rate increases through to depositors. Banks with a higher share of transaction accounts and at-call deposits tend to have lower deposit betas, meaning they retain more of the rate benefit. Banks competing aggressively for term deposits pass more of the benefit through.
The RBA’s Statement on Monetary Policy (May 2025) stated: “Net interest margins have declined over the past year as higher funding costs and competition for deposits have more than offset the boost from higher interest rates on assets.”
That compression played out across all four majors during FY24 and into 1H FY25.
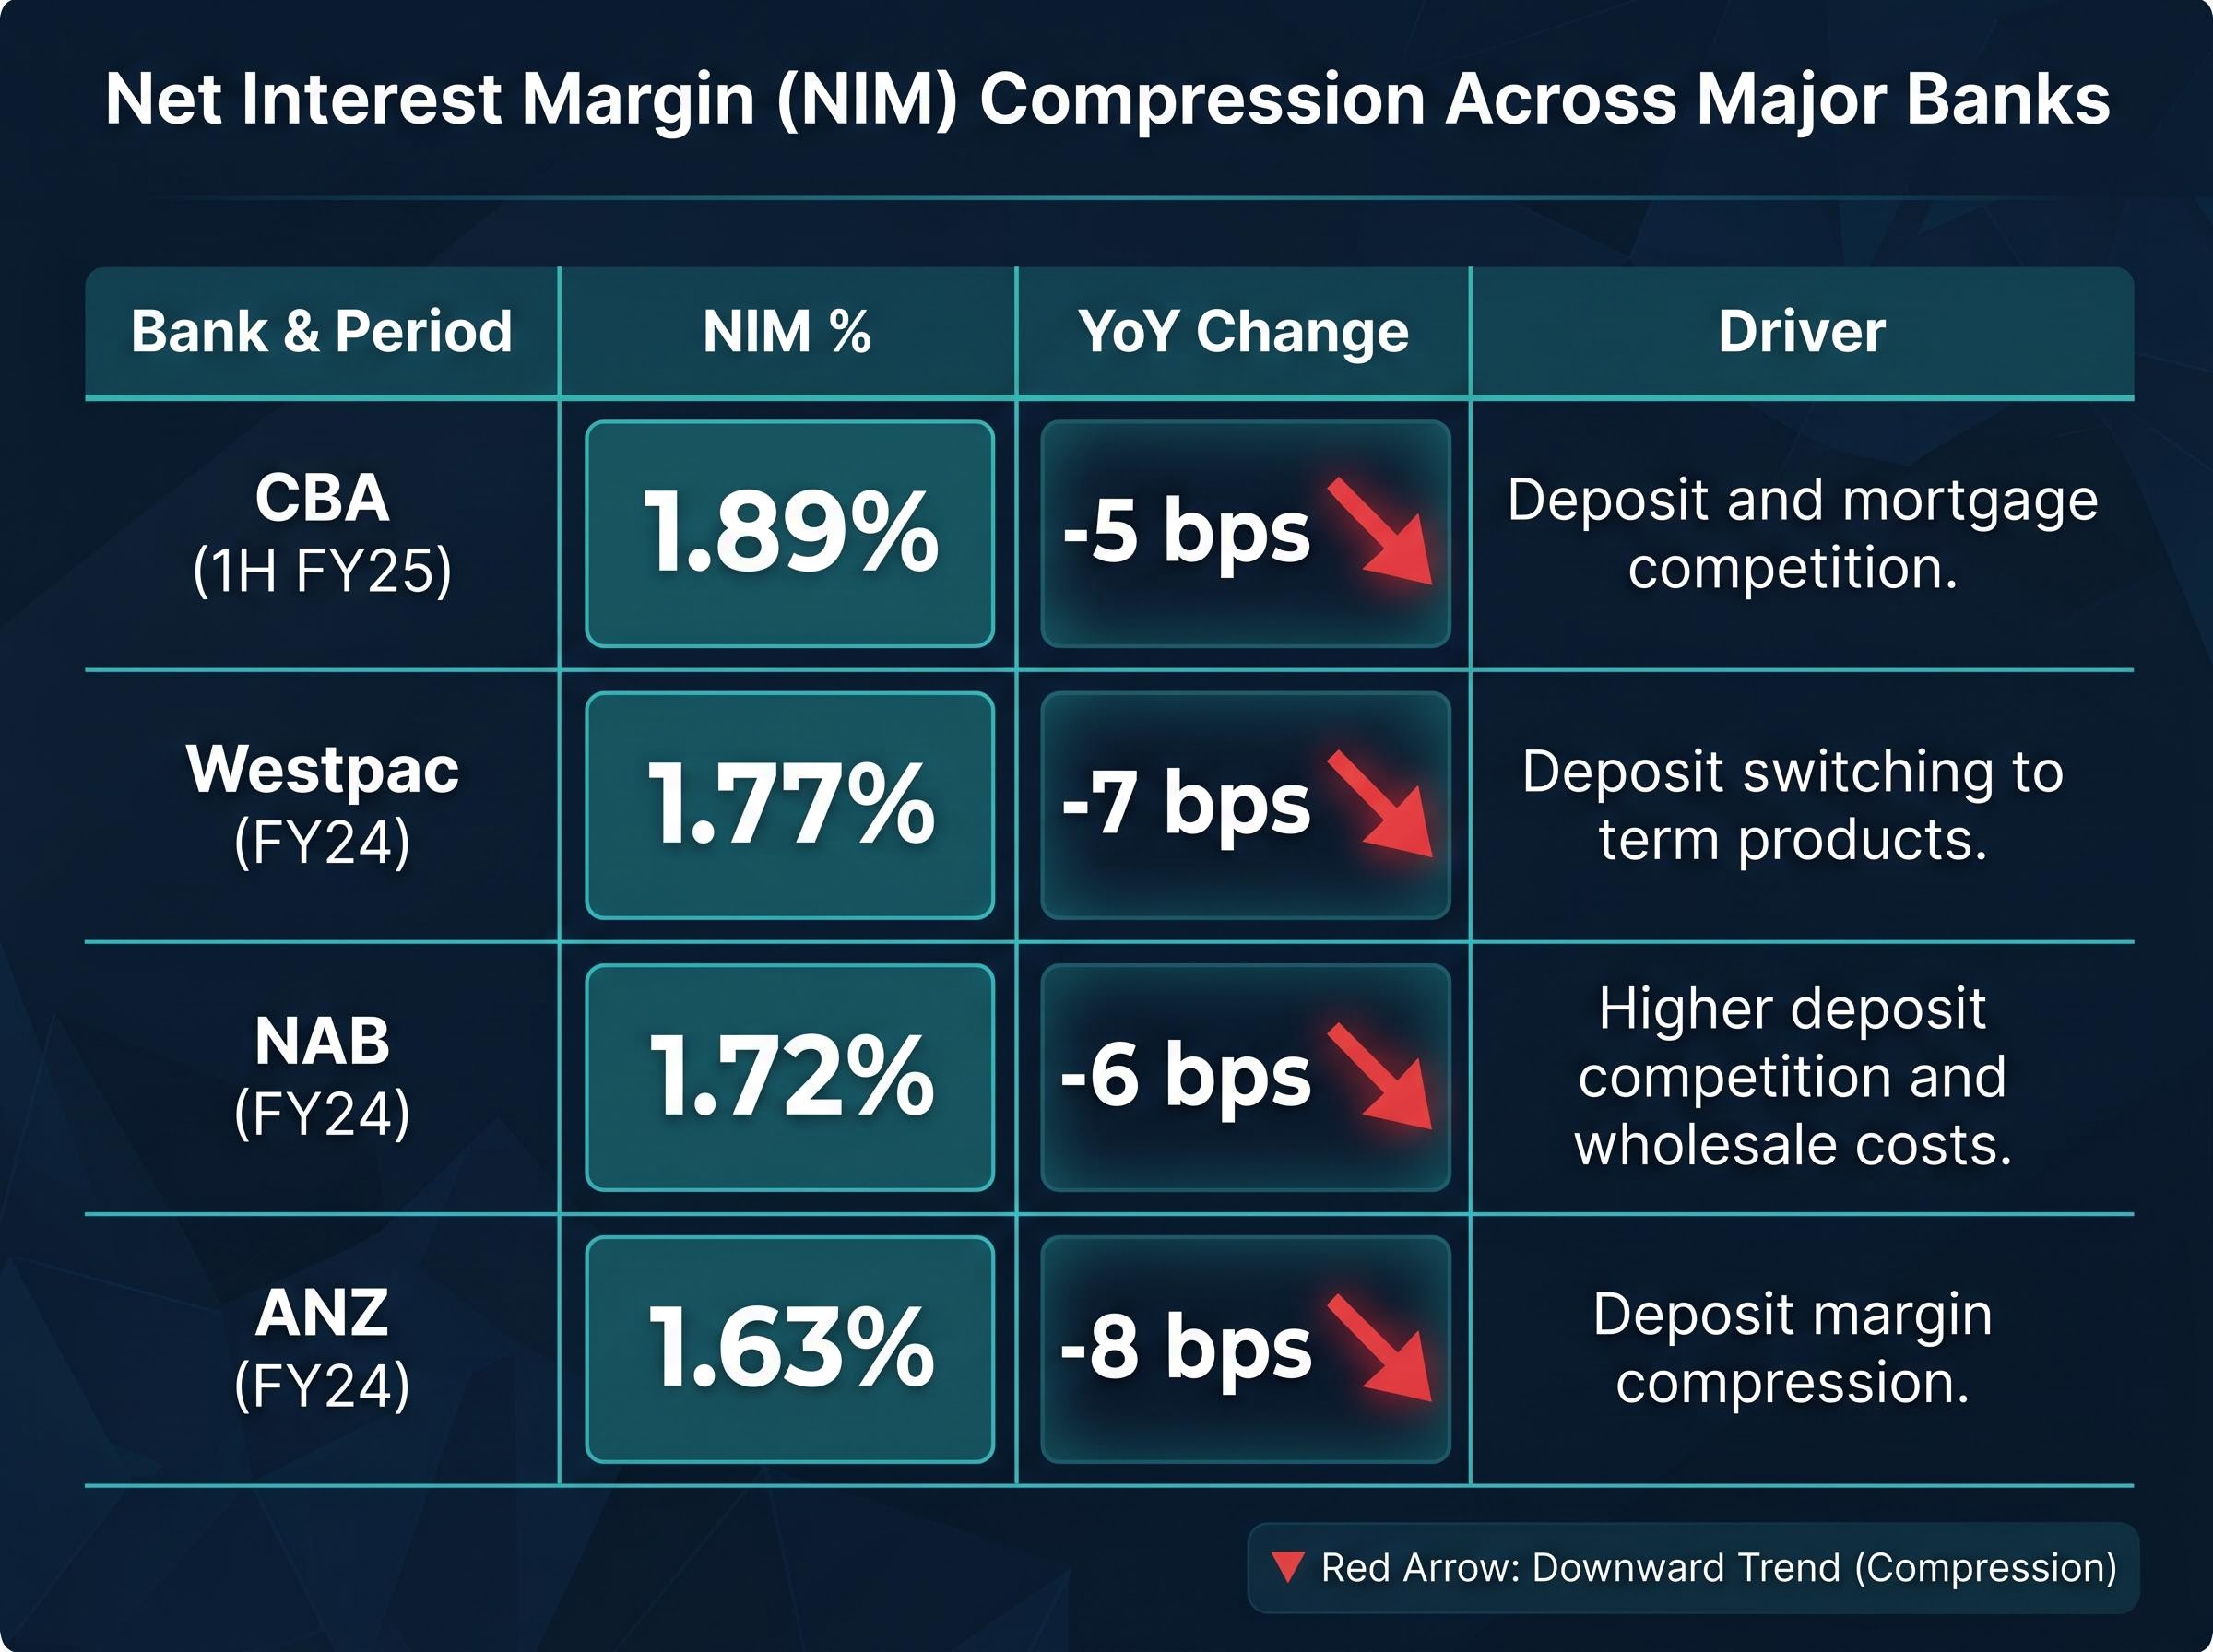
| Bank | Most recent reported NIM | NIM change (bps, YoY) | Primary driver cited |
|---|---|---|---|
| CBA (1H FY25) | 1.89% | -5 bps | Deposit and mortgage competition |
| Westpac (FY24) | 1.77% | -7 bps | Deposit switching to term products |
| NAB (FY24) | 1.72% | -6 bps | Higher deposit competition and wholesale costs |
| ANZ (FY24) | 1.63% | -8 bps | Deposit margin compression |
These NIM trajectories occurred while the cash rate sat at broadly similar levels to today, but the path taken by rates between those points changed deposit behaviour, funding costs, and arrears trends in ways that make point-in-time NIM figures unreliable inputs for any static valuation. The RBA cut to 3.85% in May 2025, then re-hiked to 4.35% in May 2026, a sequence that no DDM or PE model built twelve months ago could have anticipated.
As AFR summarised in March 2025: “The easy part of the rate-hiking dividend for banks is over.” Rate sensitivity analysis is not optional for bank investors; it is the difference between a valuation assumption that holds and one that breaks within a single reporting period.
The next major ASX story will hit our subscribers first
A practical due diligence checklist for bank investors going beyond the PE ratio
The analytical layers above translate into a repeatable framework. The following six checks, each targeting a specific risk dimension that PE and DDM models cannot capture, can be run against any bank’s results pack using publicly available data.
- ROE versus cost of equity. Return on equity (ROE), the profit a bank generates relative to its shareholders’ equity, is a more relevant valuation anchor than near-term PE, according to Morgan Stanley’s December 2024 banks review. A bank trading at a PE discount but delivering ROE below its cost of equity may not be cheap; it may be destroying value. Find it in the financial summary section of the results announcement.
- Price-to-book versus forward ROE. AFR’s Chanticleer column (April 2024) recommends plotting price-to-book (P/B) against forward ROE. A low P/B with low ROE is a value trap, not a bargain. Forward ROE consensus estimates are available through broker research and financial data platforms.
- NIM sensitivity under different rate scenarios. Analysts model NIM under rising, stable, and falling rate assumptions rather than treating the current NIM as sustainable. Check the bank’s own NIM sensitivity disclosures in the results presentation slides.
- 90-plus-day arrears trend and NPL coverage ratio. Track the direction of arrears by segment (housing, business, personal) and measure provision coverage as a multiple of NPLs. Both are disclosed in the asset quality section of the results announcement.
- CET1 ratio versus APRA benchmarks. The Common Equity Tier 1 (CET1) ratio measures a bank’s core capital as a percentage of risk-weighted assets. Compare each bank’s reported CET1 against APRA’s “unquestionably strong” benchmark and the bank’s own target range. The RBA’s Financial Stability Review (October 2024) noted that CET1 ratios of the majors remain “well above minimum requirements,” affecting dividend capacity and resilience.
- Deposit share, NSFR, and LCR. Review the funding composition table in the results announcement. Compare deposit share across peers and check that both the NSFR and LCR remain comfortably above 100%.
The APRA quarterly ADI performance statistics publish system-wide CET1 ratios, impaired asset levels, and loan impairment expense data for all authorised deposit-taking institutions, giving investors a direct benchmark against which to assess any individual bank’s reported capital and credit quality figures.
CBA consistently trades at a PE premium to its peers. That premium is not irrational when these deeper metrics are applied: its higher deposit share, higher coverage ratios, and higher ROE are all visible in this framework.
Australian-specific factors that weaken standard valuation assumptions
Four conditions unique to the Australian banking context make imported valuation frameworks from US or European equity analysis unreliable without adjustment:
- APRA capital overlays: APRA’s “unquestionably strong” CET1 requirement, and its ability to impose additional capital charges, creates regulatory uncertainty around dividend sustainability that DDMs cannot easily model.
- High mortgage concentration: Australian major banks are unusually concentrated in residential mortgages relative to international peers, creating correlated credit risk if housing prices fall and arrears rise simultaneously.
- RBA rate path volatility: The cash rate cut to 3.85% followed by a re-hike to 4.35% within twelve months illustrates how quickly the rate environment can shift, invalidating static NIM assumptions embedded in either PE-based earnings forecasts or DDM discount rates.
- Term Funding Facility roll-off: The end of cheap pandemic-era RBA funding has permanently shifted the cost structure of wholesale funding for all four majors, a structural change that distorts year-over-year earnings comparisons.
The headline number is only the beginning
The PE ratio and DDM are not wrong tools so much as incomplete ones. They produce a starting figure, not a verdict. The analytical work outlined in this guide, from loan book composition through provisioning philosophy, funding mix, and rate sensitivity, is what separates a valuation from a conviction.
All of the data required for this deeper analysis is publicly available. ASX results announcements, APRA quarterly statistics, and RBA Financial Stability Reviews provide every metric covered above, meaning no specialist access is required.
The FY24 and 1H FY25 figures referenced throughout this article are now approximately two reporting seasons old. Investors should check the most recent available results for each bank, including FY25 full-year results and 1H FY26 half-year results, available from each bank’s investor relations page, and supplement with APRA quarterly releases published through at least March 2026.
The discipline of going deeper is itself a form of risk management. An investor who runs these six checks alongside a PE or DDM screen will not eliminate uncertainty, but will have a materially more complete picture of whether a bank’s headline valuation number reflects genuine opportunity or hidden risk.
For investors who have worked through the six checks above and want to stress-test their conclusion against the strongest bearish case, our full explainer on NAB share valuation examines why 14 analyst price targets for NAB span $29.00 to $48.50 from identical inputs, and walks through the seven qualitative dimensions, including management credibility, loan-book discipline, and franking credit eligibility, that determine whether the quantitative framework produces a conviction or an illusion.
This article is for informational purposes only and should not be considered financial advice. Investors should conduct their own research and consult with financial professionals before making investment decisions. Past performance does not guarantee future results. Financial projections are subject to market conditions and various risk factors.