The US government just spent billions of dollars buying back its own bonds, many of them issued years ago at a steep discount to what they now cost, and the financial press reported it as reassuring news. That framing sits oddly with what most people assume a bond buyback means.
The context is a bond market under real pressure. In August 2026, the Treasury expanded its long-end buyback programme just as the 30-year yield touched 5.327% on 18 August, a 19-year intraday high. Tens of millions of Americans hold bond exposure through target-date retirement funds without ever choosing a single bond, which makes the mechanics of this programme personal rather than merely macroeconomic.
Here is what you will actually get from reading this: a clear picture of what the Treasury is doing, why bond prices fell, whether anything in your own retirement account needs attention, and who quietly benefits from this rate environment. No panic, no jargon, just the plumbing explained.
What the Treasury is actually doing when it buys back its own bonds
The instinctive read is that a government buying back its own debt must be in trouble, scrambling to prop up a broken market. That read is wrong, and understanding why is the whole point.
The US Treasury bond buyback program runs two distinct operations, and neither is a rescue. According to Treasury and Treasury Borrowing Advisory Committee (TBAC) materials, the operations are regular, publicly scheduled, and explicitly not aimed at acute market stress.
- Liquidity support: Buybacks of older, less-traded “off-the-run” securities across maturity buckets such as the 10-20-year and 20-30-year nominal coupons, plus TIPS. Conducted once or twice a week, the goal is to narrow bid-ask spreads, improve price discovery, and free up dealer balance sheets to trade the newest benchmark bonds.
- Cash management: Buybacks of short-dated bills, roughly one month to two years, concentrated around major tax dates in mid-April, mid-June, mid-September, and mid-December. The purpose is to smooth swings in the Treasury’s cash balance.
The scale tells you this is maintenance, not emergency intervention. Since the programme began in May 2024, the Treasury conducted 85 buyback operations and purchased $228.3 billion in par value after being offered over $1 trillion, as of 19 September 2025.
The Treasury Securities Buybacks dataset published by Fiscal Data confirms both the liquidity-support and cash-management classifications, and provides the historical operation-by-operation records that show the programme’s scale and scheduling cadence since May 2024.
In July 2025, it raised the quarterly liquidity-support ceiling from $30 billion to $38 billion and the annual cash-management ceiling from $120 billion to $150 billion. In the February to April 2026 quarter, roughly $17.5 billion went to liquidity support and $74.7 billion to cash management. The August 2026 expansion increased specific long-end operation sizes, with Reuters estimating at least $14 billion in additional liquidity support for the September-November window.
That combination of modest sizing and pre-announced scheduling is the signal. The Treasury is managing its debt plumbing, not plugging a burst pipe, and reading these announcements as a fiscal crisis would be a genuine misinterpretation.
How today’s programme compares to the last time Treasury did this
The most direct precedent ran from March 2000 to April 2002, when the Treasury retired $67.5 billion of long-term debt across 45 operations, targeting bonds with 10 or more years to maturity. The context back then was budget surpluses; the Treasury was deliberately shrinking a shrinking debt.
Today’s context is the reverse: elevated deficits and a focus on keeping the market liquid rather than paying debt down. The same tool serves different purposes in different fiscal weather, which is exactly why you cannot read the mere existence of buybacks as good news or bad news on its own.
| Program Period | Total Purchased | Operations Count | Primary Goal |
|---|---|---|---|
| March 2000 to April 2002 | $67.5 billion (long-term debt) | 45 | Deliberate debt retirement during budget surpluses |
| May 2024 to September 2025 | $228.3 billion (par amount) | 85 | Liquidity maintenance and cash management amid deficits |
When big ASX news breaks, our subscribers know first
Why bond prices fell and what “unrealised loss” actually means
If the buybacks are routine, why are the bonds worth so much less than face value? The answer is the single most useful piece of bond maths you can learn, and it is simpler than it sounds.
Bond prices and interest rates move in opposite directions. Here is the sequence:
The arithmetic behind bond yield mechanics is purely mathematical: because the coupon is fixed at issuance, any drop in purchase price automatically pushes the effective yield higher, which is why a 2021 bond paying 2% now trades at a deep discount to face value.
- A 30-year bond issued around early 2021 carried a coupon near 2%, meaning it pays 2% a year on its face value.
- By mid-August 2026, new 30-year bonds cleared at yields around 5.216% to 5.327%, so a fresh bond pays more than twice the income.
- Nobody will pay full price for the old 2% bond when a new one pays 5%, so the old bond’s market price falls to a discount that makes its lower income competitive.
That discount is what shows up as a red number on a bond fund. And here is the distinction that matters most: it is an unrealised loss, a paper decline that only becomes real money lost if you sell.
The rate backdrop On 18 August 2026, the 30-year Treasury yield touched 5.327%, its highest intraday level since 2007. That is the environment the buybacks are operating in.
Hold a discounted bond to maturity and you get your full principal back, plus every coupon along the way. Sell it early and you lock in the discount as an actual loss. The total return from holding to maturity versus selling and reinvesting works out comparably, which is precisely why a paper loss in a retirement fund is not inherently alarming.
This is not a retail-only problem, which is reassuring. Federal Reserve Chair Kevin Warsh has acknowledged that the Fed itself holds substantial unrealised accounting losses on lower-yielding bonds bought in earlier low-rate years. The same dynamic hitting your target-date fund is hitting the central bank’s balance sheet. It is a feature of rising rates, not a sign anyone mismanaged anything.
So when you see a negative figure on your 401(k) bond sleeve, no money has actually been lost yet. It only becomes permanent if you sell, and most retirement savers are never forced to.
What you probably own in your 401(k) right now, and how it is affected
Abstract bond maths lands differently when you see it sitting inside the fund you likely already own. Target-date funds are built as glide paths: the closer you get to the target year, the more the fund shifts from stocks into bonds to reduce risk. That means bond exposure is not the same across every vintage.
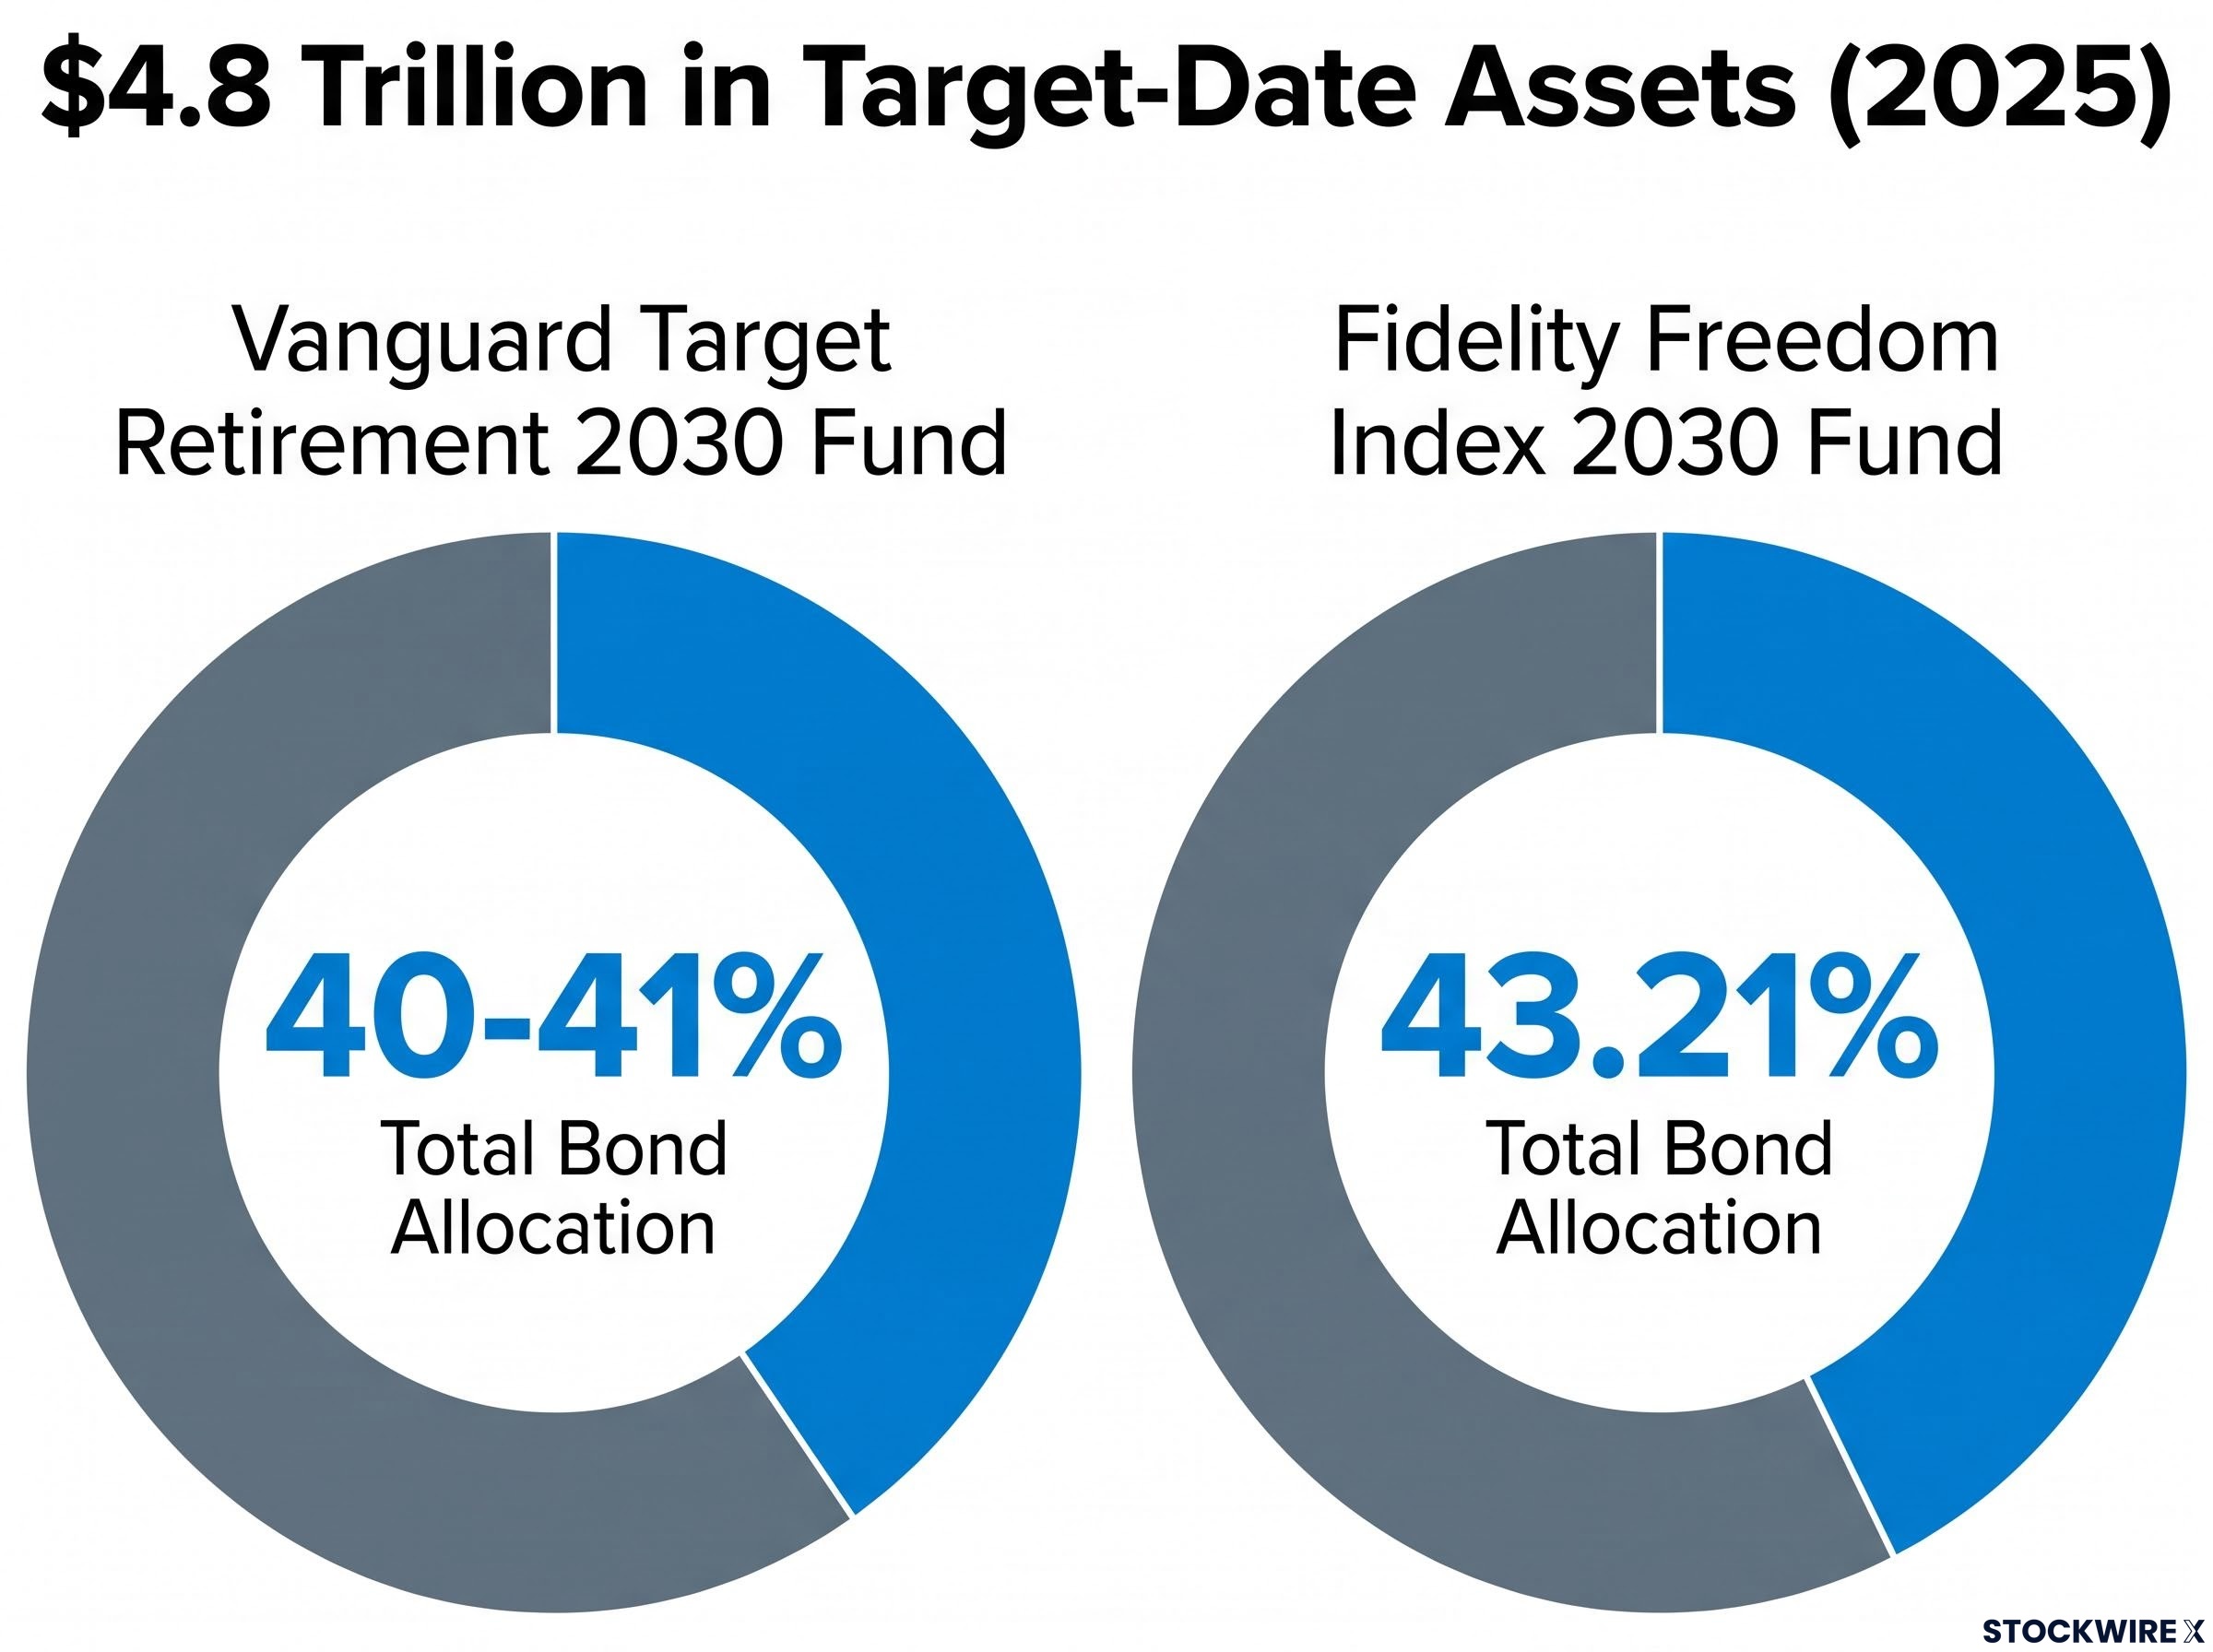
These funds are where most retirement money now lives. Total assets in target-date strategies reached $4.8 trillion in 2025, up 20.3% on the prior year, with Vanguard alone managing around $1.8 trillion, roughly 37% of the entire category.
For someone four to five years from retirement, a 2030-vintage fund carries serious bond weight.
| Provider | Fund Name | Total Bond Allocation | Notable Fixed-Income Components |
|---|---|---|---|
| Vanguard | Target Retirement 2030 Fund | Approx. 40-41% | 28.4% Total Bond Market index, 11.9% Total International Bond index |
| Fidelity | Freedom Index 2030 Fund | Approx. 43.21% | 27.71% US investment-grade, 3.59% long-term Treasuries |
That 40-43% figure is the point. For a 2030 holder, the current rate environment is not distant background noise; it is directly shaping nearly half of the portfolio’s near-term value.
Bond duration is the single fund-sheet number that translates an interest rate move into a precise dollar loss: a fund with duration 17 loses roughly 17% of its value for every 1 percentage-point rise in rates, a figure that matters sharply when 40% of a 2030-vintage portfolio sits in fixed income.
The real threat is not the price drop itself. It is something called sequence-of-returns risk, and it is worth understanding plainly.
- What it is: The danger of being forced to sell holdings while they are down, locking in a loss instead of holding through to recovery.
- When it bites: Early in retirement, when you begin drawing money out during a market drawdown rather than adding to your balance.
- Who is most exposed: Recent or near-term retirees who need to sell bonds to fund living costs before prices recover.
For context, near-dated vintage drawdowns in stressed periods have ranged from about -4.3% to -12.98%, with a median near -10.38%. During the 2025 equity drawdown, the S&P 500 fell roughly 18.6% peak to trough while a typical 2025 target-date fund lost around 7.6%, a reminder that the bond allocation cushions rather than amplifies the blow.
Who actually benefits when rates are high, and why patience is the default recommendation
The “high rates are bad” story is only half of what is happening. Elevated rates create real winners, and locating yourself among them changes the whole emotional register of your balance.
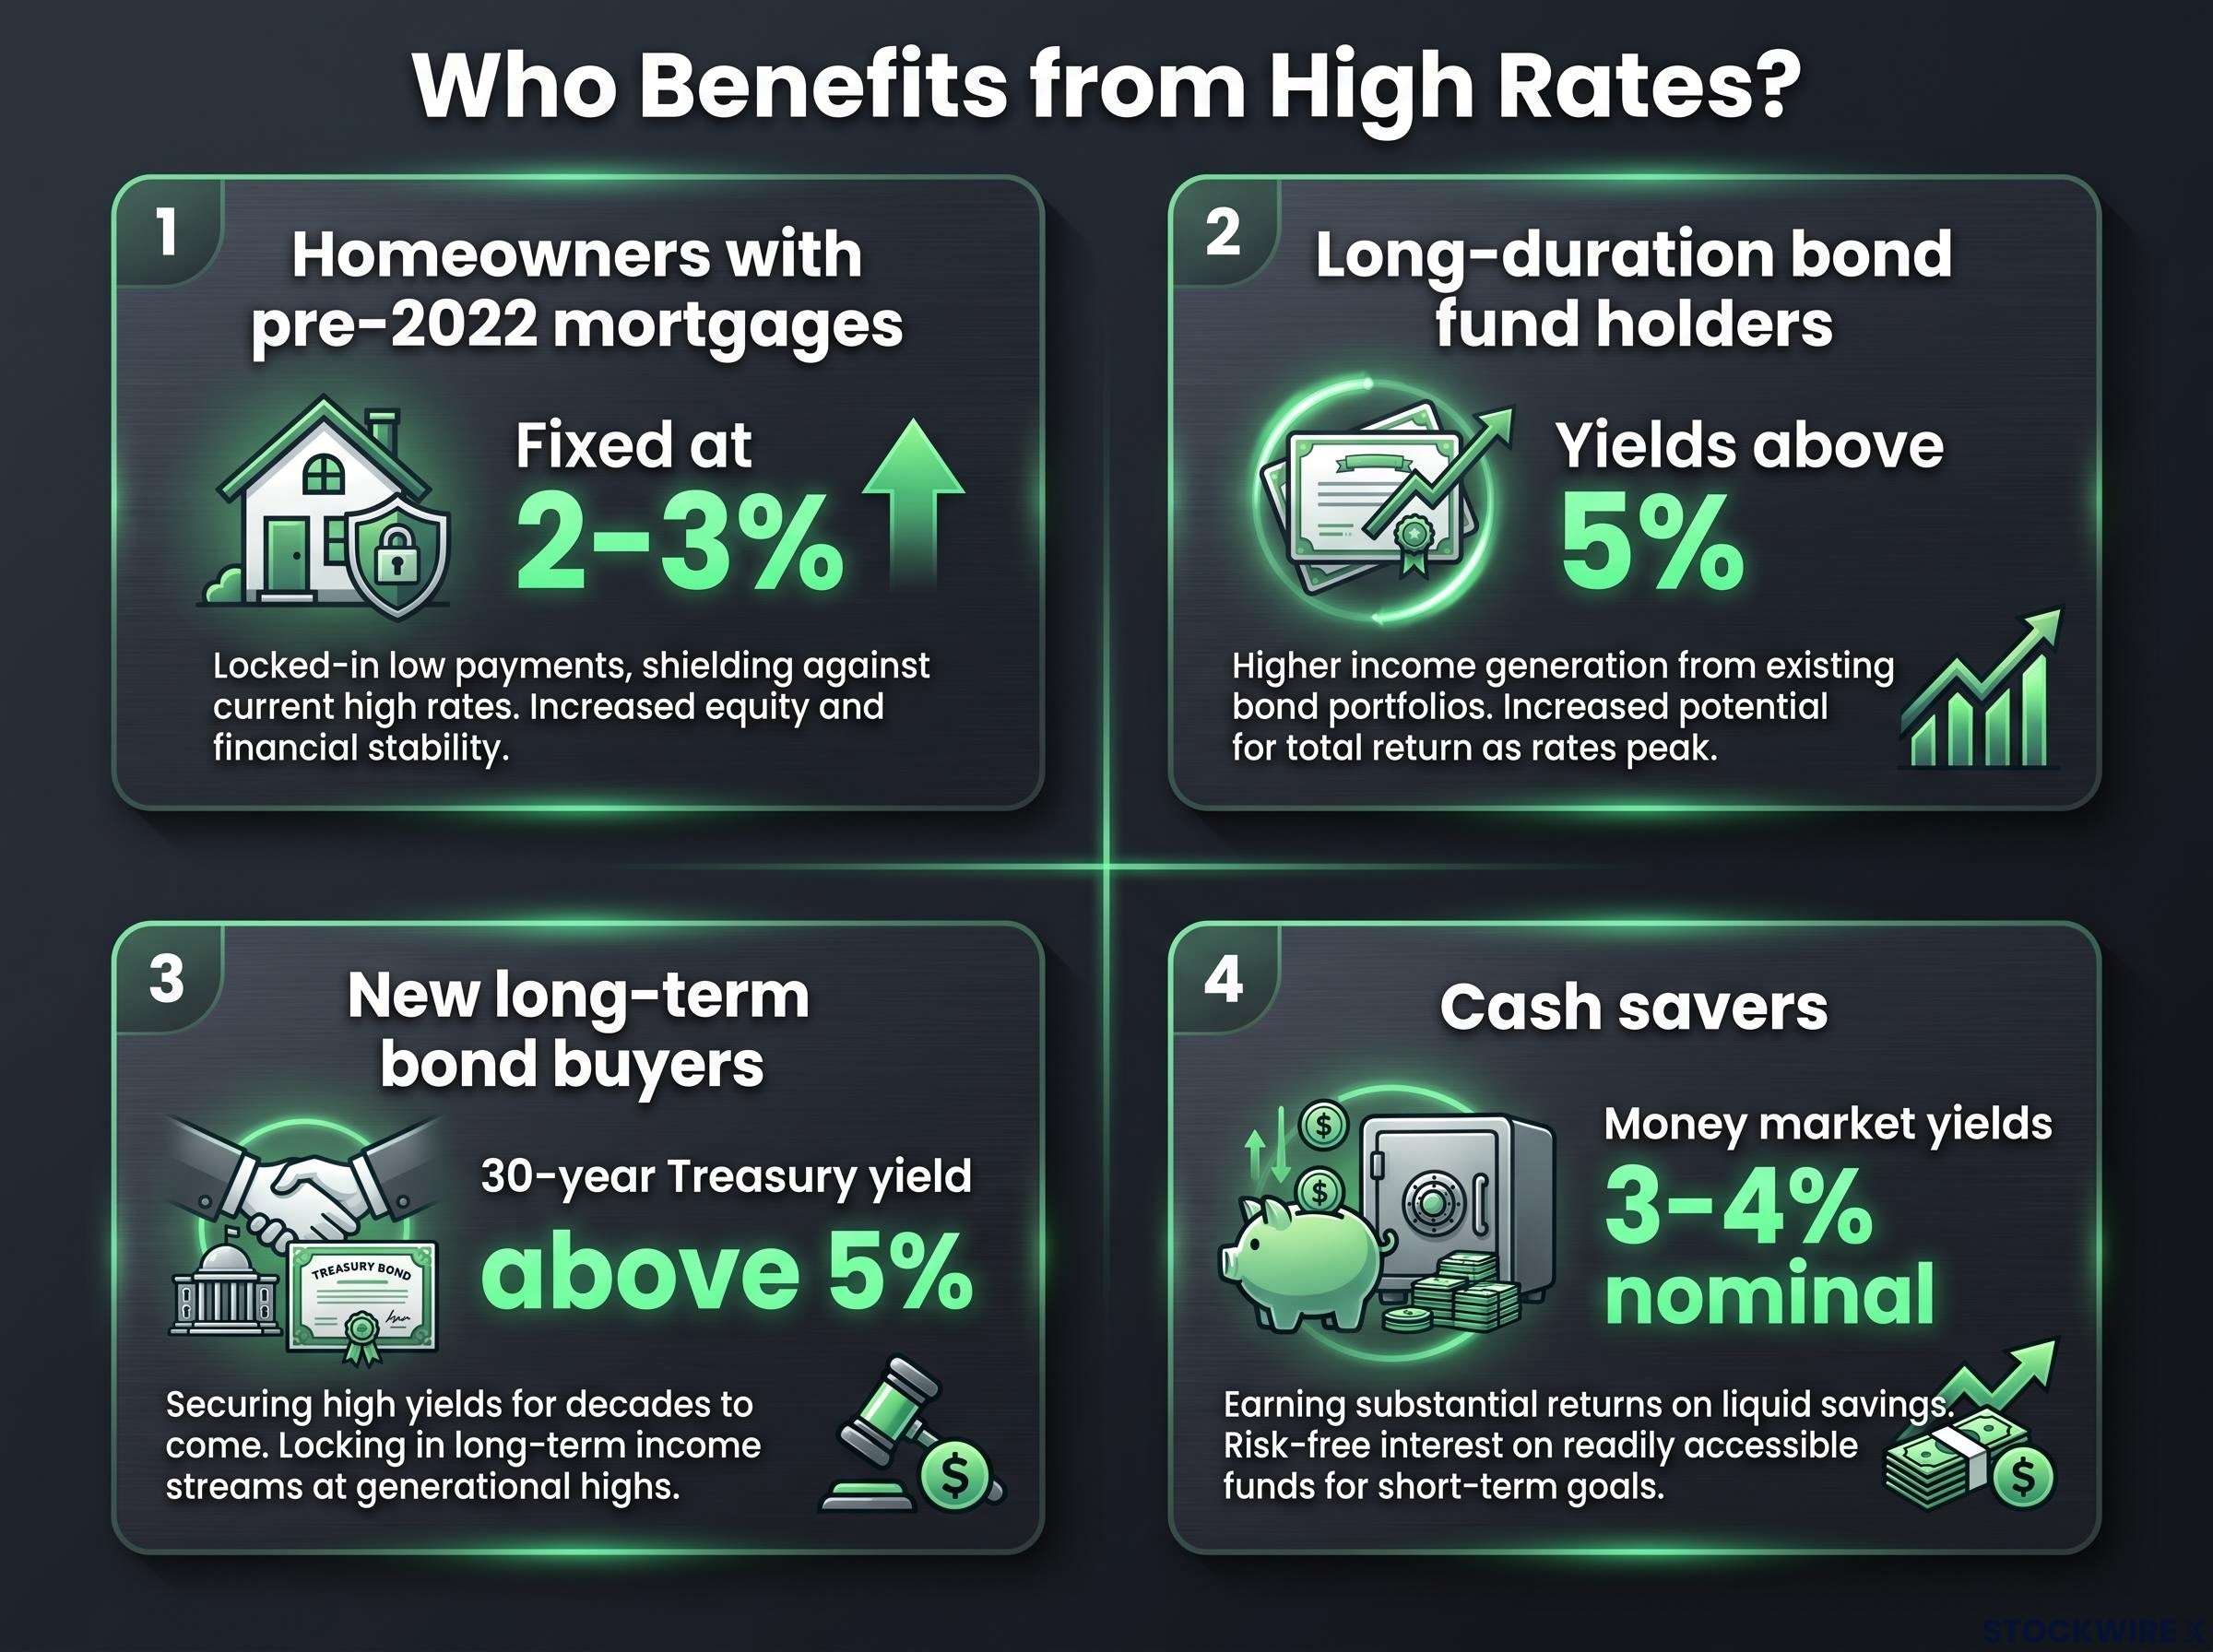
- Homeowners with pre-2022 mortgages: Anyone who locked in a fixed rate around 2-3% is paying well below current lending rates, a genuine locked-in advantage that quietly grows more valuable as rates stay high.
- Long-duration bond fund holders: Funds that fell in price still pay out interest, and current long-end yields above 5% put those distributions near or above prevailing inflation.
- New long-term bond buyers: Purchasing a 30-year Treasury today at a yield above 5% positions you favourably against historical long-horizon inflation outcomes.
- Cash savers: Money market vehicles currently yield roughly 3-4% in nominal terms, competitive on paper though offering limited real growth once inflation is subtracted.
That last point deserves honesty. A 3-4% nominal yield feels good, but if it barely keeps pace with inflation, it produces little real growth, which matters over a multi-decade retirement horizon.
The reinvestment mechanic is why specialists keep repeating the same advice.
Why patience is the default As bonds inside a fund mature, the proceeds are reinvested at today’s higher yields. Holding through the price volatility lets the fund steadily upgrade its income stream, which is the core reason specialists recommend staying put rather than reallocating in fear.
A reader who bought a long-duration bond fund at today’s yields is in a structurally different position from one who bought in 2021. Understanding that difference lets you stop applying one anxious narrative to every bond holder and instead ask the more useful question: which category am I actually in?
What the buyback expansion actually signals, and what to do with that
So does the August 2026 expansion mean anything worrying? Serious observers genuinely disagree, and the honest answer is that both readings have merit.
The routine-management view:
- The Treasury and TBAC describe the operations as regular and predictable.
- They target off-the-run liquidity, not acute stress.
- The sizes are small compared with historical Quantitative Easing.
- A 2025 IMF working paper confirms buybacks moderately narrow bid-ask spreads and lift prices for targeted securities, exactly what a liquidity tool should do.
The fiscal-stress view:
- Commentators at Reuters, ING, and JPMorgan read the doubling of long-end operations as discomfort with long-term borrowing costs.
- JPMorgan argued the buybacks treat the symptom, high yields, rather than the root cause: a roughly 6% deficit in an economy near full employment.
- The same note warned that term premia could rise further if markets read the programme as opportunistic.
- Some participants worry about longer-run debt management through inflation.
Neither camp is obviously wrong, and you do not need to settle the debate to make good decisions.
The questions that actually matter for your retirement account
The macro argument matters far less to your outcome than three questions only you can answer.
- How many years until you actually plan to withdraw this money?
- Is your fund’s glide path appropriate for that timeline?
- Are you likely to need to sell bond holdings before rates normalise?
These are not advice. They are the filter that decides whether the Treasury debate is relevant to you at all. If your horizon is long and you are not a forced seller, the interpretive battle over term premia is a spectator sport.
What this rate environment probably means for the next few years
Nobody can tell you where the 30-year yield goes next. What is useful is a calibrated sense of the plausible range and what each outcome means for a 2030-vintage holder.
- Gradual easing: If inflation cools and the Fed eases, bond prices recover and existing paper losses shrink over time. A 2030 holder sees the red numbers fade while still collecting higher coupons banked along the way.
- Prolonged plateau: If rates stay elevated, prices stay soft, but maturing bonds keep getting reinvested at yields above 5%, steadily improving the fund’s forward income. The holder trades slower price recovery for stronger ongoing yield.
The uncertainty is real for a reason. A mid-August 2026 Bloomberg newsletter attributed rising yields partly to inflation running above the Fed’s target for five straight years, and the 30-year bond has spent more trading days above 5% in 2026 than in any year since 2006. This looks like a regime, not a spike.
The structural repricing of long-dated Treasuries is visible in auction data: the 30-year sale on 13 August 2026 cleared at 5.216%, the highest borrowing cost for that maturity in roughly 25 years, with primary dealers absorbing only 11.5% of supply, a figure that points to real but conditional institutional demand rather than a buyer strike.
The structural context Fitch Ratings notes that Quantitative Easing previously suppressed term premia on long-dated bonds by as much as 100 basis points. The unwind of that suppression is structural, which means part of today’s high yields reflects normalisation rather than crisis.
That reframe matters more than any forecast. For a saver more than three to five years from withdrawal, holding through this environment while reinvesting at higher yields is the evidence-aligned default posture, not a passive failure to act.
For readers wanting to understand the structural forces behind the regime shift in full, our deep-dive into why the bond market now sets long-term rates covers the Fed’s declining share of outstanding debt, Japan’s Treasury reductions, and what the 5% threshold on the 10-year means for every asset class using Treasuries as a discount rate.
This article is for informational purposes only and should not be considered financial advice. Investors should conduct their own research and consult with financial professionals before making investment decisions.
Past performance does not guarantee future results. Financial projections are subject to market conditions and various risk factors, and forward-looking scenarios are speculative and subject to change based on economic developments.