How Free Cash Flow ETFs Filter for Quality Over Profit
12 hrs ago

You own a company you genuinely admire. The business model works, customers stay, and earnings keep growing. Yet every time you check the position, the return is unremarkable. Not bad. Not exciting. Just there.
That discomfort is the signature problem of valuing a growth stock whose growth has slowed. The old mental models, revenue multiples, total addressable market projections, subscriber count celebrations, were built for businesses reinvesting aggressively with profits years away. When a company matures into a steady cash generator, those instruments stop working. The stock does not collapse. It just becomes hard to price, and harder to decide whether to hold.
Here is a five-step framework for pricing quality compounders when growth decelerates, using Netflix as the case study. Not because Netflix is unique, but because it is familiar enough that you can stress-test your own intuitions against concrete numbers. The framework itself is what you carry forward, applicable to any maturing compounder you encounter next.
Revenue multiples and total addressable market projections were designed for a specific kind of business: one reinvesting every dollar, burning cash, and promising earnings sometime in the future. When a company crosses the line into reliable, growing profitability, those frameworks stop answering the question you actually have. You are no longer asking “how big could this get?” You are asking “what am I paying for what this business earns today?”
That is the pivot. And the right tool for it is the price-to-earnings ratio, or P/E. P/E tells you something specific and useful:
Growth stock valuations are structurally built around future earnings rather than current profits, which is precisely why the P/E ratio feels like the wrong instrument when a business still carries the label ‘growth’ but has already crossed into reliable profitability; the mental model lags the reality by years.
P/E expresses how many years of current earnings the market is willing to prepay.
A simple rule of thumb, rooted in PEG-style logic (price-to-earnings relative to growth), connects P/E to the earnings growth rate a business can sustain:
Damodaran’s PEG ratio analysis establishes that a stock’s fair P/E is anchored to its sustainable earnings growth rate, with interest rates and risk tolerance acting as modifiers that shift the reasonable multiple range up or down around that central estimate.
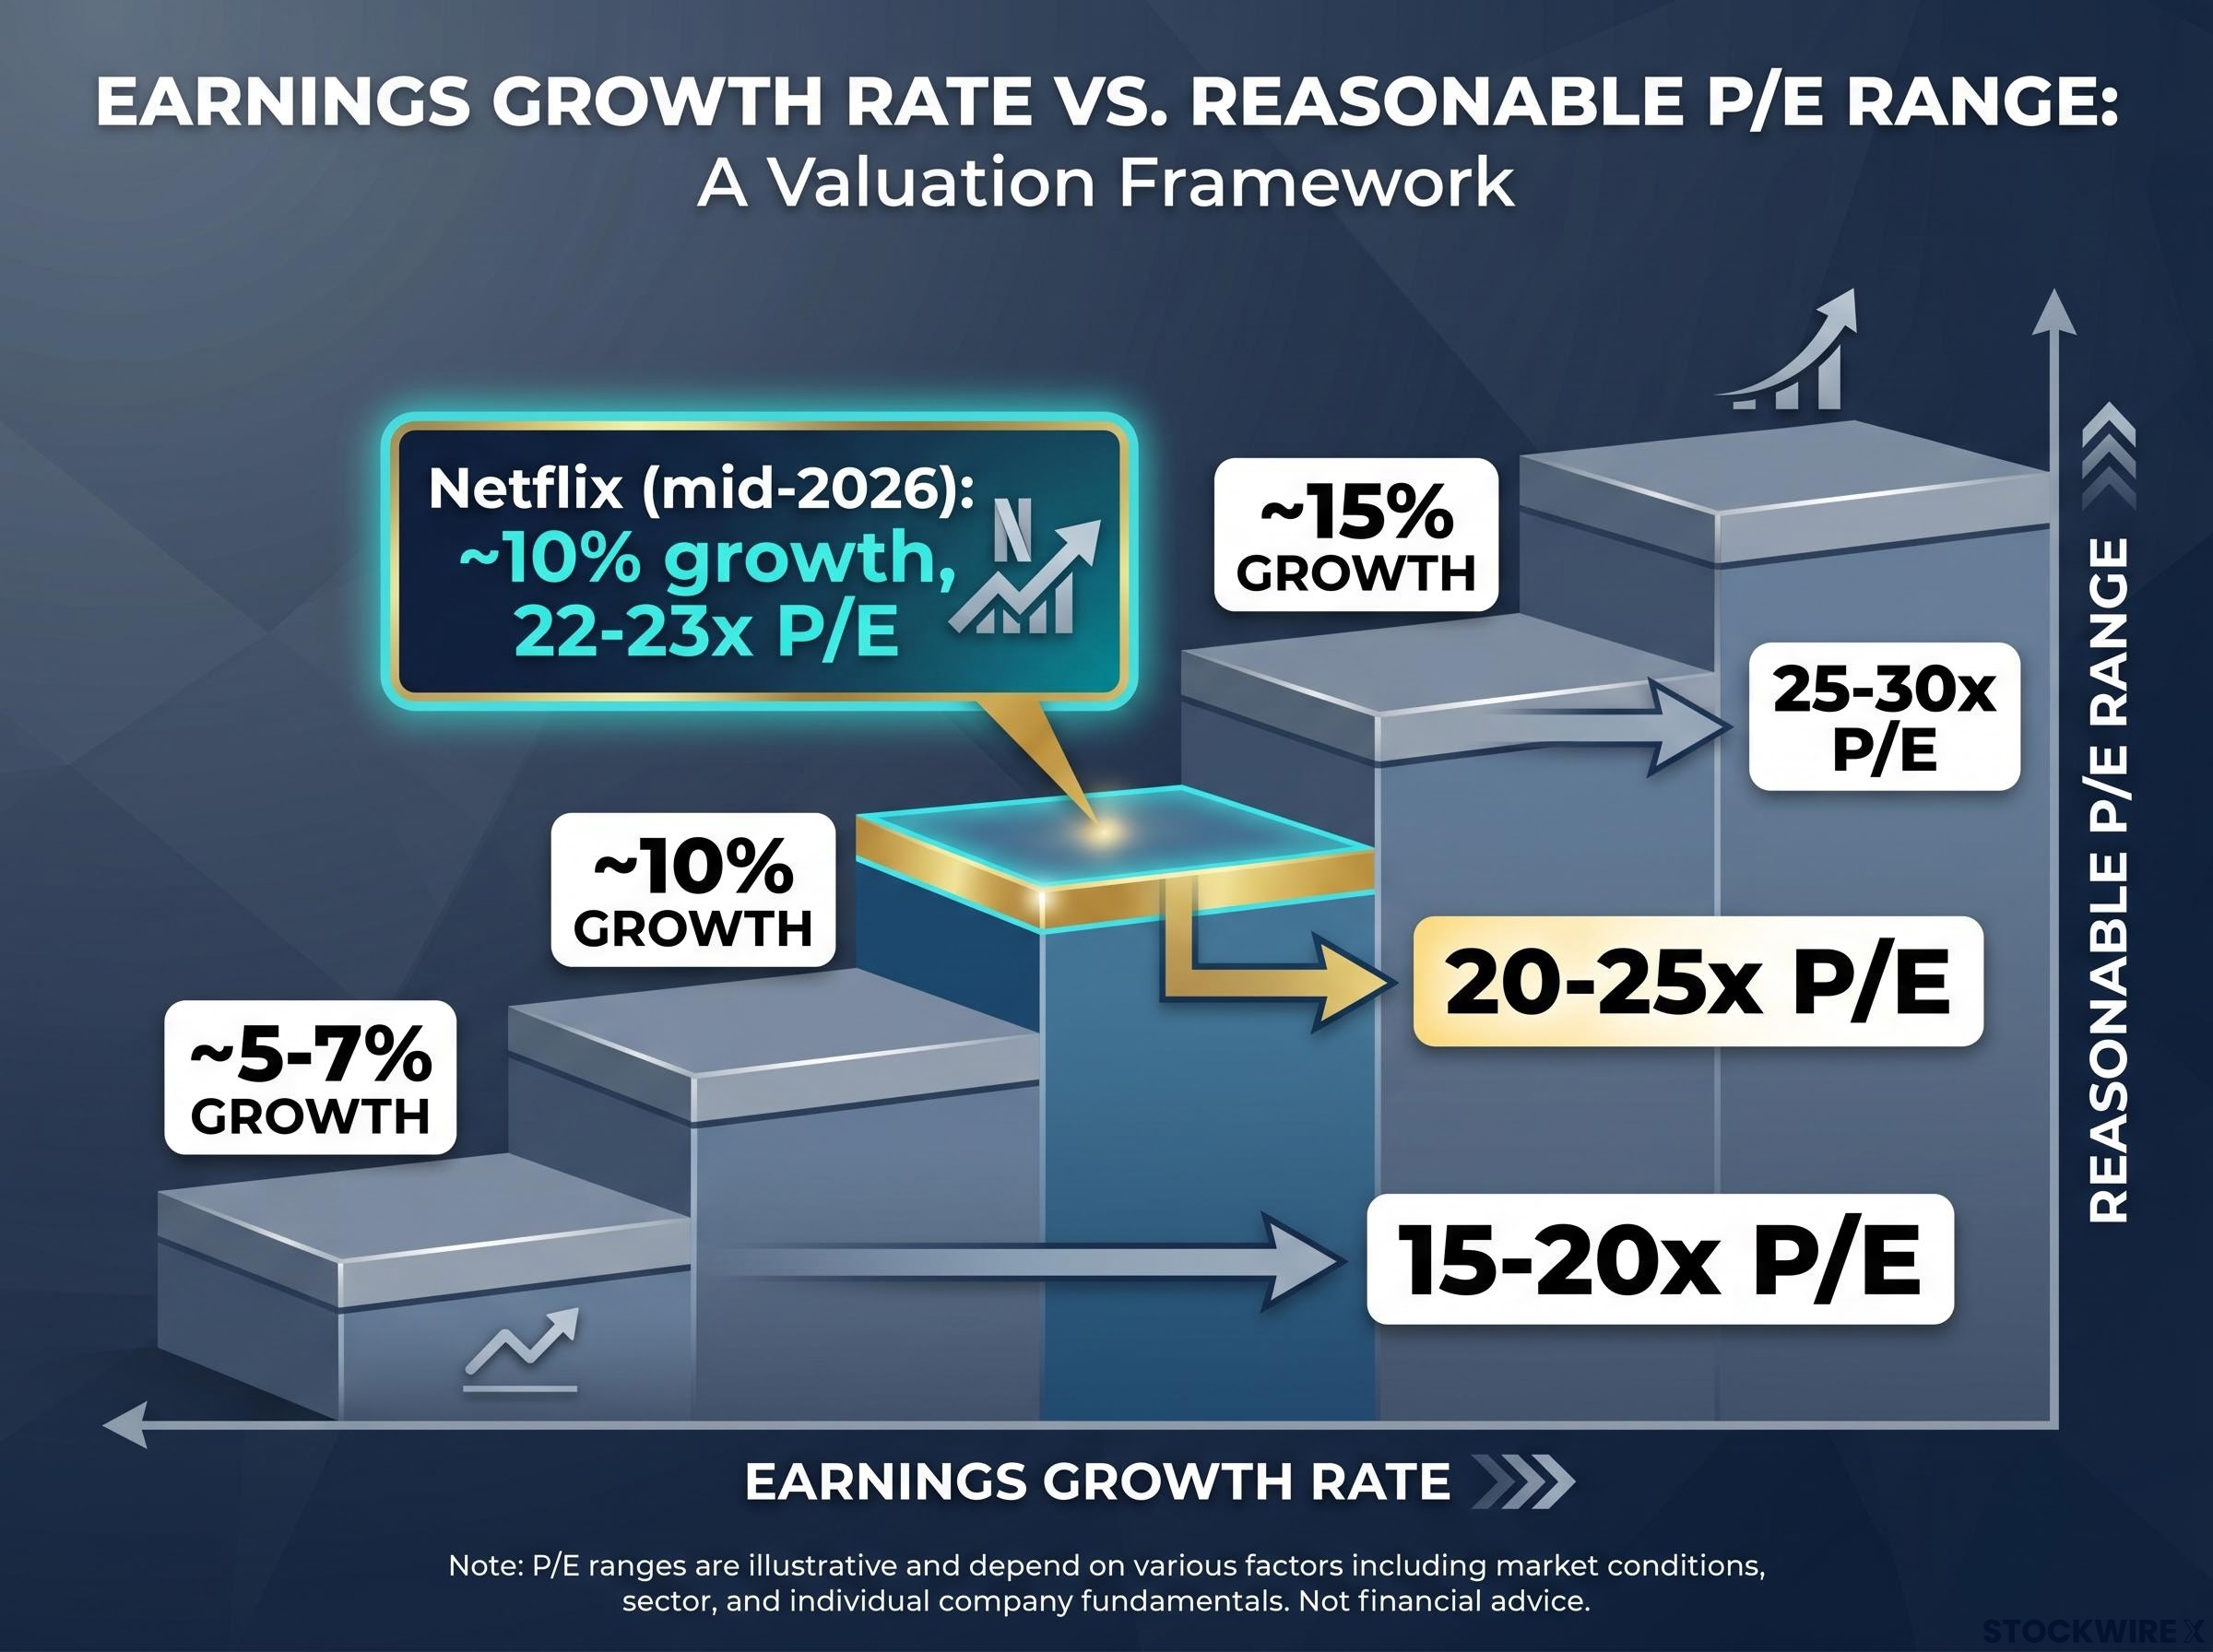
| Earnings Growth Rate | Reasonable P/E Range |
|---|---|
| ~5-7% | 15-20x |
| ~10% | 20-25x |
| ~15% | 25-30x |
Netflix trades at a trailing P/E in the low-to-mid 20s (approximately 22-23x as of mid-2026). With roughly 10% ongoing earnings growth, that multiple sits squarely in the “fair” zone. Not a bargain. Not a bubble. The stock has, in a sense, grown into its valuation as earnings caught up to the price investors were once willing to pay on faith.
If you are still reaching for subscriber counts or revenue multiples to judge a business like this, you are using an instrument calibrated for a company Netflix no longer is. The mismatch is why mature compounders feel impossible to price. Switch to P/E, anchor it to sustainable earnings growth, and the picture clarifies.
A single “fair value” number creates false precision. It tells you what the stock is worth if your assumptions are exactly right, which they will not be. What you actually need is a distribution of outcomes that shows you whether the risk-reward is skewed in your favour before you commit capital.
Scenario analysis produces a more honest picture of expected returns than any single price target because it forces you to explicitly state what has to be true in each outcome, separating the assumptions from the conclusions in a way that a blended ‘consensus estimate’ never does.
Here is how to build that distribution, using Netflix as the worked example.
Base case: steady compounding. Earnings grow at approximately 10% annually for five years. The P/E multiple holds in the 20-25x range. Ongoing free cash flow funds modest buybacks and the share count drifts lower. You earn roughly what the business earns: low-to-mid-teens annualised returns.
Bull case: growth re-acceleration or multiple expansion. The advertising tier matures faster than expected, live content expands the subscriber base, or international markets deepen. The market re-rates the stock and P/E nudges toward 30x. A capital rotation away from speculative AI plays toward steady cash generators could act as a catalyst for institutional re-rating. Annualised returns reach the teens to 20% or above.
Bear case: recession or churn. Consumer sentiment weakens, subscriber growth stalls, and ad spending contracts. P/E compresses toward 15x. Near-term recession probability is characterised as low in most current assessments, but if it materialises, you are looking at flat to mildly negative five-year returns.
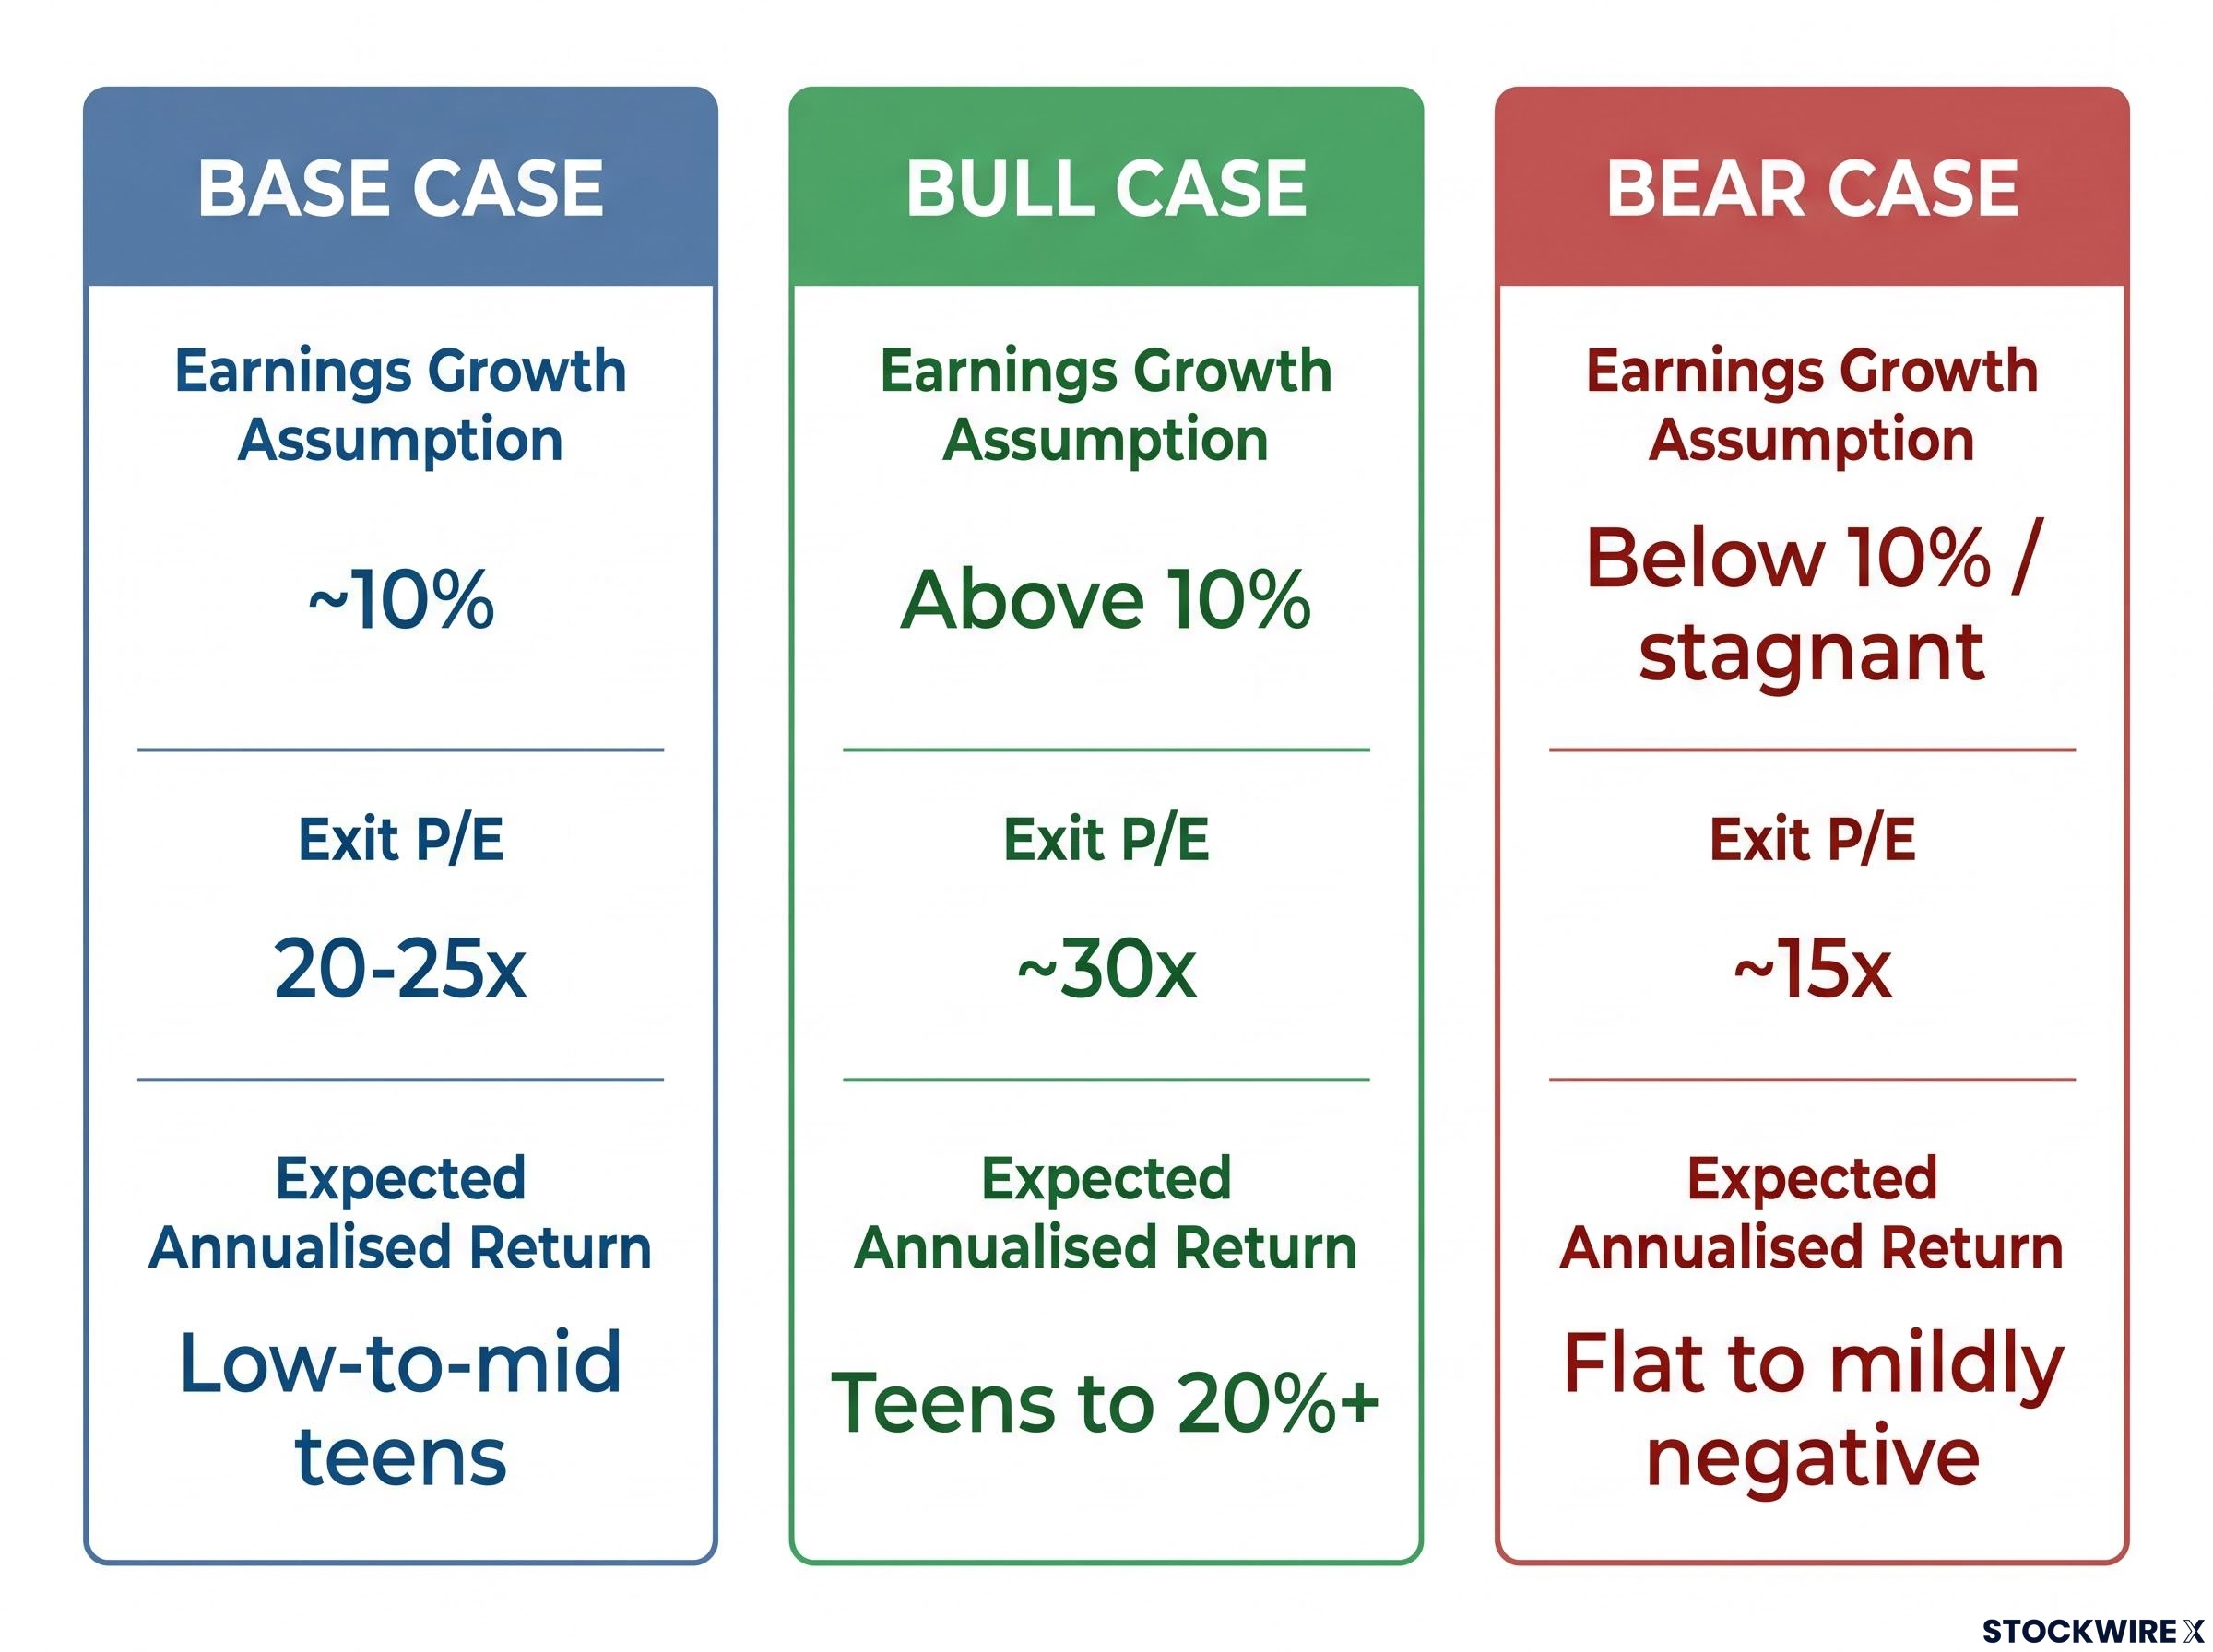
| Scenario | Earnings Growth Assumption | Exit P/E | Expected Annualised Return |
|---|---|---|---|
| Base | ~10% | 20-25x | Low-to-mid teens |
| Bull | Above 10% | ~30x | Teens to 20%+ |
| Bear | Below 10% / stagnant | ~15x | Flat to mildly negative |
Line the three outcomes up and the asymmetry becomes visible. Upside is meaningful, potentially several hundred percent cumulative over years. The base case delivers solid mid-teens compounding. And the downside, critically, is bounded.
That last point is worth sitting with. A bear case of approximately 15x earnings in a recessionary environment does not represent permanent capital destruction. It represents flat returns over five years. You lose time, not wealth. Compare that to buying a structurally broken business at a stretched multiple, where the bear case is permanent loss.
Buying at a reasonable multiple bounds your downside to a fundamentally different category of risk. That is what asymmetric risk-reward actually looks like in a quality compounder, and it is the specific insight that single-target valuations miss.
When growth was rapid, management quality mattered less because rising revenue covered a multitude of capital allocation sins. In a mature compounder, the decisions executives make with cash flow, buybacks, leverage, and potential acquisitions over the next five years matter as much as today’s P/E.
You evaluate management alignment across three lenses.
Ownership and pay structure. Both co-CEOs, Ted Sarandos and Greg Peters, take home around $50 million per year in total pay. Base salary accounts for under 10% of that figure, with the bulk, roughly 80%, delivered through equity awards. Their personal wealth therefore rises and falls alongside the same share price you are monitoring.
Harvard Law’s CEO pay-for-performance research finds that equity-weighted compensation structures produce meaningfully stronger alignment between executive decision-making and long-run shareholder outcomes than cash-heavy packages, reinforcing why the composition of a pay package matters as much as its total size.
Capital allocation discipline. The clearest window into a management team’s character is not which deals they pursued, but which ones they declined. When the Warner Bros. Discovery acquisition was on the table, a transaction that would have loaded the balance sheet with tens of billions in debt, Netflix management stepped back rather than stretch the company into a precarious leverage position. Choosing financial prudence over deal-making glory, when the temptation to act was real, is the quality of restraint that tends to protect shareholders when conditions deteriorate.
Buyback quality and balance sheet health. The board extended its share repurchase authorisation by $25 billion, with around $7 billion of an earlier tranche still available as of end-March 2026. Current net debt is minimal relative to cash holdings. Conservatively funded buybacks from free cash flow at or below intrinsic value create long-term value. The threshold to watch is leverage:
Buybacks funded from free cash flow create value only when the price paid is at or below intrinsic value; when management repurchases shares above that threshold, they are transferring wealth from long-term holders to sellers, which is why tracking the relationship between buyback price and estimated fair value matters as much as the buyback size itself.
In a consumer subscription business, a net debt/EBITDA ratio climbing past 3-3.5x introduces serious vulnerability. Reaching four times takes a company to the edge of junk territory.
| Criterion | Assessment |
|---|---|
| Equity-heavy compensation | ✓ |
| Conservative leverage | ✓ (so far) |
| Willingness to avoid value-destructive deals | ✓ |
| Founder-like ownership | ✗ (good but not elite alignment) |
The alignment on display here compares well against most large-cap peers, even if it falls short of the standard set by founder-operators with generational skin in the game. That distinction is worth noting as you move to the opportunity cost test that follows: passing the alignment filter does not mean this is the highest-conviction situation available.
A stock that passes every filter above can still be the wrong choice for your portfolio. The benchmark is not whether Netflix is good. The benchmark is whether it is better than what else you could do with the same capital.
The benchmark is not cash. It is your single best alternative use of that capital.
Among the alternatives worth considering are founder-led businesses of smaller scale, growing at a faster clip than Netflix, sitting on net cash rather than net debt, and priced at around 16x earnings rather than the mid-20s. When you map those attributes against the framework criteria, the gap is consistent and runs in the same direction across every dimension.
| Dimension | Netflix | Smaller Founder-Led Alternatives | What the Gap Means |
|---|---|---|---|
| Quality of alignment | High | Higher (founder-led) | Stronger long-term stewardship incentive |
| Earnings growth | ~10% | Faster | More compounding power per year |
| Valuation | Mid-20s P/E | ~16x P/E | Lower entry price relative to earnings |
| Balance sheet | Minimal net debt | Net cash | More resilience in a downturn |
The distinction matters most for flexible retail investors managing concentrated portfolios. You have a real choice about where each dollar goes. For very large institutions deploying tens of billions, Netflix’s size, trading liquidity, and operating maturity may make it a natural fit that smaller alternatives cannot replicate at the required scale. But if you have the flexibility to deploy into a faster-growing, cheaper, founder-aligned alternative, the opportunity cost of holding Netflix instead is real.
Netflix earns a favourable assessment on its own merits. Whether it is the optimal use of your capital depends on what else is in front of you, and for many retail investors with genuine flexibility, a better-scoring alternative exists. The cost of that mismatch between “good” and “best available” accumulates with every year the capital sits in the wrong place.
For investors exploring the founder-led, faster-growing alternatives that the opportunity cost test surfaces, our comprehensive walkthrough of small-cap management evaluation covers the per-share return analysis and red flag frameworks that professional investors use to verify whether a management team’s track record is real before committing capital.
At this stage you have the framework. Now you apply it as a binary decision tool, not a scoring system. Each criterion gets a pass or fail, and the outcome tells you whether to act or walk away.
A stock that barely clears the valuation criterion is not a “don’t buy” signal. It is a calibration signal.
A thin margin of safety means you size the position for the return range the scenarios actually project: mid-teens annualised in the base case, not a multi-bagger. You are not buying this for asymmetric upside. You are buying it for durable, moderate compounding with a bounded downside. Size accordingly: enough to benefit from the base case, not so much that a bear case materially damages your portfolio.
This is the mechanism linking the checklist output to actual portfolio construction. The pass/fail answer tells you whether to act. The margin by which it passes tells you how much.
Every section above corresponds to one step in a transferable process. Here it is, condensed into a sequence you can run on any maturing growth stock:
This framework prevents three specific errors:
The most common failure mode this process surfaces is investors who do all the qualitative work and skip step five. They conclude they have done enough analysis when they have actually only evaluated the stock in isolation. That is the step most likely to change your conclusion.
When the Netflix analysis runs through each step of this framework, it lands in a specific place: a business of above-average quality priced at something close to a market-average multiple. Free cash flow is substantial, earnings continue to grow, and the valuation is neither stretched nor discounted. That is a reasonable setup, but it is not a bargain, and it is not a bubble.
But the framework’s value is not the Netflix conclusion it produces today. It is the repeated application of a structured process that prevents two costly habits: the complacency of holding a deteriorating story because you once admired the business, and the error of dismissing a durable compounder because growth no longer thrills you.
A quality business at a fair price is a starting point for analysis, not a conclusion. The real work is determining whether fair-priced quality beats the best available alternative in your portfolio. That discipline, applied across a lifetime of investment decisions, is what compounds.
Three variables will determine whether the base case or the alternative scenarios materialise for any compounder you are watching:
This article is for informational purposes only and should not be considered financial advice. Investors should conduct their own research and consult with financial professionals before making investment decisions. Past performance does not guarantee future results. Financial projections are subject to market conditions and various risk factors.
—
The price-to-earnings ratio is the right instrument once a growth stock crosses into reliable profitability. Anchoring P/E to sustainable earnings growth using PEG-style rules (10% growth supports a 20-25x multiple, for example) replaces revenue multiples that were designed for cash-burning businesses with profits still years away.
Build three explicit cases: a base case where earnings grow at roughly 10% and the P/E holds in the 20-25x range for low-to-mid-teens annualised returns, a bull case where growth re-accelerates and the multiple expands toward 30x, and a bear case where recession compresses the multiple to around 15x for flat to mildly negative returns. The distribution of outcomes, not a single price target, is what reveals whether the risk-reward is in your favour.
A stock that barely clears the valuation criterion signals a thin margin of safety, which means you size the position for the base case return range (mid-teens annualised) rather than treating it as a high-conviction multi-bagger. The margin by which a stock passes the checklist directly calibrates how much capital you commit.
A stock that passes every filter can still be the wrong allocation if a faster-growing, cheaper, better-aligned alternative exists. The benchmark is not cash; it is your single best alternative use of that capital, and for many retail investors a founder-led business growing faster at a 16x P/E beats a fairly priced Netflix at mid-20s despite Netflix clearing every other criterion.
When equity awards make up roughly 80% of executive pay (as they do for Netflix co-CEOs Ted Sarandos and Greg Peters), management wealth rises and falls with the same share price investors are monitoring, which creates alignment between capital allocation decisions and long-run shareholder outcomes. Cash-heavy pay packages remove that feedback loop and tend to produce weaker alignment over time.