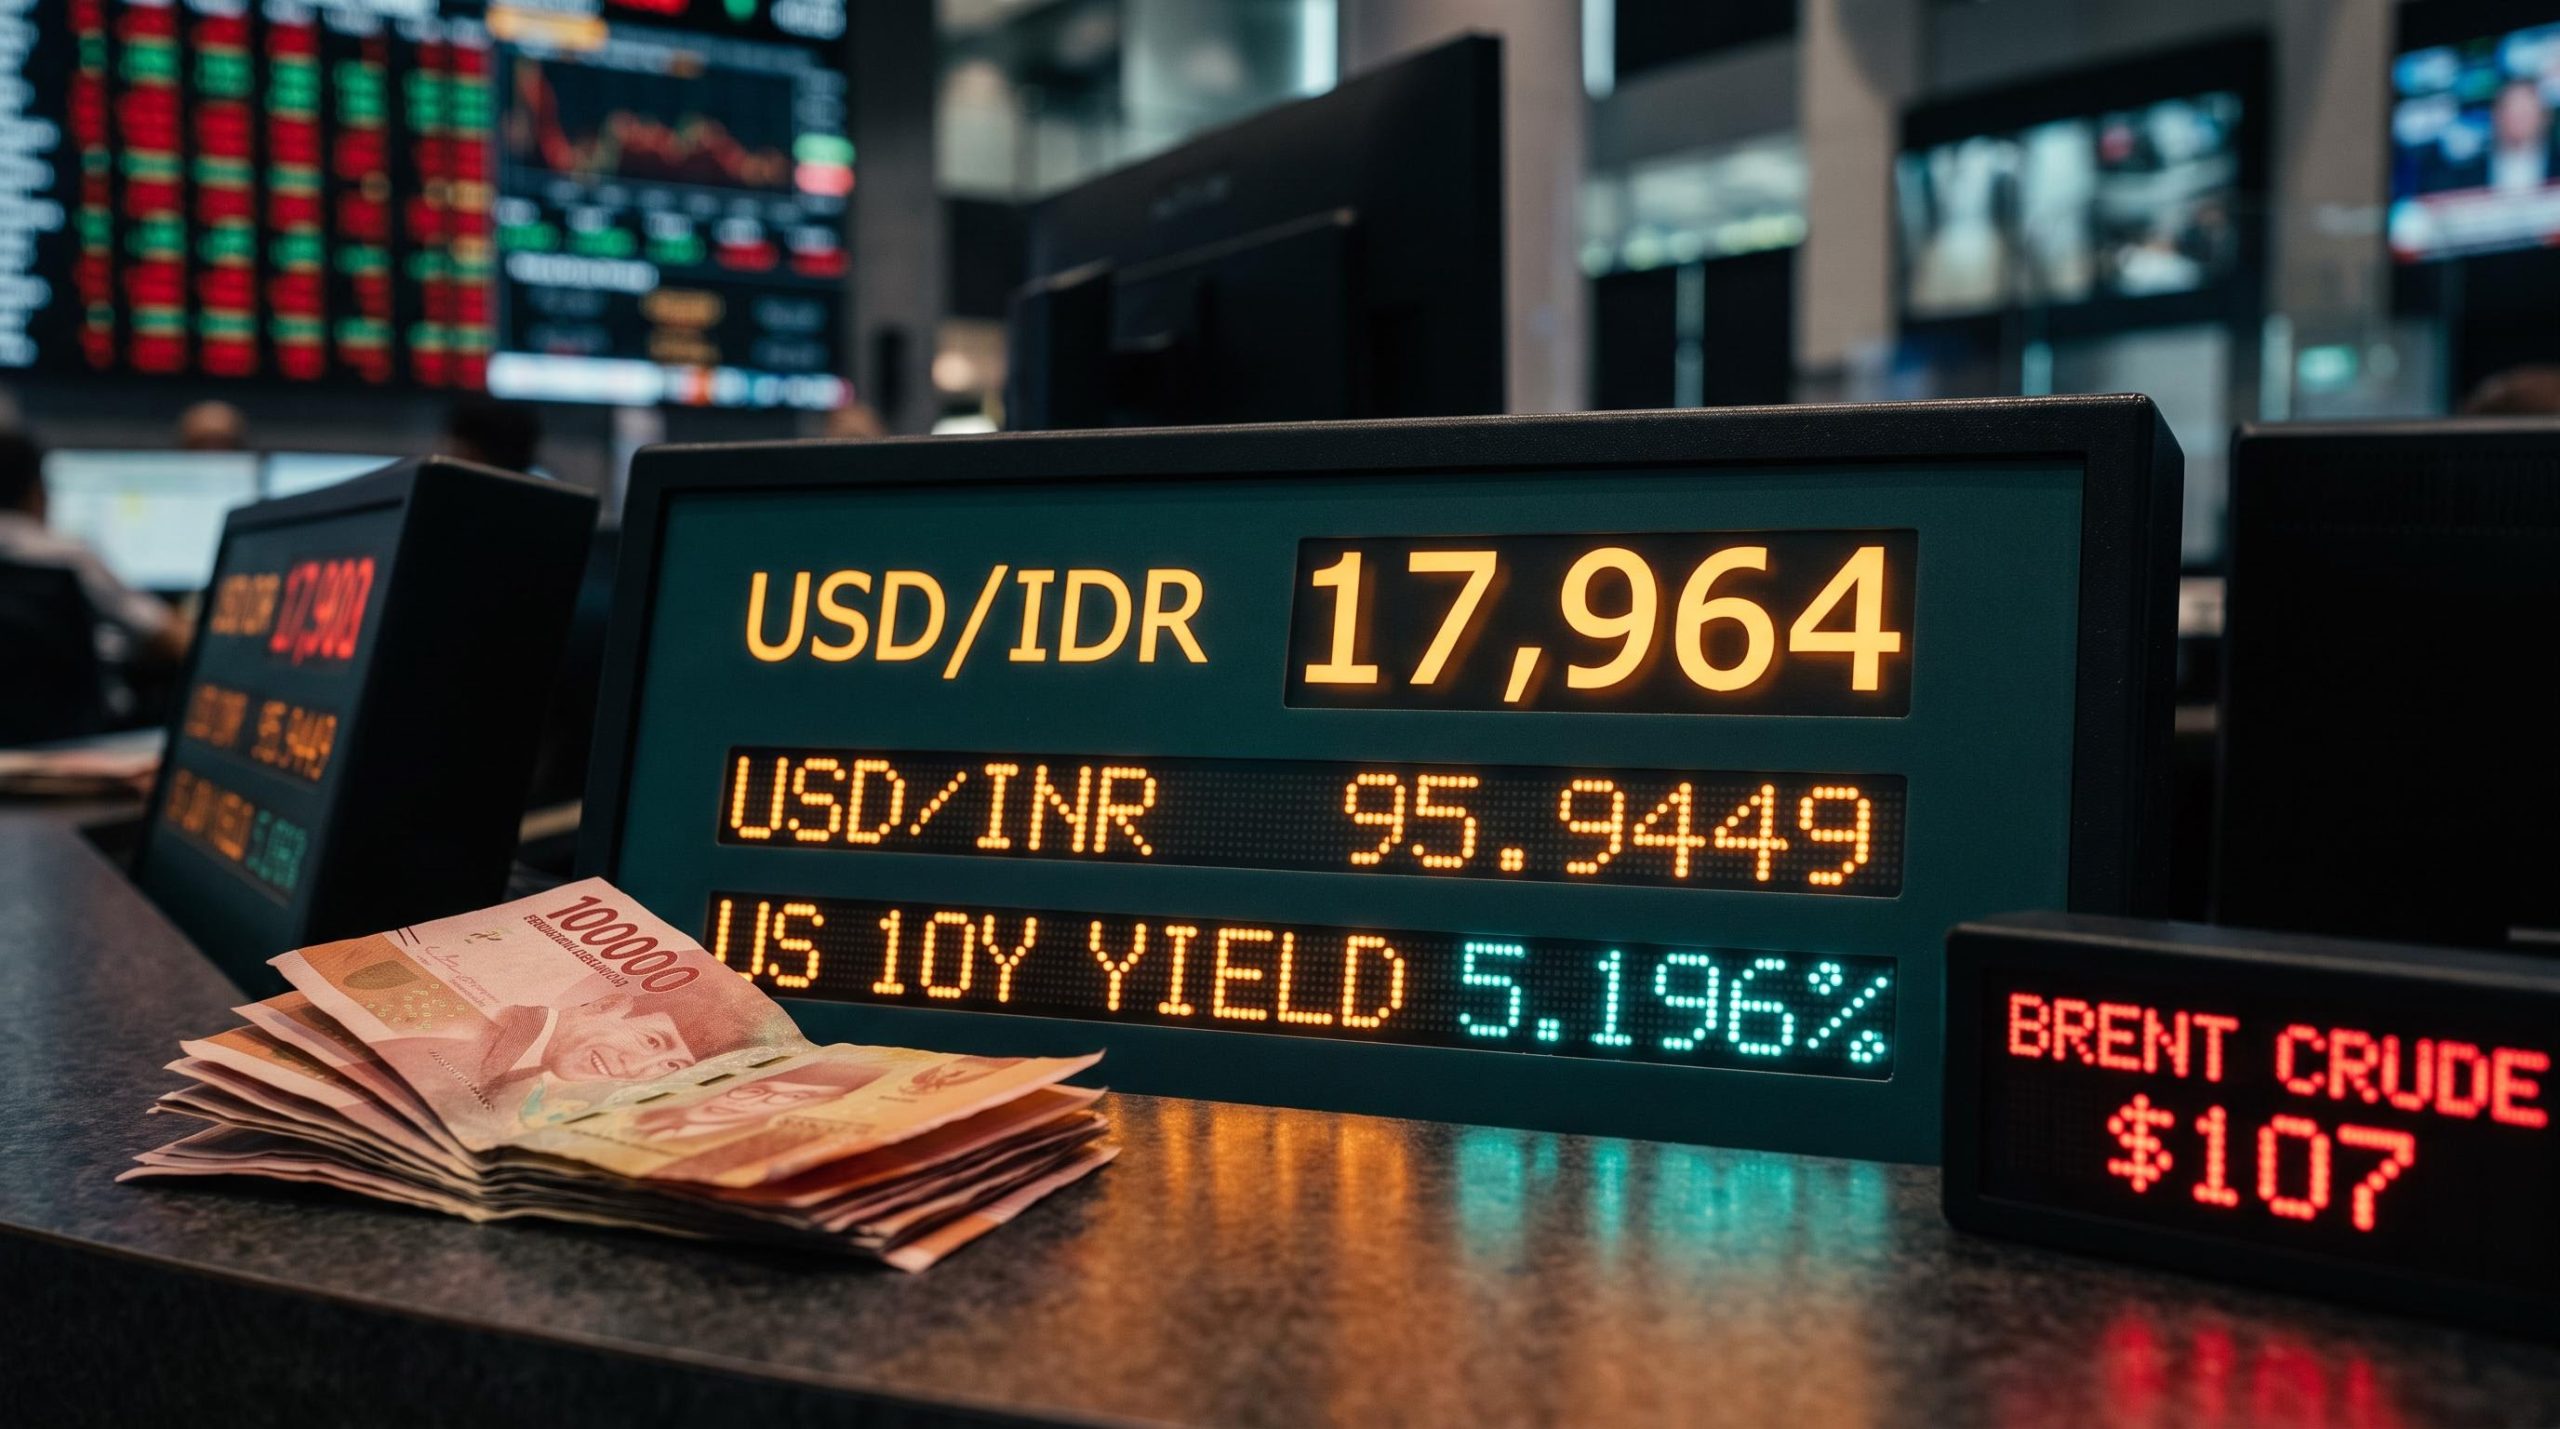
On Wednesday, the US Treasury tried to sell $70 billion of 5-year notes and the market barely swallowed them. The notes cleared at a high yield of 5.033%, the steepest for that maturity since June 2006, and the auction left one of the ugliest fingerprints seen in years.
That single number carries weight far beyond a bond desk. The federal government leans on routine auctions like this one to fund a deficit running at 5.8% of GDP, which means buyer appetite for Treasuries is not a technical curiosity. It is one of the pillars holding up the entire cost of borrowing in the American economy.
When those buyers hesitate, the tremor eventually reaches your mortgage rate, your car loan, and the yield on every bond fund you own.
The mechanical link between Treasury yields and mortgage rates runs through a spread of roughly 2 percentage points, which is why a sustained rise in auction clearing yields translates directly into a higher number on a lender’s rate sheet within days.
This piece gives you a working framework for reading Treasury auction metrics the way a professional does. You will learn to tell the difference between temporary market noise and a structural shift in who is willing to lend the government money, and why that distinction shapes the interest rates you pay for years.
Decoding the mechanics of a Treasury auction
A bad auction looks specific on a trader’s screen. The yield prints higher than expected, a gap opens between where the market was trading and where the sale actually cleared, and the firms obligated to buy end up holding a large chunk they did not want. Each of those symptoms maps to a metric, and each metric tells you something the headline yield cannot.
Three numbers do most of the diagnostic work:
- Bid-to-cover ratio: Total bids divided by the amount on offer. A higher number means more demand chasing the same supply. When it slips below recent averages, appetite is thinning.
- The tail: The gap between the yield the market expected and the higher yield the auction actually needed to clear. A large tail means buyers demanded a discount to show up.
- Primary dealer retention: The share of the offering left with the banks that are required to bid. The higher this figure, the more real buyers stepped away.
To understand why dealer retention matters most, you need the hierarchy of who buys. Indirect bidders sit at the top of the demand quality ladder; they are predominantly foreign central banks and international institutional investors, the steadiest and least price-sensitive buyers in the market. Direct bidders are domestic institutions buying for their own accounts. Primary dealers are the banks contractually obligated to bid so the auction always clears.
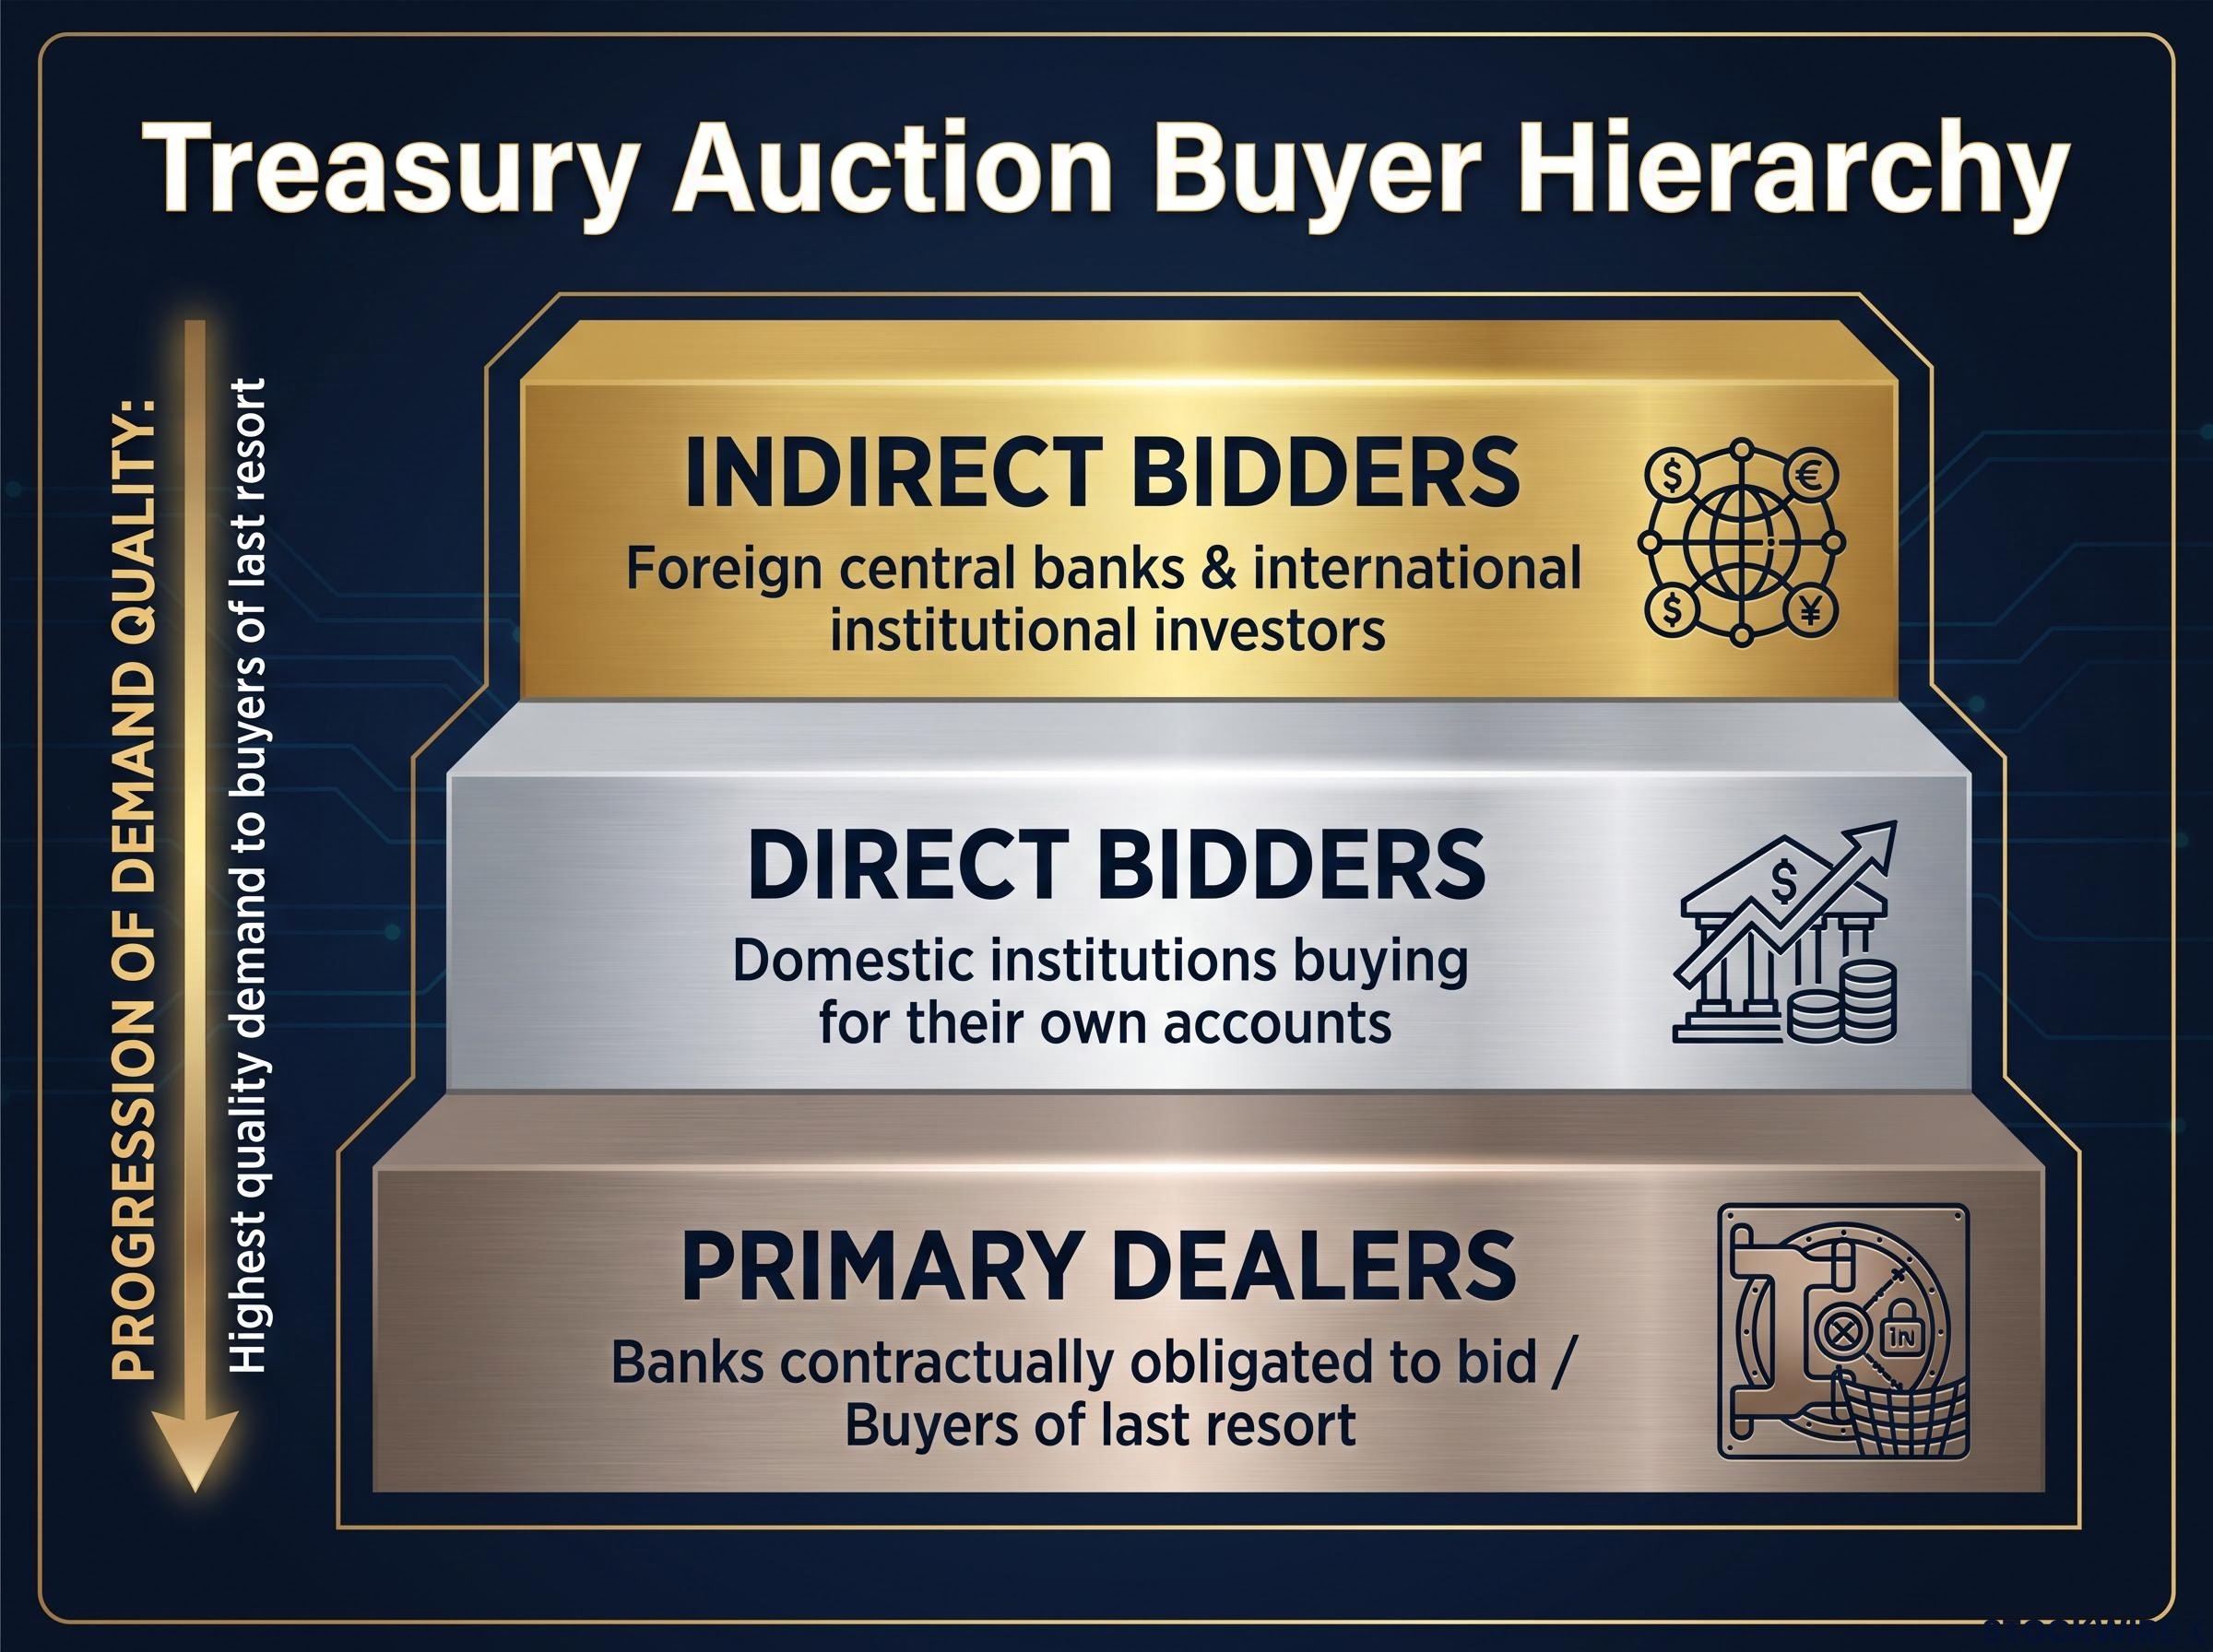
That obligation is the whole point. Primary dealers are the buyers of last resort, which flips the intuition on its head: a high dealer take is not a sign of strength but a warning that everyone else declined.
Here is what that means for you. When dealers are forced to absorb supply the market rejected, it signals a genuine shortage of conviction in US debt. That shortage does not stay contained in the bond market. It works its way into the baseline rates that set what you pay on a mortgage or an auto loan, because Treasury yields are the benchmark those consumer rates are priced against.
When big ASX news breaks, our subscribers know first
The September warning signs in the data
Start with the number that alarmed traders. That Wednesday 5-year auction produced a tail of 3.1 basis points, recorded as the second-largest on record for the maturity. A tail that size means the government had to pay meaningfully more than the market expected just to move the paper.
The rest of the metrics confirmed the strain. The bid-to-cover ratio came in at 2.21, below the recent averages near 2.33, and primary dealers were stuck with roughly 15.8% of the issue, around $11 billion of notes nobody else wanted.
The most telling figure was buried in the buyer breakdown. Indirect bidders, the foreign central banks and institutions that normally anchor these sales, took just 54.3% of competitive awards, well beneath the 12-month average of roughly 63.9%.
The next day’s 7-year auction on 24 September 2026 tells a more nuanced story. It avoided catastrophe, clearing with a tail of only 0.7 basis points, but it did so on abnormal terms. Indirect bidders again pulled back to 57.2%, against a 6-month rolling average of 64.6%, and the auction only held together because domestic direct bidders stepped up to 30.3% to fill the gap the foreign buyers left.
| Metric | 5-Year Auction Result | 7-Year Auction Result | Recent Historical Average |
|---|---|---|---|
| High yield | 5.033% | 5.085% | Below recent auction levels |
| Tail | 3.1 bps | 0.7 bps | Minimal in healthy sales |
| Bid-to-cover | 2.21 | 2.42 | ~2.33-2.50 |
| Indirect bidders | 54.3% | 57.2% | ~63.9%-64.6% |
Focus on that indirect bidder collapse across both sales. When the safest and most reliable foreign buyers step back from US debt at the same time, it tells you the deepest layer of demand is thinning. That leaves the market more exposed to sudden price swings, because the buyers left standing are the ones who demand a higher yield the moment sentiment sours.
What you witnessed this week is how quickly confidence can erode even in the asset the entire financial system treats as risk-free.
Why the buyer base is structurally shifting
A single ugly week can be dismissed as bad luck. What worries analysts is that the September auctions fit a longer pattern, one rooted in the plumbing of the market rather than in quarter-end positioning or a badly timed calendar slot.
The supply side of the problem is stark. The Congressional Budget Office projects a federal deficit of $1.9 trillion in fiscal year 2026, equal to 5.8% of GDP, according to its February 2026 outlook. Set that against the 50-year historical average of roughly 3.8% of GDP and the scale of new issuance becomes clear. The government needs to sell more debt than at almost any point outside a war or a crisis.
The demand side is retreating at the same time. Foreign investors in Europe and Japan now face steep costs to hedge their currency exposure when buying US bonds, and once those hedging costs are stripped out, the yields look far less attractive than the headline suggests. Strategists at banks including JPMorgan and Goldman Sachs have argued for years that this arithmetic pushes overseas buyers to demand more yield or simply allocate elsewhere.
The structural rotation in Treasury buyers, from foreign reserve managers toward domestic commercial banks now holding a record $4.8 trillion, is the multi-year shift that makes each indirect bidder reading more consequential than any single auction result.
Federal Reserve officials, including Dallas Fed President Lorie Logan, a former manager of the Fed’s securities portfolio, have emphasised that the Treasury market has grown faster than the risk capacity of the dealers meant to intermediate it. Post-crisis capital rules limit how much banks can hold, leaving auctions more sensitive to shocks in risk appetite and more reliant on leveraged, opportunistic buyers.
The impact of quantitative tightening
The biggest change is the disappearance of a buyer who never cared about price. Through quantitative tightening, the process of shrinking its balance sheet, the Federal Reserve has stepped back from the market. Its Treasury holdings stood at roughly $4.557 trillion as of late September 2026, and it is no longer the automatic backstop it was for over a decade.
That withdrawal matters more than it sounds. The Fed bought bonds regardless of yield, which cushioned every auction. With that buyer gone, the market now depends on hedge funds and domestic banks who buy only when the price is right.
For you, the takeaway is uncomfortable. As record issuance meets a retreating set of guaranteed buyers, you should expect structurally higher baseline yields to persist across your fixed-income holdings, not because of one bad week but because the foundation of demand has genuinely changed.
The fiscal feedback loop and future vulnerability
Here is where the mechanics turn into mathematics, and the mathematics start to compound. The core worry among analysts is a self-reinforcing cycle in which the cost of borrowing feeds the need to borrow more.
James Lavish, a CFA charterholder and macro investor, has described this as a fiscal feedback loop. The steps run in sequence:
The debt sustainability arithmetic behind this cycle is stark: at a 4% average interest rate on $40 trillion of outstanding obligations, the annual interest bill reaches approximately $1.6 trillion once cheaper legacy debt finishes rolling over at today’s yields.
- Elevated interest costs on existing debt push up the government’s future borrowing needs.
- That forces additional issuance into a market already demanding higher yields.
- The extra supply drives yields higher still.
- Those higher yields raise the cost of the next round of issuance, and the cycle repeats.
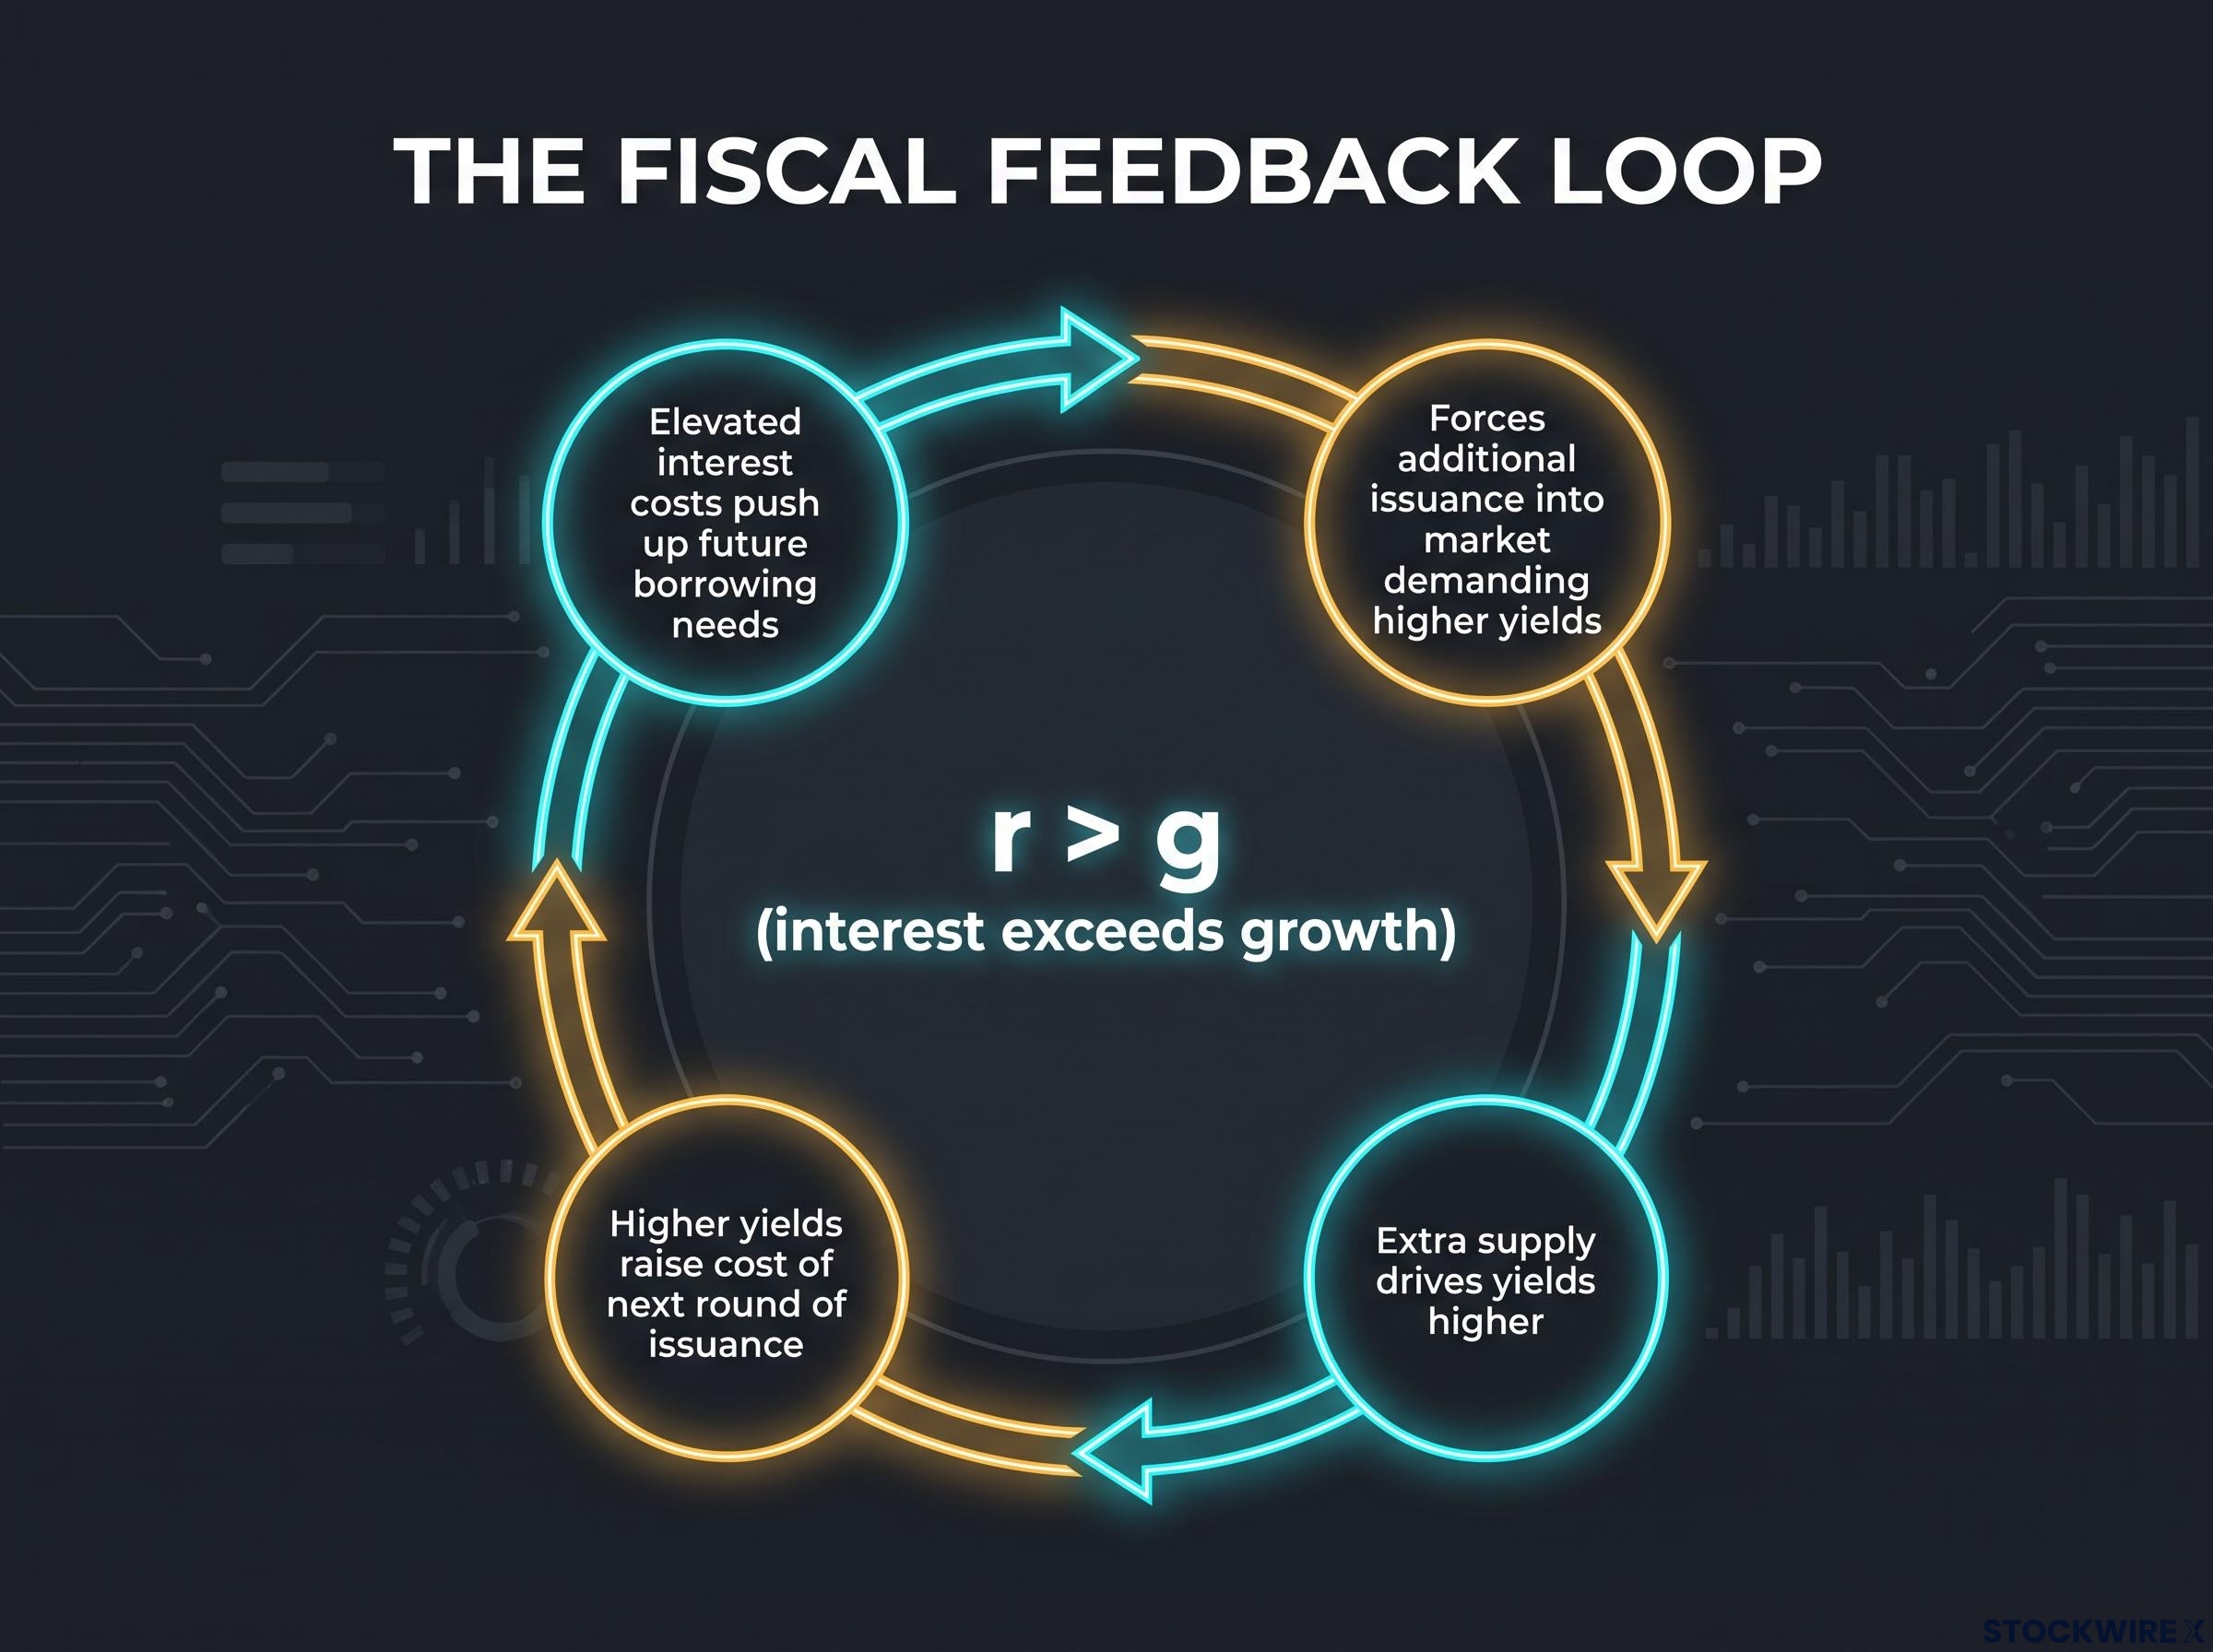
Underneath this sits a concept economists call the interest-growth differential, often written as r minus g. Put plainly: if the average interest rate the government pays on its debt (r) stays higher than the growth rate of the economy (g), the debt pile grows faster than the country’s ability to service it, and the ratio of debt to GDP rises on its own.
For the loop to become genuinely self-reinforcing, several conditions need to line up at once: persistent deficits with no credible plan to close them, that positive r minus g gap, and the continued retreat of steady buyers that leaves auctions at the mercy of price-sensitive traders.
History shows how fast this can turn. The 2023 long-bond auctions cleared with large tails and heavy dealer retention as term premiums repriced, and the 2022 UK gilt crisis demonstrated how a fiscal confidence shock, colliding with leveraged investors, can destabilise a major sovereign bond market in days and force a central bank to intervene.
Understanding this loop changes how you read the next rate move. If yields climb because the economy is booming, that is one story. If they climb because the government is straining to fund itself, that calls for entirely different defensive positioning in your portfolio.
This article is for informational purposes only and should not be considered financial advice. Investors should conduct their own research and consult with financial professionals before making investment decisions. Past performance does not guarantee future results, and these forward-looking scenarios are speculative and subject to change based on policy decisions and market developments.
Navigating the new rules of sovereign debt
The picture that emerges from this week is one of transition. The Treasury market is moving away from an era defined by guaranteed, price-insensitive buyers, the Federal Reserve and foreign central banks, toward one dominated by elastic participants who show up only when the yield compensates them for the risk.
One rough week does not make a crisis. The mitigants are real, from credible fiscal consolidation to renewed central-bank support to the safe-haven demand that always floods toward Treasuries in a global panic. But the combination of a 5.8% deficit and a measurable retreat by foreign buyers creates a fragility that healthy auctions in isolation cannot fully resolve.
The metric to watch in the next round of monthly auctions is indirect bidder participation. If that share climbs back toward its historical average near 64%, September was noise. If it keeps sliding, the structural shift is confirmed, and the higher cost of government borrowing will steadily become the higher cost of your own.
For readers wanting to translate these auction dynamics into specific portfolio implications, our full explainer on the US debt spiral covers how $952 billion in annual interest costs are already compressing equity risk premiums and raising monthly mortgage payments.