
How to Value Transition-Stage Stocks Using Tesla as a Guide
5 mins ago

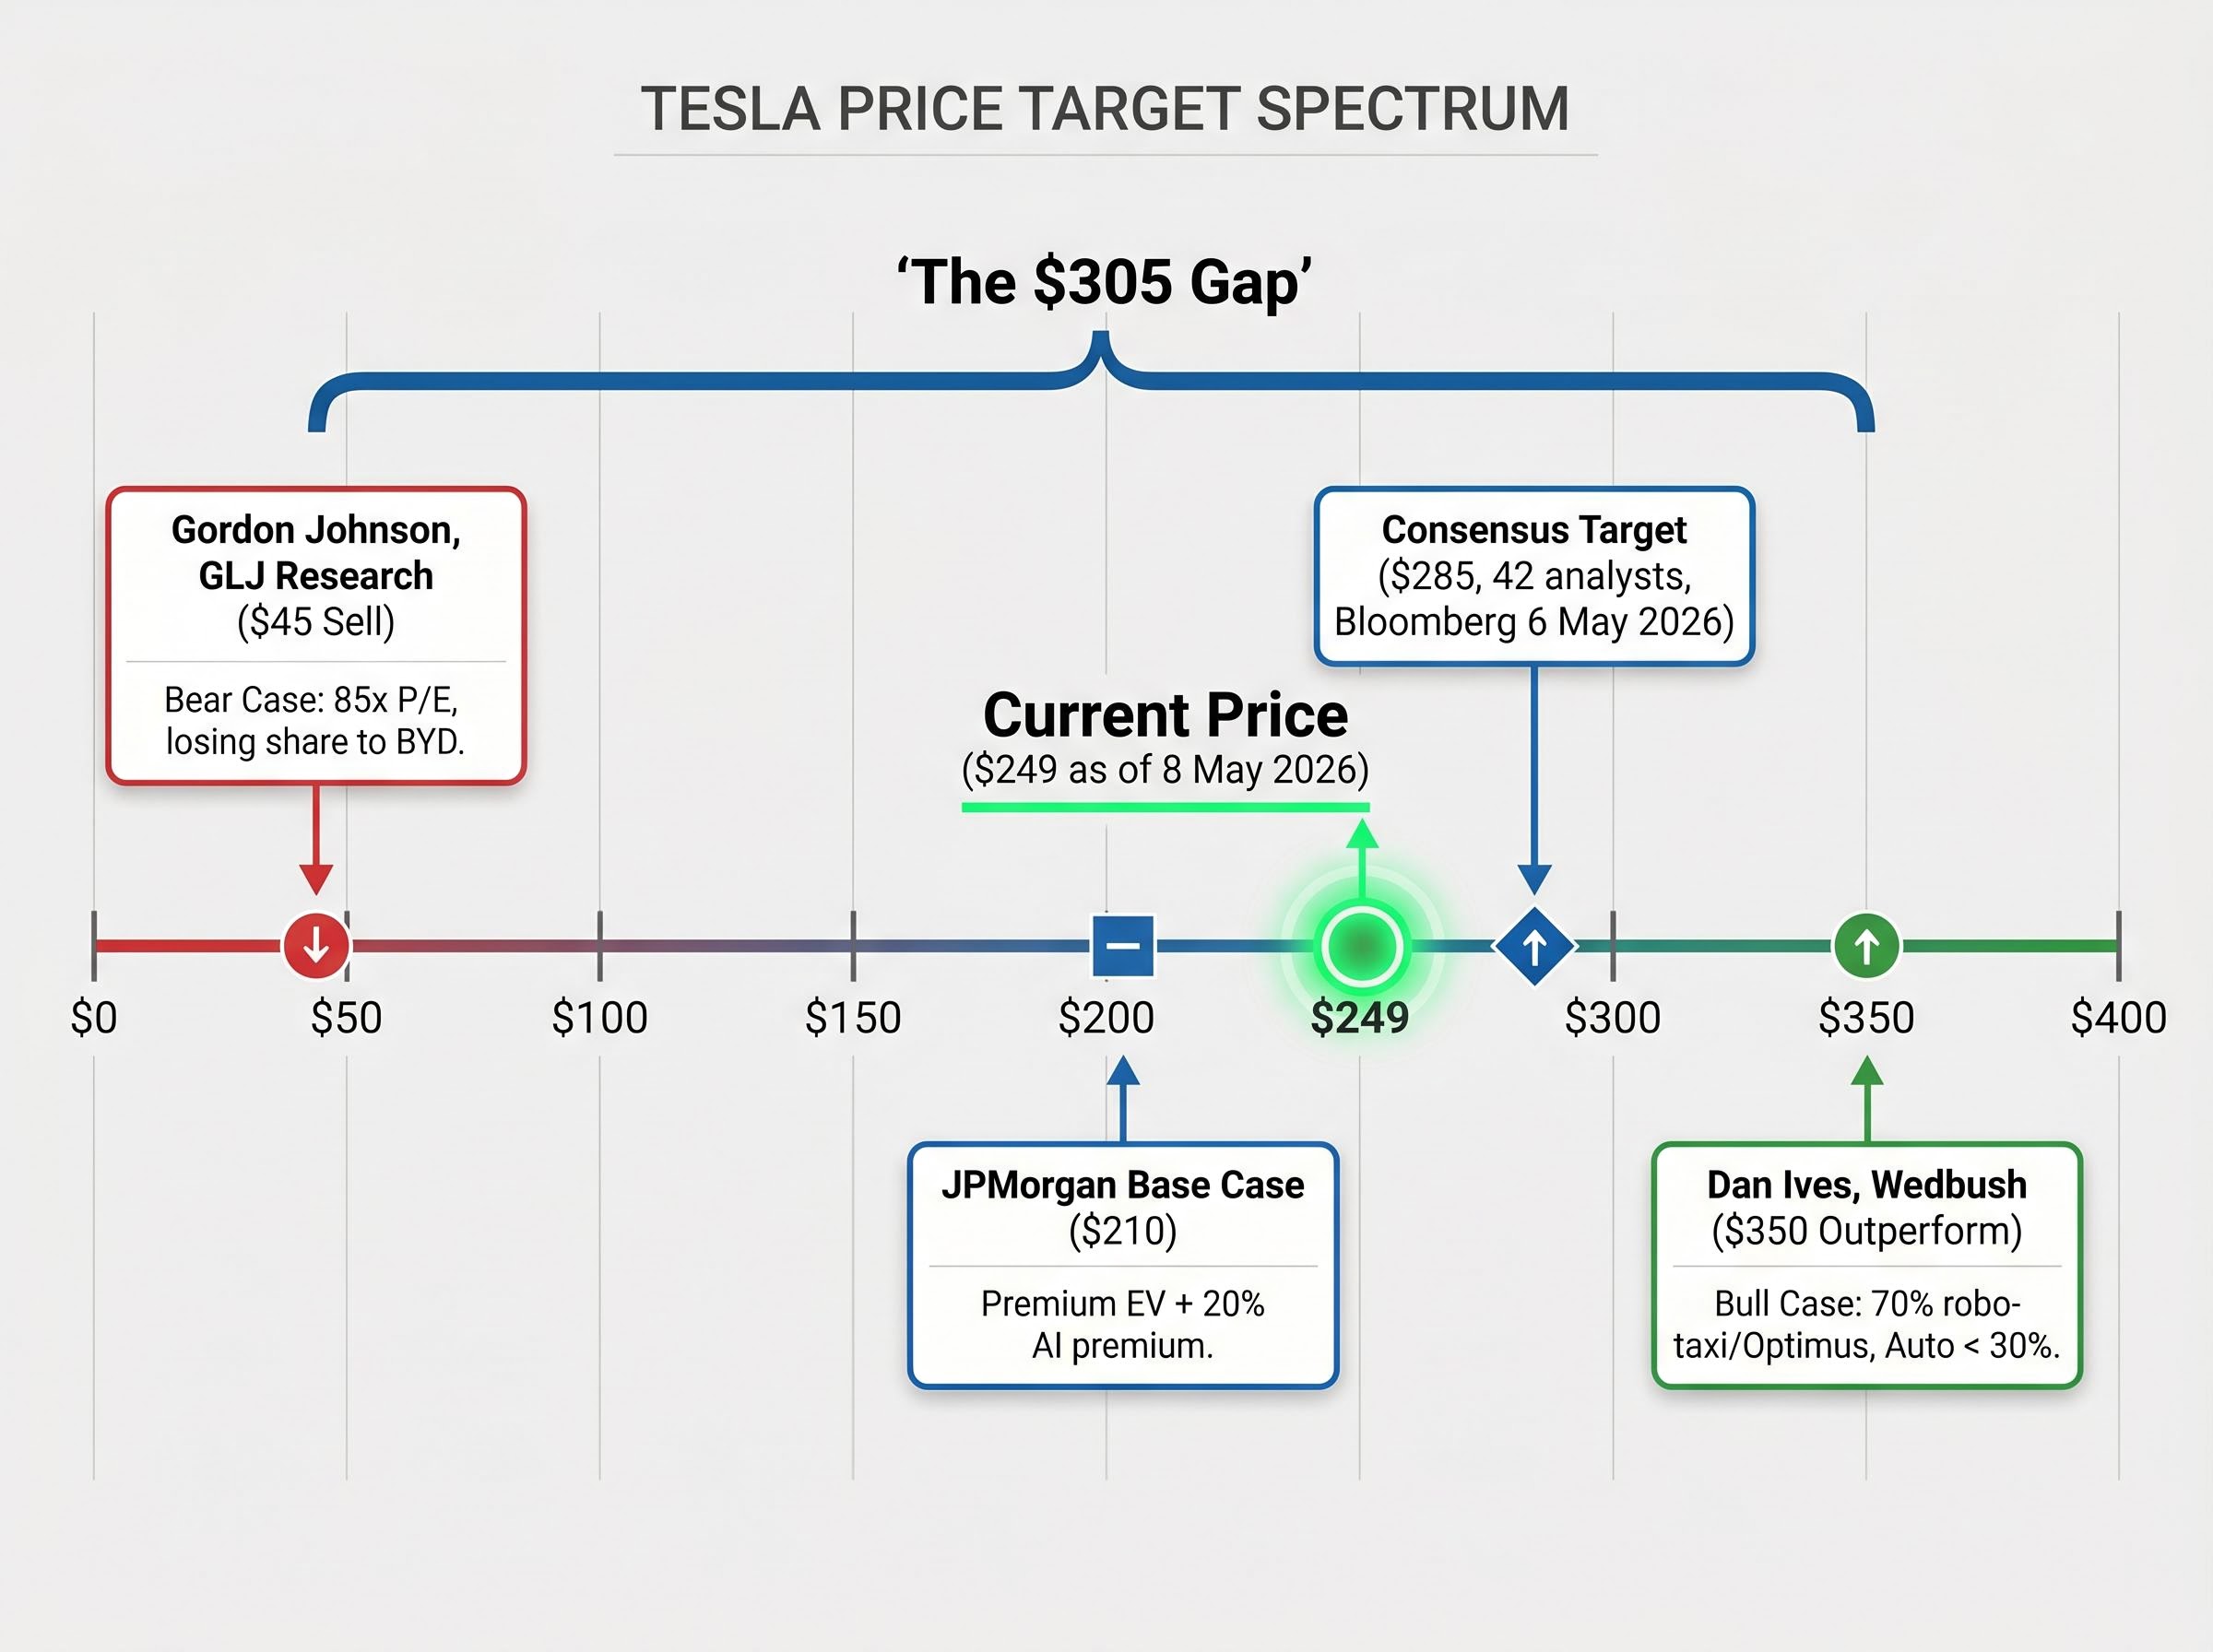
At roughly $249 per share as of 8 May 2026, Tesla carries a consensus analyst price target of $285 and individual analyst targets ranging from $45 to $350. That $305 gap between the most bearish and most bullish estimate is not noise. It is the correct output of a stock where the answer genuinely depends on which version of the future materialises. Tesla is either an AI and robotics platform company that happens to sell cars, or it is a premium electric vehicle manufacturer trading at an untenable multiple. Each reading produces a radically different intrinsic value. For investors trying to decide whether to buy, hold, or avoid the stock, the single most useful skill is learning to hold both scenarios in parallel and evaluate what each one implies for the return they can realistically expect. This guide uses Tesla’s post-Q1 2026 valuation as a live case study to teach a broadly applicable methodology: how to construct bull and bear scenarios, assign probability weights, translate them into projected returns, and use entry price sensitivity to make a more informed decision about any high-uncertainty stock.
A consensus price target feels like a verdict. $285, derived from 42 analysts surveyed by Bloomberg as of 6 May 2026, carries the weight of institutional authority. An investor glancing at that number against Tesla’s current $249 price might conclude the stock offers roughly 14% upside and move on.
That conclusion rests on a false premise. A consensus target on a company mid-transition is a mathematical average of incompatible worldviews, not a reliable estimate of fair value.
Transition-stage stock valuation breaks down precisely because standard multiples price the current business while the market is pricing the future one; a company reporting thin automotive margins cannot be assessed using the same earnings-multiple framework applied to a mature industrial peer.
Consider what produces the $305 spread between the lowest and highest targets:
JPMorgan’s base case treats Tesla as a premium EV maker with a $210 price target, estimating that “AI hype adds at most a 20% premium” to automotive-only value.
Neither analyst is being careless. They are each applying rigorous logic to a different probability distribution over the same set of future events. Averaging their outputs produces a number that reflects neither worldview accurately. When a company’s future could take two structurally different forms, investors need scenario thinking rather than point estimates.
The entire valuation debate reduces to a single question: does Tesla’s AI, robo-taxi, and Optimus revenue reach meaningful scale by the early 2030s, or does Tesla remain primarily a vehicle manufacturer?
Answering “yes” produces the bull case. Answering “no” produces the bear case. Each answer carries a complete set of financial assumptions that, applied consistently, generates the full $45-to-$350 target range.
| Assumption Variable | Bull Case | Bear Case | Why It Differs |
|---|---|---|---|
| Revenue Growth Rate | 20-35% (midpoint 27%) | 6-12% (midpoint 9%) | AI and robo-taxi revenue streams vs. auto-only growth |
| Net Profit Margin | 20-30% | 8-14% | Software-like margins on autonomy vs. manufacturing margins |
| Valuation Multiple | 25-35x earnings | 18-22x earnings | Platform premium vs. automaker peer multiple |
| Probability (Analyst View) | 75% (Cathie Wood) | 75% (Gordon Johnson) | Opposing conviction levels on the same binary question |
| Implied 10-Year Return | 11-35% annualised | All outcomes negative at ~$375 | Entry price determines whether the base case alone can deliver returns |
ARK Invest’s updated model, published 1 May 2026, assigns a $2,600 price target by 2029, with autonomy comprising 60% of value and Optimus contributing 30%. Even ARK’s auto-only bear case caps at $400, suggesting that the vehicle business alone could approach current trading levels but could not justify prices far above them.
The bear case is not a prediction of collapse. It assumes above-average EV margins in the 8-14% net profit range, healthy revenue growth of 6-12%, and a valuation multiple that any premium automaker would welcome. Yet at prices around $248-$375, every bear-case return outcome is negative or flat.
This means the current price already embeds a substantial AI premium regardless of which side of the debate an investor takes. Even investors who consider themselves cautious on Tesla’s AI ambitions are implicitly paying for them at today’s price.
Scenario-based valuation sounds like institutional machinery. In practice, it follows five steps that any investor can replicate with a spreadsheet and publicly available data. The method is more intuitive than it first appears.
The CFA Institute’s 2026 Valuation Handbook (published April 2026) recommends a default probability structure of 40% bull, 40% base, and 20% bear as a discipline for avoiding binary framing. The decision rule it suggests: buy if the probability-weighted internal rate of return exceeds 15% at the current price. For Tesla specifically, the handbook illustrates enterprise values of $2 trillion (bull), $800 billion (base), and $300 billion (bear).
Barron’s Investment Guide (May 2026) presents a worked structure: (0.70 x bull return) + (0.25 x base return) + (0.05 x bear return), with a recommendation to maintain three to five scenarios and rebalance probability weights annually.
Morningstar’s premium analyst framework assigns a wide moat designation when AI-driven upside probability exceeds 50%, and expresses fair value as a range with plus or minus 40% bands to reflect the uncertainty inherent in transformation-stage companies.
Aswath Damodaran of NYU Stern, in his March 2026 scenario valuation framework, recommends stress-testing entry prices using decision trees. His illustrative threshold for Tesla: “Buy below $200 if AI probability is below 50%.”
Four independent institutional frameworks converge on the same principle: quantify scenario probabilities using observable external milestones rather than gut feeling. Knowing this process allows investors to apply it to any high-uncertainty stock, not just Tesla.
Sum-of-the-parts valuation becomes the natural complement to scenario modelling when a company operates genuinely distinct business segments, each warranting a different risk profile and discount rate; applied to Tesla, it separates the automotive division (valued on manufacturing-sector multiples) from the autonomy and robotics segments (valued on software or speculative-growth multiples), producing a more structurally honest range than a single blended multiple can deliver.
The same company, the same earnings trajectory, and the same AI optionality produce radically different investor outcomes depending solely on when the position was initiated and at what price.
Tesla traded near $100 a few years prior to the current analysis. An investor who entered at that level could absorb a complete failure of the robo-taxi thesis and still hold a position with a comfortable margin of safety, because the automotive business alone plausibly supported a price in that range. That investor bought the bear case at a bear case price, and any AI upside would be pure bonus.
An investor entering at the current $249, or at the prior peak near $450, faces a fundamentally different proposition. At 85x price-to-earnings (a figure Gordon Johnson of GLJ Research has cited as unsustainable), the stock is not merely expensive. It is pricing in a specific positive future. Any shortfall in execution produces a return penalty even if the company performs adequately by conventional automaker standards.
A reverse DCF methodology inverts the usual valuation question: rather than projecting future cash flows forward to derive a fair value, it starts from the current market price and solves backwards for the earnings growth rate that price implicitly requires, making it a powerful tool for testing whether a stock’s entry price is already pricing in a bull-case outcome.
Institutional flows illustrate the tension. 13F filings released 7 May 2026 showed Vanguard added 2 million shares in Q1 2026, while BlackRock trimmed its stake, citing valuation stretch. Two of the world’s largest asset managers reached opposite entry-price conclusions at the same moment.
“Priced for perfection” is a phrase used loosely in financial commentary. Operationally, it describes a price at which the probability-weighted return is acceptable only if the optimistic scenario materialises, with no margin of safety for the base or bear case.
Tesla’s bear case illustrates this precisely. At approximately $375, a buyer is not paying for Tesla’s current business. They are prepaying for the AI transformation. If that transformation stalls, delays, or arrives at a smaller scale than modelled, the position produces negative returns despite the company continuing to grow its automotive revenue.
Scenario probabilities should not rest on narrative conviction. They should move when observable facts move. Three categories of evidence currently inform the probability dial on Tesla’s AI and robotics scenarios.
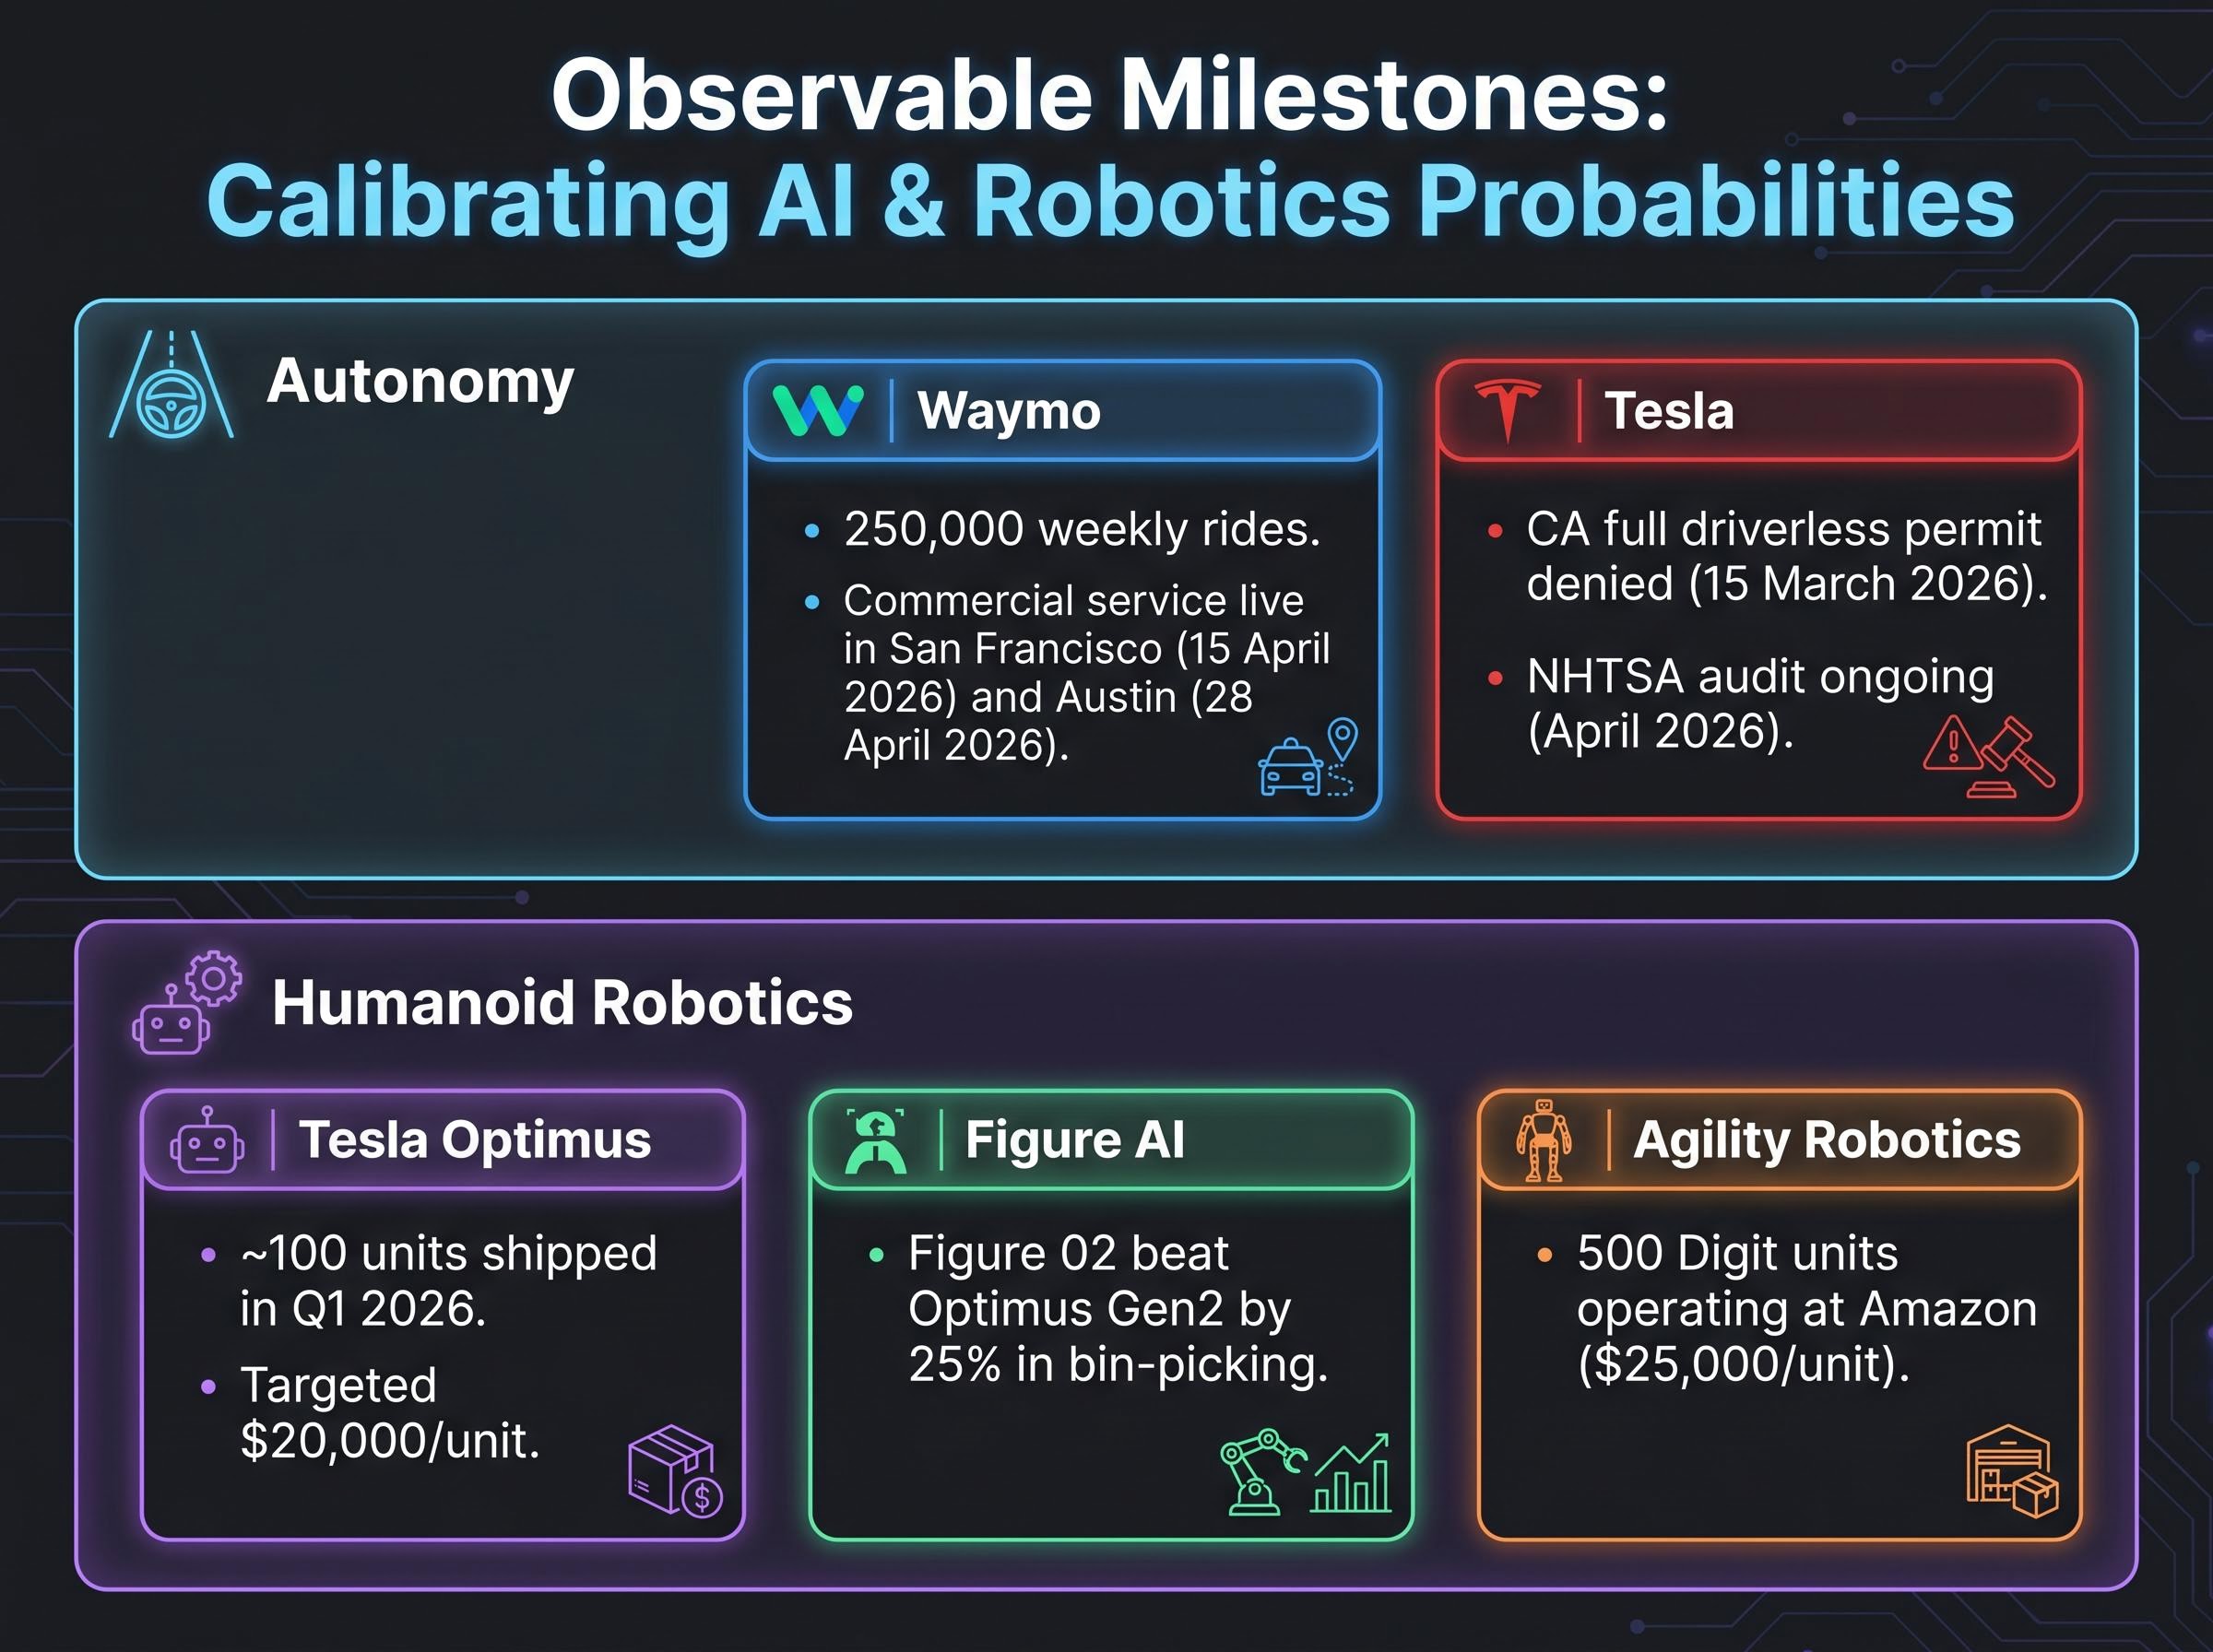
Waymo’s commercial deployment offers the clearest competitive benchmark. Weekly rides reached 250,000 (up 40% year-over-year), with fully driverless commercial service expanding to all of San Francisco on 15 April 2026 and Austin launching on 28 April 2026. First-half 2026 revenue is estimated at $1.2 billion. Waymo’s safety record stands at 0.6 disengagements per million miles, outperforming Tesla’s reported rate by 5-10x according to industry data.
In humanoid robotics, Figure AI raised $1.5 billion in April 2026 at a $26 billion valuation. Its Figure 02 humanoid beat Tesla Optimus Gen2 by 25% in bin-picking dexterity benchmarks. Boston Dynamics’ Atlas humanoid demonstrated 2x Tesla Optimus speed and lift capacity, with Hyundai planning 10,000 Atlas unit deployments by 2027. Agility Robotics already has 500 Digit units operating in Amazon fulfilment centres at $25,000 per unit, compared to Tesla’s targeted $20,000 per unit. Tesla shipped approximately 100 Optimus units in Q1 2026.
The regulatory gap remains measurable. California denied Tesla a full driverless commercial permit on 15 March 2026, citing insufficient safety data despite more than 10 billion FSD miles logged. NHTSA is conducting an ongoing audit as of April 2026 following FSD v13 incidents. Meanwhile, Waymo holds commercial approvals in multiple jurisdictions.
NHTSA’s engineering analysis of Tesla FSD, escalated to cover more than 3 million vehicles in March 2026, centres on the system’s performance in reduced visibility conditions and raises the prospect of a formal recall, adding measurable regulatory risk to near-term robo-taxi commercialisation timelines.
Elon Musk’s own timeline track record adds context: the 2016 claim that existing hardware was sufficient for full autonomy, the 2019 projection of one million robo-taxis by 2020, and the 2021 Optimus deployment claim for 2022. None materialised on schedule.
| Factor | Current Status | Implication for Tesla’s Probability | Signal |
|---|---|---|---|
| Waymo commercial deployment | 250,000 weekly rides; San Francisco and Austin live | Competitor has achieved what Tesla has not yet demonstrated commercially | Bear |
| Tesla California permit status | Denied 15 March 2026; employee testing only | Regulatory lag reduces near-term robo-taxi revenue probability | Bear |
| Optimus unit shipments (Q1 2026) | ~100 units; pilot deployment at own factories | Low volume vs. competitors with commercial contracts | Bear |
| Figure AI dexterity benchmark | 25% ahead of Optimus Gen2 in bin-picking | Tesla may not hold a technical advantage in humanoid robotics | Bear |
| NHTSA audit status | Ongoing as of April 2026 | Regulatory uncertainty could delay or restrict FSD deployment | Bear |
The CFA Institute’s 2026 Valuation Handbook recommends using observable external milestones, such as competitor commercialisation timelines and regulatory approvals, to discipline valuation assumptions and reduce cognitive bias.
None of this evidence is conclusive. Tesla’s scale advantages in data collection and manufacturing could still prove decisive over longer time horizons. The point is that these are the inputs that should move probability weights, not earnings-call rhetoric or social media sentiment.
AI valuation frameworks applied across the broader market arrive at split verdicts: the Shiller CAPE ratio at 40.11 as of early May 2026 sits at historically extreme levels, yet Minsky cycle analysis classifies the major AI infrastructure investors in the speculative rather than Ponzi financing stage, a distinction that carries material implications for how much further elevated multiples can persist before a correction becomes structurally probable.
Any company whose current price embeds a transformation that has not yet occurred requires scenario-based analysis rather than conventional comparable valuation. Tesla is the most visible example, but the same framework applies to any stock where the bull and bear cases describe structurally different businesses.
Through this case study, four specific analytical skills emerge:
Four institutional frameworks, from the CFA Institute, Damodaran at NYU Stern, Barron’s, and Morningstar, all converge on this methodology as standard professional practice. It is not a speculative approach. It is how institutional capital evaluates high-uncertainty positions.
Analyst EPS estimates for Tesla declined more than 90% from their peak before recovering, a reminder that even professionals using these tools must revisit their probabilities as evidence changes. Tesla’s projected $25 billion capital expenditure programme for 2026 underscores that transformation timelines extend even when narrative momentum is strong.
The methodology does not tell an investor whether Tesla succeeds. It tells them what they are implicitly betting on at any given price, and at what price that bet becomes unfavourable regardless of company quality.
Tesla’s bull and bear cases are not arguments about the same investment. They are descriptions of two different companies that currently share the same ticker symbol and the same price. An investor who enters at a price supported by automotive fundamentals alone holds a different risk profile than one who enters at a price that requires full AI transformation to break even.
This framework applies any time a company’s market price is pricing in a future state rather than a current one. The discipline is straightforward: revisit probability weights annually as observable milestones update. Regulatory approvals, competitor deployments, and Tesla’s own unit shipment data are the evidence that should shift assumptions, not headlines or sentiment.
Investors who want to apply this framework immediately can use Tesla’s upcoming Q3 2026 product unveil as a live test. Before the event, write down scenario assumptions and probability weights. After the event, update them based on what was announced and what the evidence now supports. That discipline, applied consistently, is what separates systematic analysis from narrative-driven decision-making.
This article is for informational purposes only and should not be considered financial advice. Investors should conduct their own research and consult with financial professionals before making investment decisions. Past performance does not guarantee future results. Financial projections referenced in this guide are subject to market conditions and various risk factors.
Scenario-based stock valuation analysis is a method where investors build two or more distinct financial models representing different possible futures for a company, assign probability weights to each, and calculate a probability-weighted expected return to determine whether the current entry price offers an attractive risk-reward profile.
Wide price target spreads occur when analysts hold fundamentally different views on which business a company will become; for Tesla, the gap between $45 and $350 reflects one camp valuing it as an automaker and another valuing it as an AI and robotics platform, producing incompatible financial assumptions and therefore incompatible price targets.
Institutional frameworks, including guidance from the CFA Institute and Aswath Damodaran at NYU Stern, recommend anchoring probabilities to observable external milestones such as regulatory approvals, competitor commercialisation timelines, and product shipment data rather than narrative conviction or earnings-call sentiment.
A stock is priced for perfection when its current market price produces an acceptable probability-weighted return only if the optimistic scenario materialises, meaning there is no margin of safety if the company merely performs in line with its base or bear case.
Entry price is the single most influential variable on returns for transformation stocks; an investor who entered Tesla near $100 held a position supported by automotive fundamentals alone and received AI upside as a bonus, while an investor entering at $249 or higher requires at least partial materialisation of the AI thesis just to achieve a satisfactory return.


