Most investors track the price of crude oil. Fewer track what happens between crude and the refined diesel that actually powers the economy. That gap, measured by something called the diesel crack spread, just hit a level never recorded before.
Last week, the US diesel crack spread crossed $100 per barrel for the first time on record, according to ING strategists Ewa Manthey and Warren Patterson. That is not a typo. Since the US-Iran conflict began, the spread has more than doubled, and it is now up over 20% for the month alone. When a refining margin metric moves that far, that fast, it is telling you something specific: the system that turns crude oil into diesel cannot keep up with demand at any recent price level.
Here is what the diesel crack spread actually measures, why it just broke every prior record, and what it means for your freight costs, your inflation outlook, and your portfolio positioning.
What a $100 diesel crack spread actually means
Record reading: Breaking above $100 per barrel for the first time ever, the US diesel crack spread has surged more than 20% since the start of the month and has more than doubled in value from where it stood when the US-Iran conflict first escalated.
That number needs context, because it is easy to confuse with the retail price of diesel at the pump. It is not that. The crack spread is a refining margin signal, and the record reading tells you that refined diesel is extraordinarily scarce relative to the crude oil used to produce it.
The CME Group crack spread mechanics framework defines the spread as the dollar-per-barrel difference between a refined product futures price and its crude oil input, giving refiners and traders a standardised way to measure gross processing margins across different fuel types.
The mechanics of a crack spread
A crack spread is the dollar-per-barrel difference between ultra-low sulphur diesel (ULSD) futures and a crude benchmark like WTI. Think of it as the refiner’s gross profit indicator: the wider the spread, the more money a refiner earns for every barrel of crude it processes into diesel.
When that spread doubles in weeks and shatters all prior records, the market is signalling that refining capacity cannot match diesel demand at current prices. That gap has direct consequences for your freight costs, your portfolio, and the broader inflation picture.
When big ASX news breaks, our subscribers know first
How crack spreads behave under normal conditions
Under typical market conditions, the US diesel crack spread trades in a range of roughly $15-$40 per barrel. Variation within that band is driven by a handful of recurring factors:
- Seasonal demand shifts (heating oil in winter, agricultural machinery demand during harvest)
- Crude oil quality differentials affecting refinery yields
- Refinery utilisation rates and scheduled maintenance cycles
The prior stress ceiling came in 2022, when post-pandemic refinery closures collided with a sharp demand recovery and pushed cracks above $60 per barrel. That was considered extreme at the time.
The current reading above $100 sits at roughly four to six times the normal range. That is not an aggressive market call or a seasonal fluctuation. It is a structural break from every historical precedent, and that distinction shapes how you should think about the duration and significance of the current environment.
| Period | Diesel Crack Range | Key Driver |
|---|---|---|
| Normal conditions | $15-$40/bbl | Seasonal demand, crude quality factors |
| 2022 stress episode | $60+/bbl | Post-pandemic refinery closures, demand recovery |
| Current record | Above $100/bbl | Geopolitical supply shocks, inventory drawdowns |
Three supply shocks that drove cracks to the record
The $100 reading did not arrive from a single cause. It is the product of three overlapping disruptions, each compounding the last.
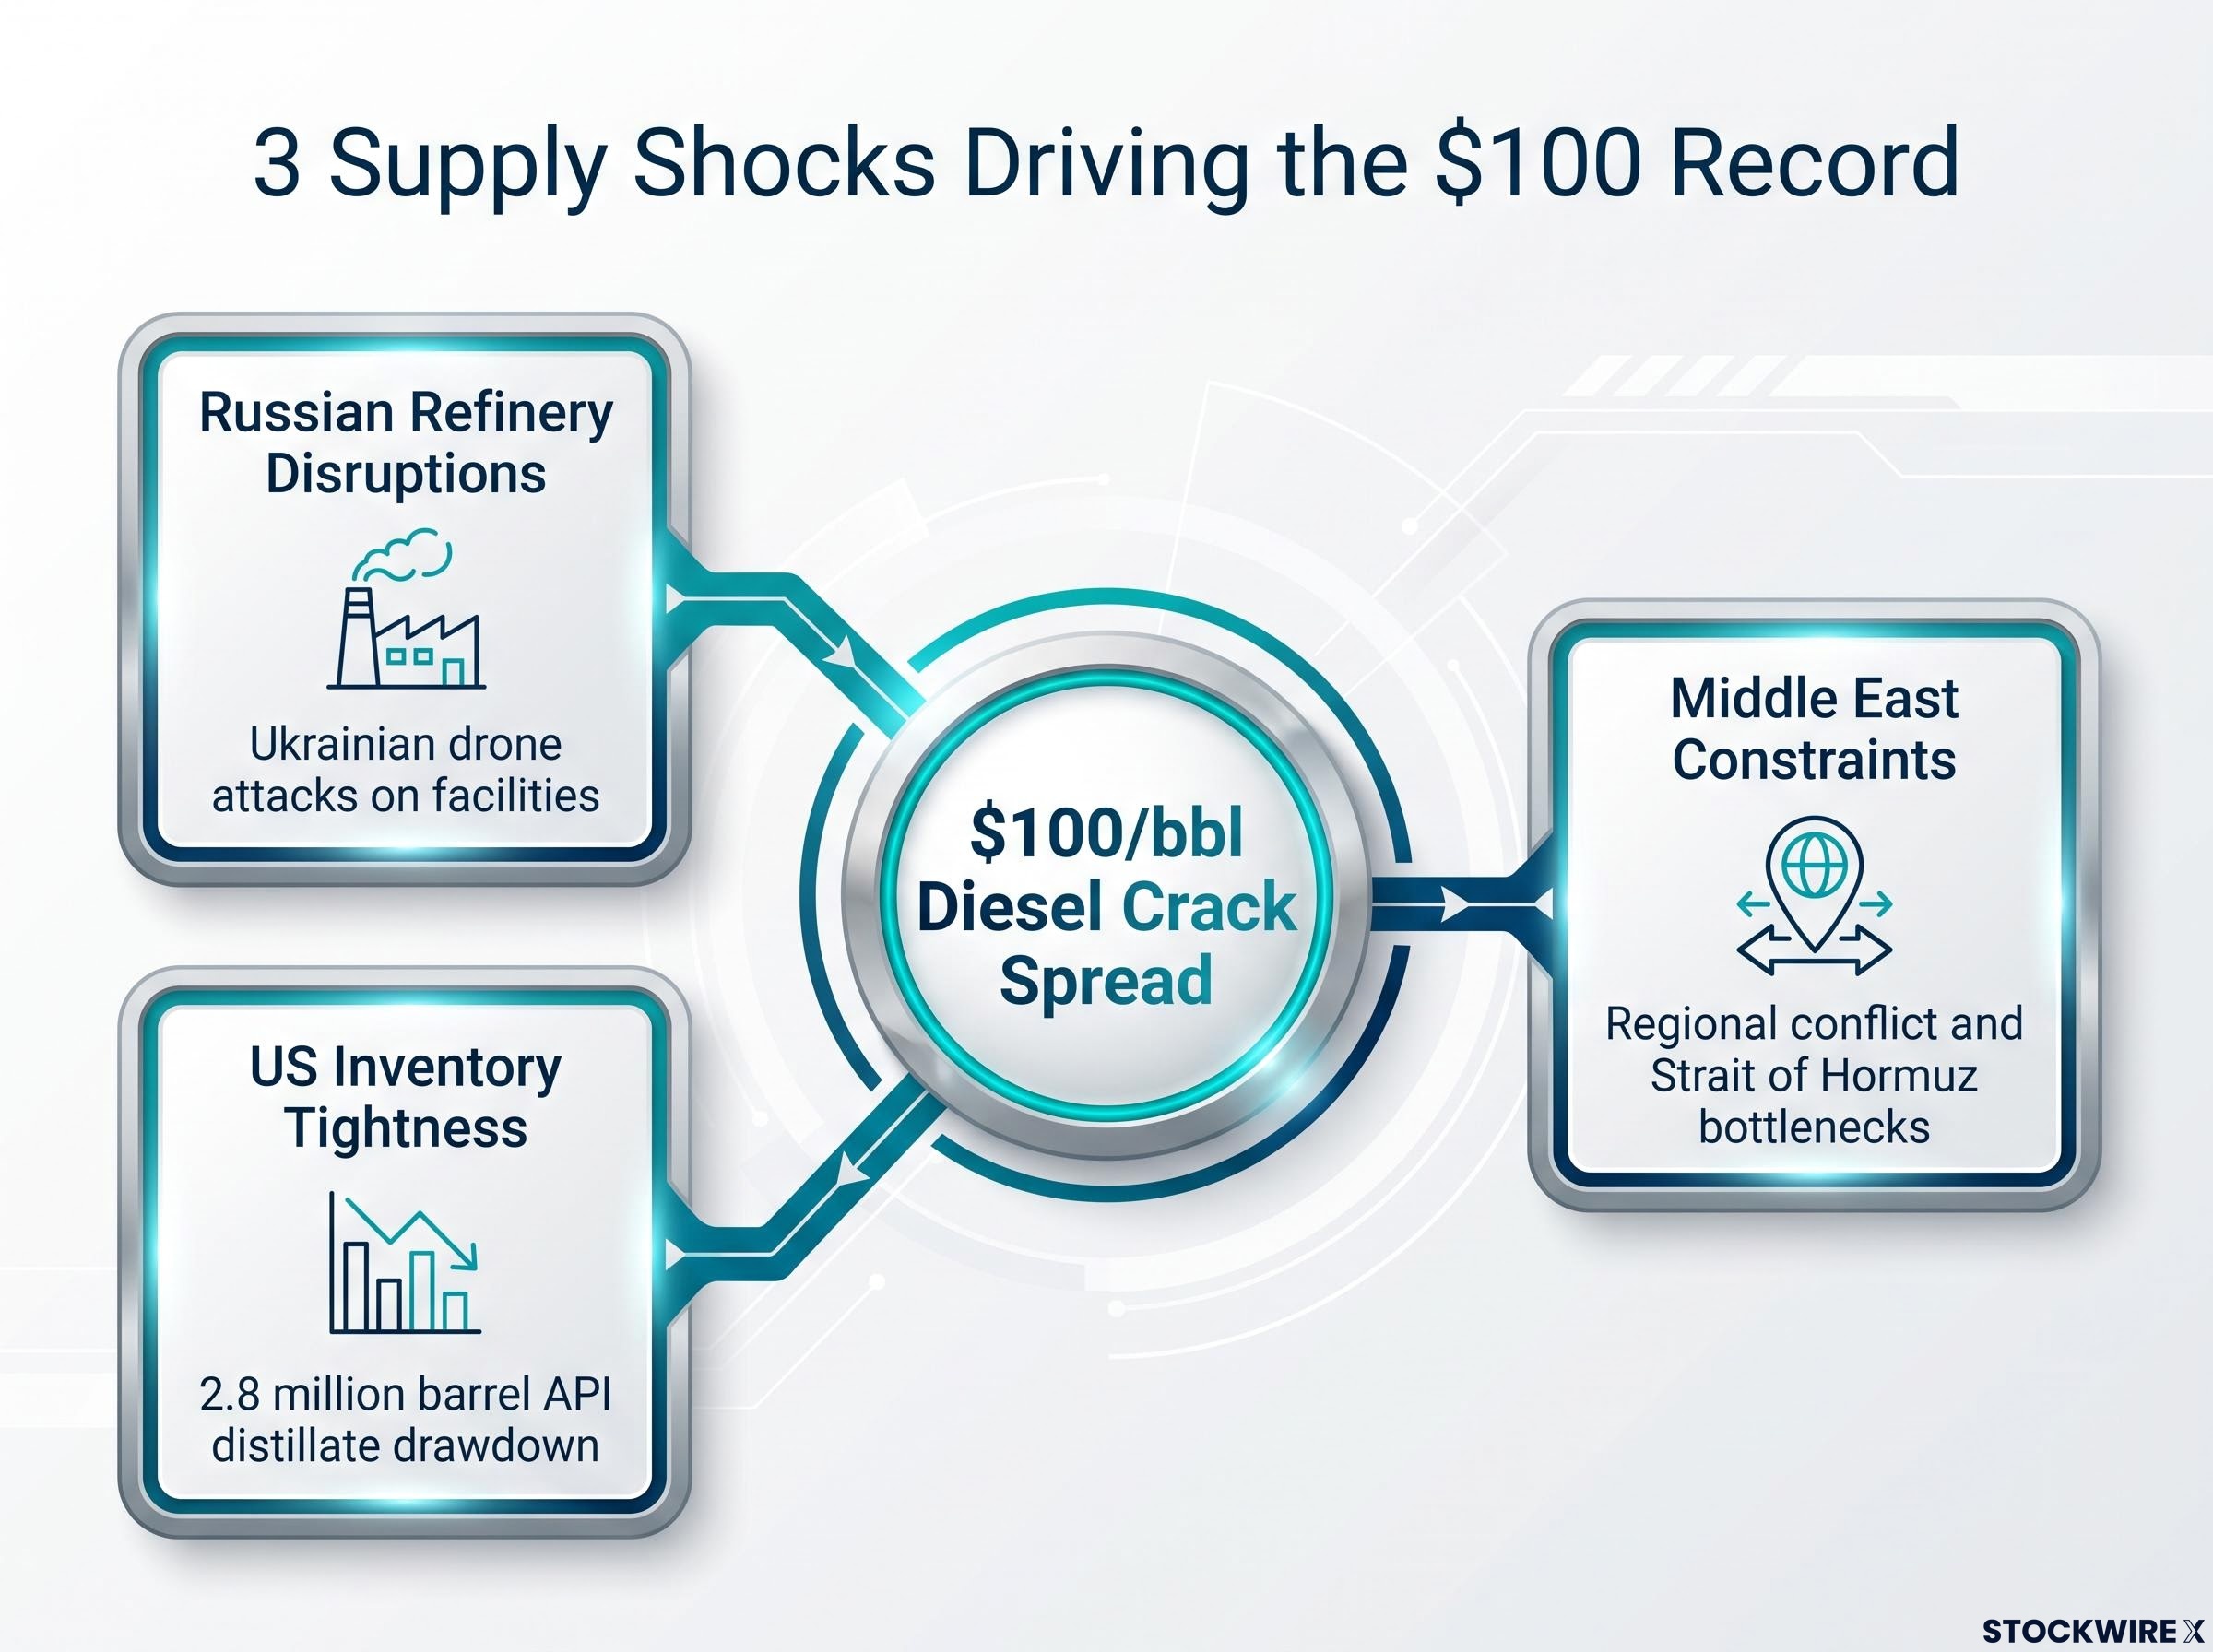
- Russian refinery disruptions: Sustained Ukrainian drone attacks on Russian refining facilities have knocked out a significant source of global diesel exports, leaving a structural hole in international supply that has not been filled by alternative barrels.
- Middle East constraints: Heightened conflict in the region has damaged refineries and constrained flows through shipping lanes, including the Strait of Hormuz. Regional refined-product exports have been limited, tightening the supply of replacement barrels that would normally offset losses elsewhere.
- US inventory data confirming the tightness is real and measurable: The most recent weekly figures from the American Petroleum Institute (API) translated the geopolitical disruptions into hard numbers.
What the inventory data confirms
The most recent weekly API report recorded a drawdown of 2.8 million barrels in distillate stocks, converting the headline geopolitical story into concrete, measurable evidence of tightening supply across the US market.
The weekly API figures showed US crude stockpiles fell by 328,000 barrels, a figure considerably larger than the consensus expectation of a 74,000-barrel draw. At the Cushing, Oklahoma delivery hub, which serves as the WTI pricing point, inventories shrank by 1.4 million barrels across the same reporting period.
Reading US oil inventory data accurately requires separating the headline crude draw from product-specific figures, because a large crude decline accompanied by a gasoline build can point to a very different supply conclusion than the top-line number suggests.
Petrol stocks bucked the trend, building by around 1.1 million barrels during the period. That divergence isolates the problem: this is not a broad energy shortage. It is a diesel-specific supply crunch, which is exactly where you would expect crack spreads to reflect the pressure most acutely.
Why diesel crack spreads ripple through the whole economy
If you do not hold energy stocks, you might assume this is someone else’s problem. It is not. Diesel powers the physical economy in ways that crude oil prices alone do not capture.
The sectors with the most direct exposure include:
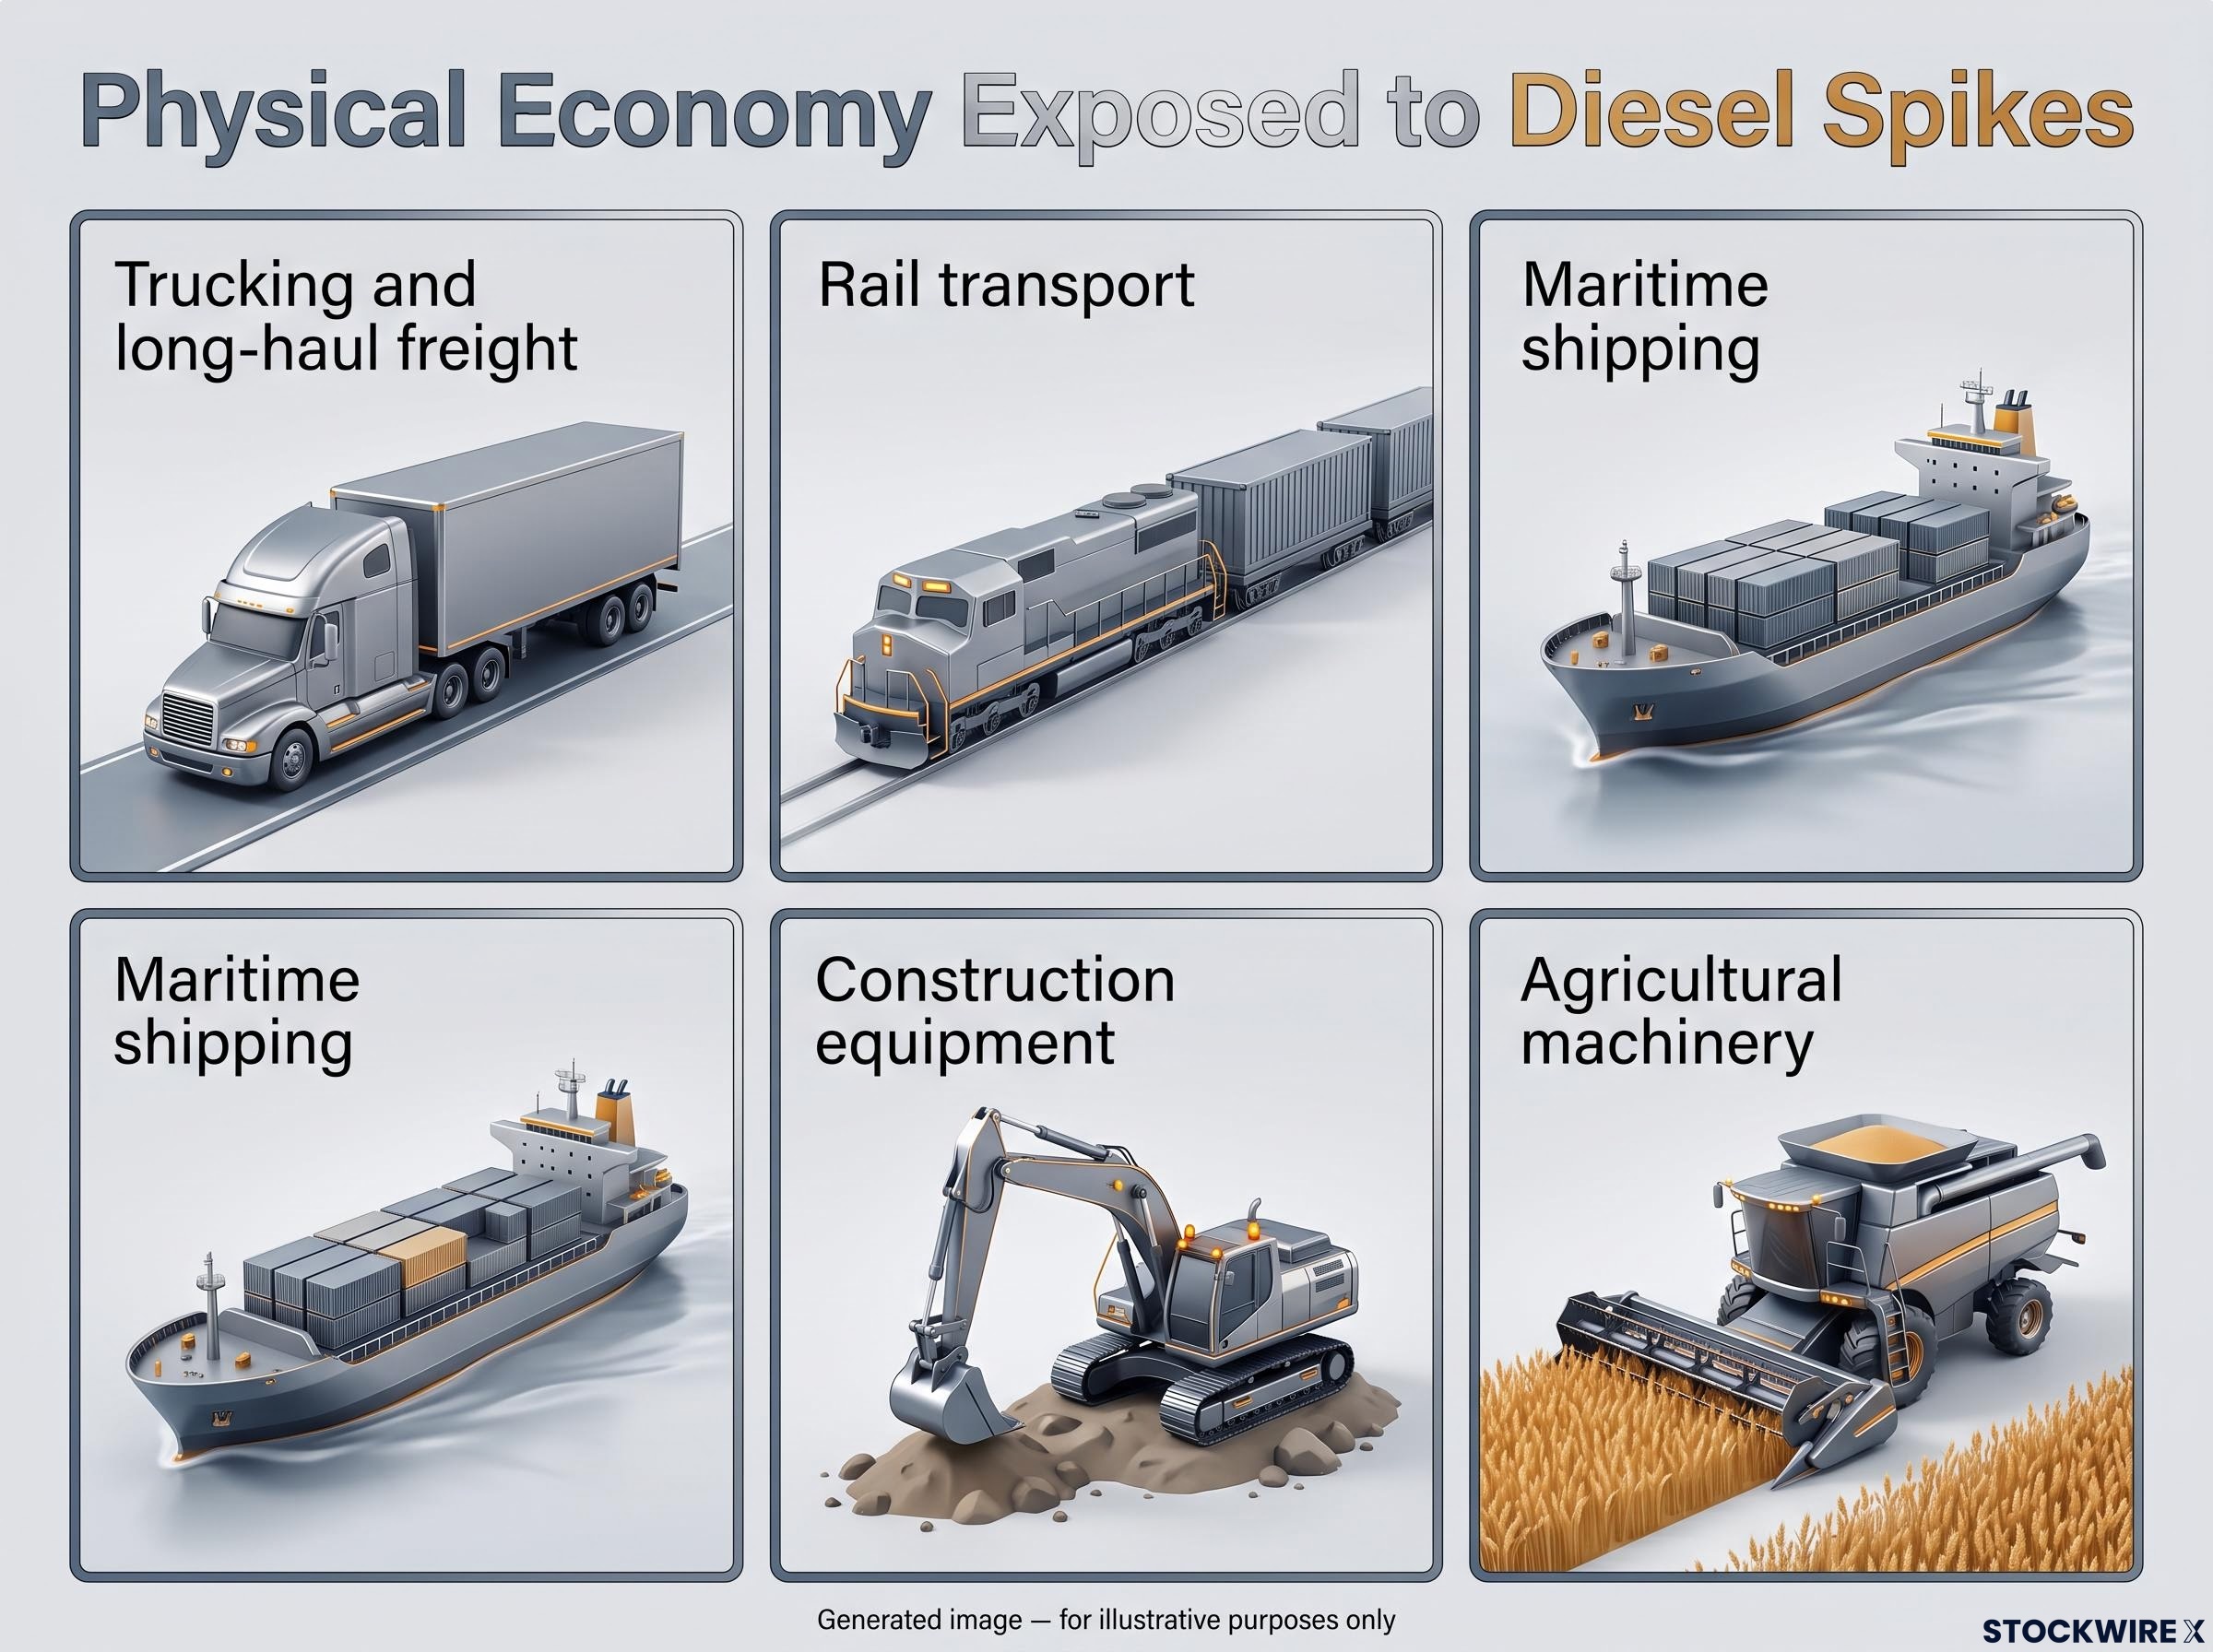
- Trucking and long-haul freight
- Rail transport
- Maritime shipping
- Construction equipment
- Agricultural machinery
When wholesale diesel prices spike, the cost of moving and making physical goods rises with them. Retail pump prices follow with a lag, even when crude prices themselves are relatively stable. That is the transmission mechanism: the crack spread widens, wholesale costs climb, and the increase filters into logistics bills, shipping rates, and eventually consumer goods prices.
War-driven energy costs routed through freight rates and import prices contaminate core inflation measures in ways that standard CPI categories do not capture, which means the diesel crack spread’s effect on consumer prices is systematically larger than headline inflation figures suggest.
Analyst commentary has framed the current constraint as structural and geopolitical rather than purely temporary, suggesting upward pressure on logistics and freight costs could persist for months rather than weeks.
With seasonal demand from agriculture and freight running near peak levels when the record was set, the price response was amplified further. For you, if you track inflation, logistics-sensitive equities, or consumer goods companies, the diesel crack is not just an energy market curiosity. It is an early warning that input costs are rising across every industry that moves physical goods.
How energy investors can position around record crack spreads
Moving from diagnosis to action, the investment options around record crack spreads fall into three tiers, ordered by how directly they track the spread itself.
| Investment Tier | Examples | Crack Spread Leverage | Key Risk |
|---|---|---|---|
| Pure-play refiners | Standalone refining companies | Highest | Margin compression on geopolitical de-escalation |
| Integrated majors | Large integrated oil companies | Moderate | Diversified but diluted exposure |
| Diversified exposure | Energy ETFs, midstream companies | Lowest | Limited direct crack spread sensitivity |
Pure-play refiners sit at the top because high crack spreads translate almost mechanically into refining margin expansion. Each barrel processed at a $100 crack yields extraordinary gross profit compared to the same barrel at a $25 crack. When margins are this wide, analysts typically revise earnings expectations higher.
Refining margin expansion of the scale seen in 2026 has historically translated into sharp share price re-ratings for pure-play refiners, as markets reprice earnings multiples when sustained wide cracks signal a structural rather than seasonal profitability shift.
Integrated majors benefit from both upstream crude prices and downstream margin expansion, but their diversification dilutes the pure crack-spread leverage. They are a more moderate play on the same theme.
Energy ETFs and midstream companies offer the broadest exposure with the least direct crack spread sensitivity. They suit investors who want energy exposure without concentrating in a single refiner.
Managing the cyclicality risk
A direct caution is necessary here. Refining equities are highly cyclical, and crack spreads can compress as sharply as they expand. The 2022 episode is the clearest precedent: cracks pushed above $60, then compressed once bottlenecks eased. The size of the current opportunity and the speed of a potential reversal are directly proportional. The bigger the crack, the faster it can close when conditions shift.
US diesel output is rising, yet cracks remain above $100. That tells you this is a refinery capacity and replacement-barrel problem rather than a simple price-incentive issue. But three variables will determine when and how fast the reversal comes: geopolitical developments affecting Russian and Middle Eastern refinery output, weekly US distillate inventory data, and refinery utilisation rates.
Any crack spread position should be managed as a cyclical trade requiring active monitoring, not a structural allocation you can set and forget.
What could bring diesel cracks back to earth, and how fast
Applying the same analytical rigour to the downside scenario, four developments could normalise diesel crack spreads:
- Geopolitical de-escalation restoring Russian and Middle Eastern diesel export flows to global markets
- New refinery capacity coming online in Asia and the Middle East, expanding effective refined-product supply
- Demand destruction from sustained high prices and weaker economic growth curbing freight and industrial activity
- Seasonal demand troughs outside harvest and winter heating periods, when distillate consumption naturally dips
Analysts currently view the constraint as structural and geopolitical rather than purely temporary. But past episodes show mean-reversion can be swift once key bottlenecks ease. The 2022 episode, when cracks moved above $60 before compressing back toward the historical range, illustrates the speed of both directions.
For your position management, the rate and direction of crack spread movement may be more informative than any single absolute reading. A crack falling from $100 to $60 in two weeks tells you something important is shifting, even if $60 still looks historically elevated.
The normal range of $15-$40 per barrel remains the mean-reversion target you should hold in mind when evaluating whether any given decline represents a genuine shift or a temporary pause.
Reading the diesel crack as a real-time energy market gauge
The current $100+ reading is your starting reference point. What matters from here is direction and velocity.
When diesel cracks widen, they signal:
- Tightening diesel supply
- Strong refiner margins and potential earnings upgrades
- Building inflation pressure through freight and logistics costs
When diesel cracks narrow, they signal:
- Supply relief from new capacity or resumed exports
- Margin compression for refiners, often reflected quickly in share prices
- Potential easing of logistics-driven inflation
Your monitoring framework comes down to three variables, tracked weekly: distillate inventory data from the API, geopolitical developments affecting Russian and Middle Eastern refinery output, and US refinery utilisation rates. Together, these three inputs tell you whether the structural constraints driving the record spread are easing or intensifying.
Tracking distillate inventory data week-by-week, rather than treating any single API or EIA release as definitive, is the practical discipline that separates durable signals from noise in a market where a single outsized draw can reflect timing effects as much as structural tightness.
The diesel crack spread is one of the few energy metrics that simultaneously signals refining profitability, macro inflation risk, and geopolitical supply stress. Whether or not you hold energy positions, it belongs in your weekly monitoring routine.
This article is for informational purposes only and should not be considered financial advice. Investors should conduct their own research and consult with financial professionals before making investment decisions. Past performance does not guarantee future results. Financial projections are subject to market conditions and various risk factors.