How to Run a Scenario-Based Stock Valuation Analysis
14 mins ago

A stock trading at more than 60 times forward earnings is either priced for a future that has not arrived yet, or priced for a future that never will. For investors evaluating Tesla in May 2026, that distinction is worth hundreds of billions of dollars. The company’s Q1 2026 results beat analyst estimates on revenue ($22.4 billion, up 16% year-over-year), earnings per share ($0.40 versus $0.35 consensus), and gross margin (21.7% versus 17% expected). Yet the stock’s valuation still reflects something far beyond a car company. The price embeds an assumption that Optimus robots, robotaxi networks, and AI infrastructure will collectively transform Tesla’s margin profile within the next decade. Whether that assumption is right is unknowable today. What is knowable is the methodology for stress-testing it before committing capital.
This guide uses Tesla’s publicly available data as a teaching case. Readers will learn how to construct bull and bear scenario models for any company in transition, understand why entry price is one of the most consequential variables in long-term investing, and leave with a repeatable framework applicable well beyond a single stock.
The frustration is familiar. An investor pulls up a trailing price-to-earnings ratio, checks book value, looks for a dividend yield, and the numbers produce an answer that bears no relationship to where the stock actually trades. The problem is not the analysis. The problem is the model.
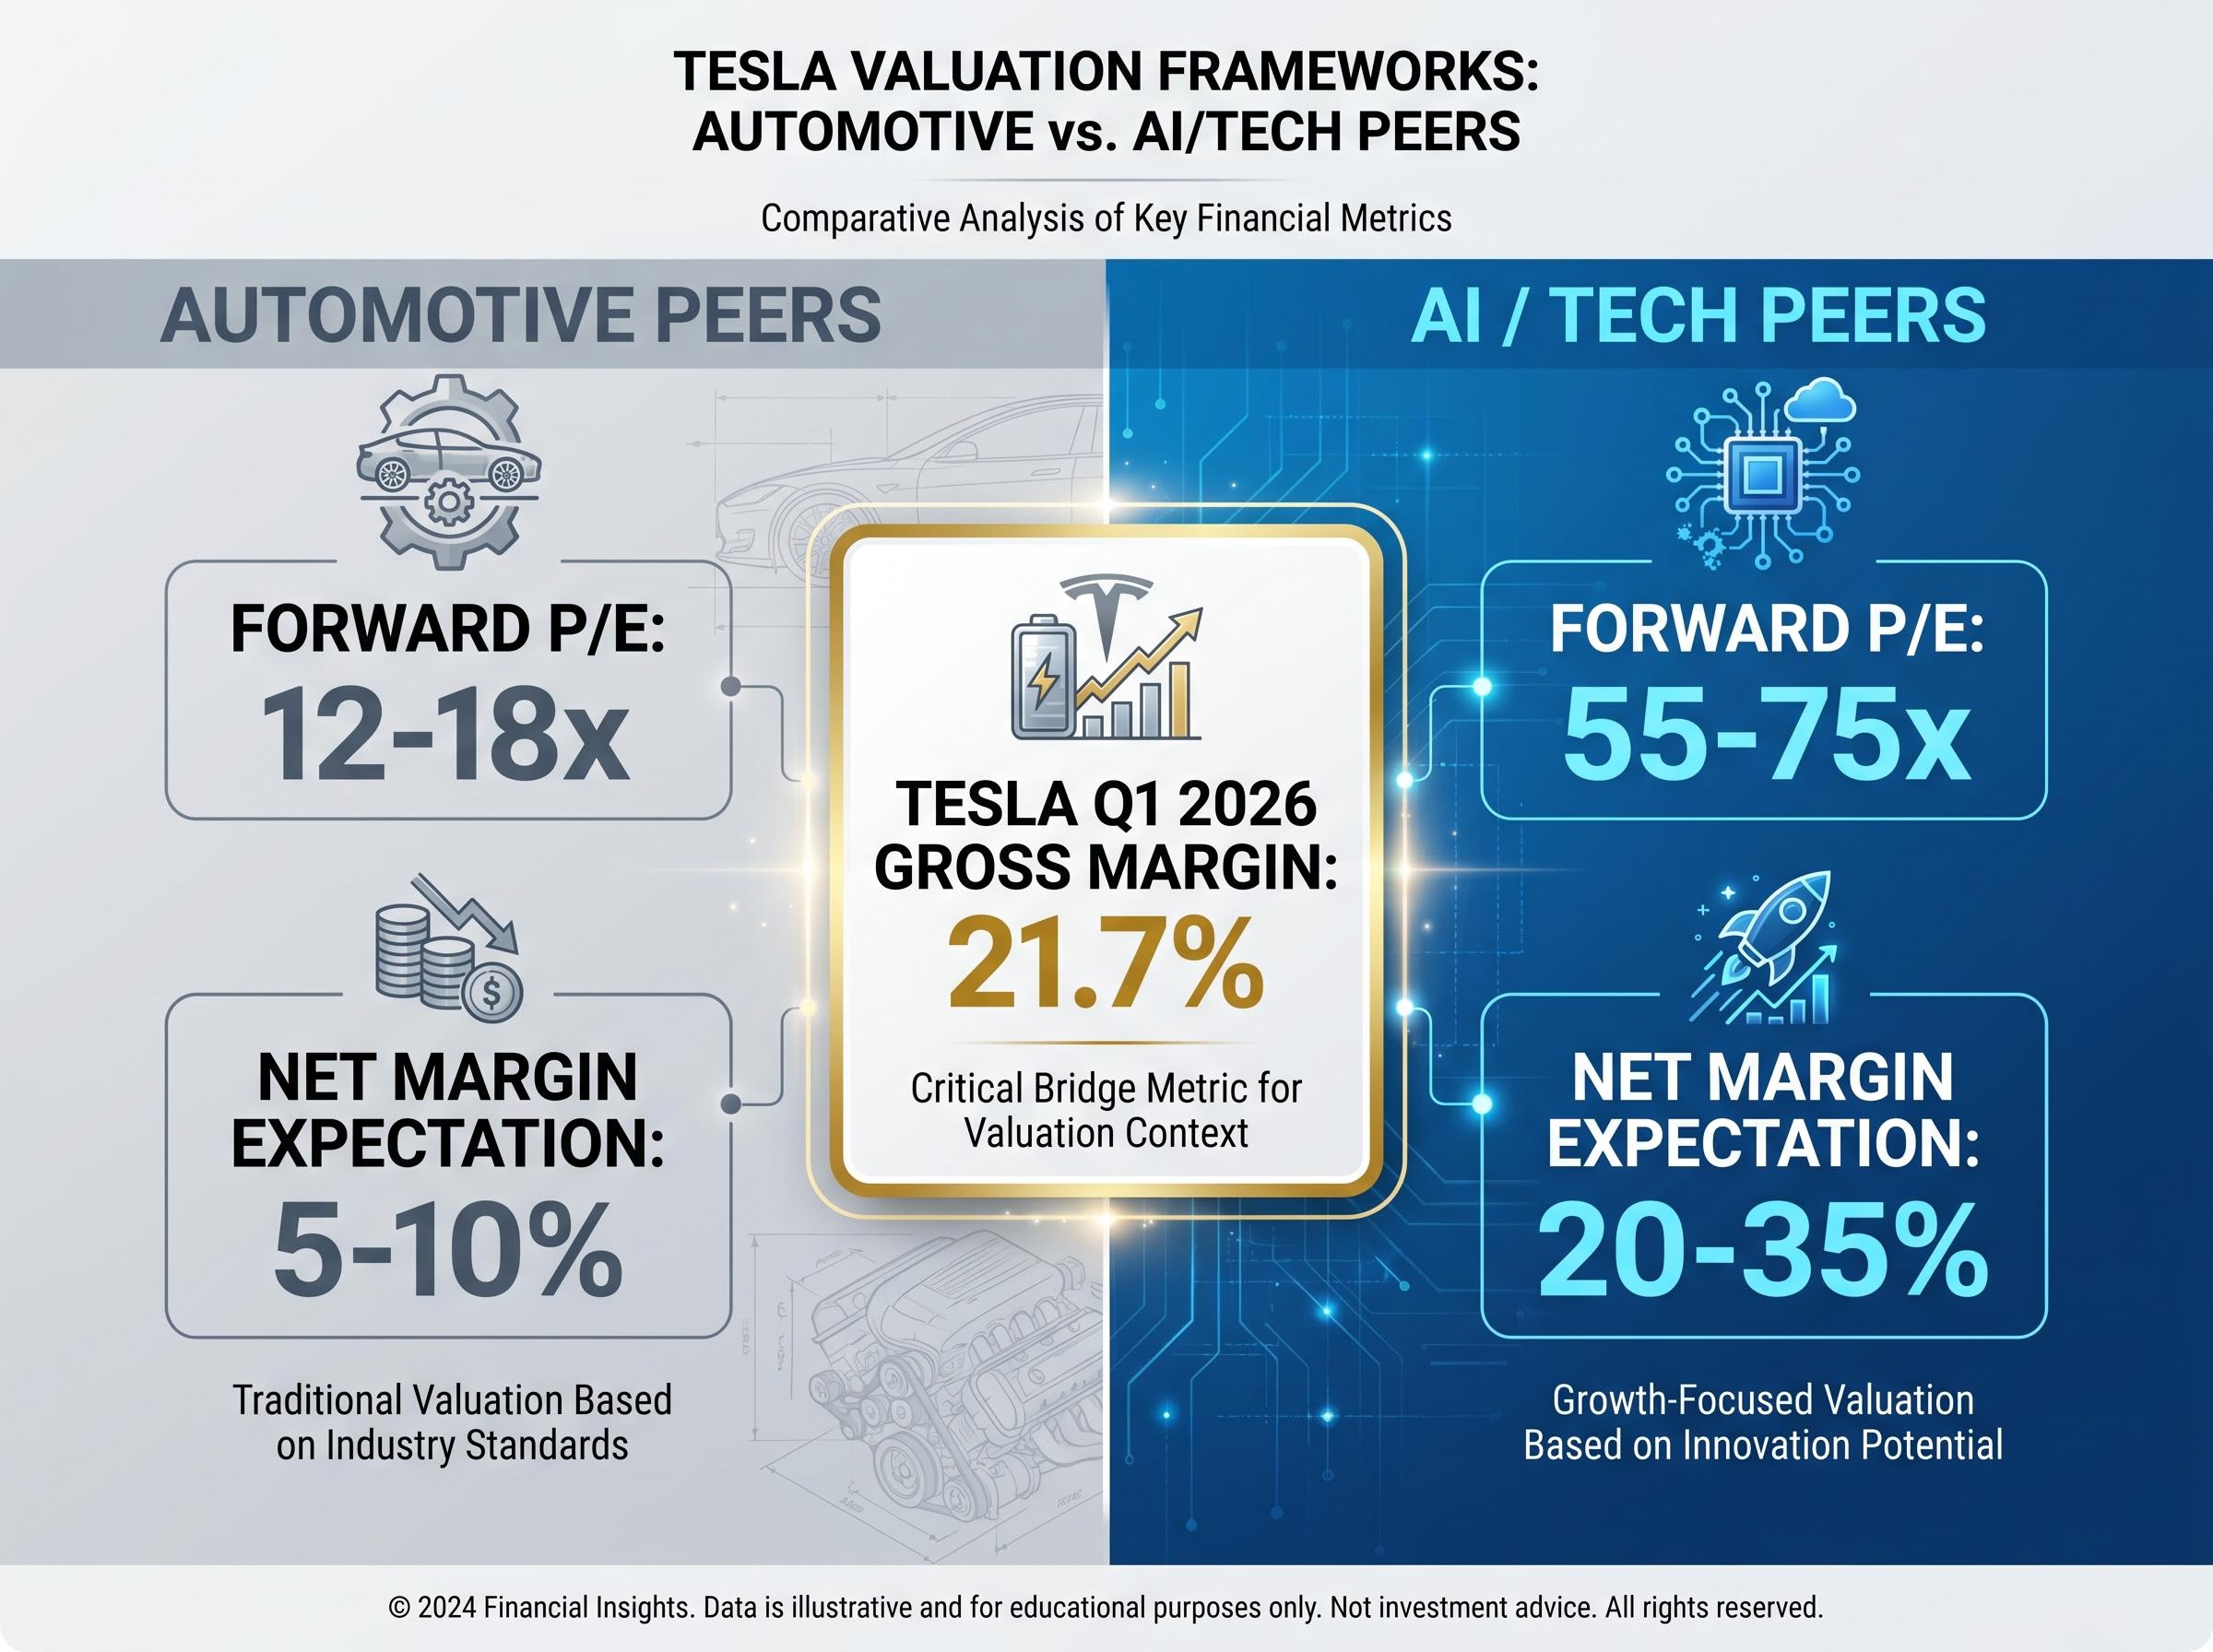
Standard valuation tools were built for companies with stable business models and predictable earnings trajectories. They fail when applied to a company mid-pivot between identities because the market is not pricing what the company currently earns. It is pricing what the company might become. For Tesla, that choice is deliberate, and it carries real consequences: traditional auto peers trade at roughly 12-18 times forward earnings, while analysts applying AI and robotics frameworks to Tesla use forward P/E multiples in the range of 55-75 times on 2027 estimates.
The gap between what Tesla earns today and what its stock price implies is only intelligible once an investor understands that price discovery mechanics aggregate all available information about future expectations, not just current period results, meaning a stock can trade at 60 times forward earnings because buyers are collectively pricing a different company than the one that filed last quarter’s 10-Q.
Tesla’s 21.7% gross margin in Q1 2026 sits in an analytical no-man’s-land. It is well above legacy automaker levels but below software-company norms. The analyst consensus price target of approximately $413, drawn from roughly 47 analysts, reflects genuine disagreement about which peer group applies, not a shared view with minor differences.
The comparable company an analyst selects determines the valuation output almost entirely. Applying automotive peers produces one implied fair value. Applying AI and technology peers produces another. Neither is objectively wrong; each represents a different thesis about what Tesla will become over the next decade.
| Peer Framework | Typical Forward P/E Range | Typical Net Margin Expectation | Implied Tesla Valuation Logic |
|---|---|---|---|
| Automotive Peers | 12-18x | 5-10% | Tesla valued as EV market leader with premium margins |
| AI / Tech Peers | 55-75x | 20-35% | Tesla valued as AI platform with robotics and autonomy optionality |
The gap between those two frameworks is not a rounding error. It is the entire valuation debate in a single table.
Scenario-based valuation is not about predicting the future. It is about making assumptions explicit so an investor can test whether the current stock price already prices in the optimistic case. The following seven-step process provides a structured approach, applicable to Tesla or any company whose identity is contested between business models.
A DCF model excels when a company generates predictable cash flows. For a segment like Tesla’s robotics business, which has no meaningful revenue yet, a revenue or earnings multiple approach applied to projected future financials is more practical. The key is matching the method to the company’s stage, not defaulting to a single model.
Damodaran’s foundational work on DCF valuation under uncertainty establishes that scenario analysis functions as a structured extension of discounted cash flow methodology, converting subjective narrative assumptions about a company’s future into explicit, probability-weighted financial outputs that can be compared against a current market price.
Sensitivity insight: For Tesla specifically, the highest-sensitivity inputs in any model are Optimus production scale and robotaxi commercialisation timing, not core automotive revenue growth. Tesla’s 2026 capex is projected to exceed $32 billion, making free cash flow modelling particularly sensitive to timeline assumptions.
The framework described here, adapted from the Corporate Finance Institute’s valuation methodology, is reusable. An investor who absorbs these steps can apply them to any transition-stage company, whether that is NVIDIA, Snowflake, or Rivian.
One layer the seven-step framework does not automatically capture is execution risk outside scenario models, a separate assessment that asks whether the operational prerequisites exist for any scenario to be achievable, independent of whether the financial math is internally consistent.
The bull case for Tesla is not vague optimism. It is a set of specific financial assumptions, each of which requires specific operational milestones to materialise. Laying those assumptions out in full allows any investor to judge their plausibility independently.
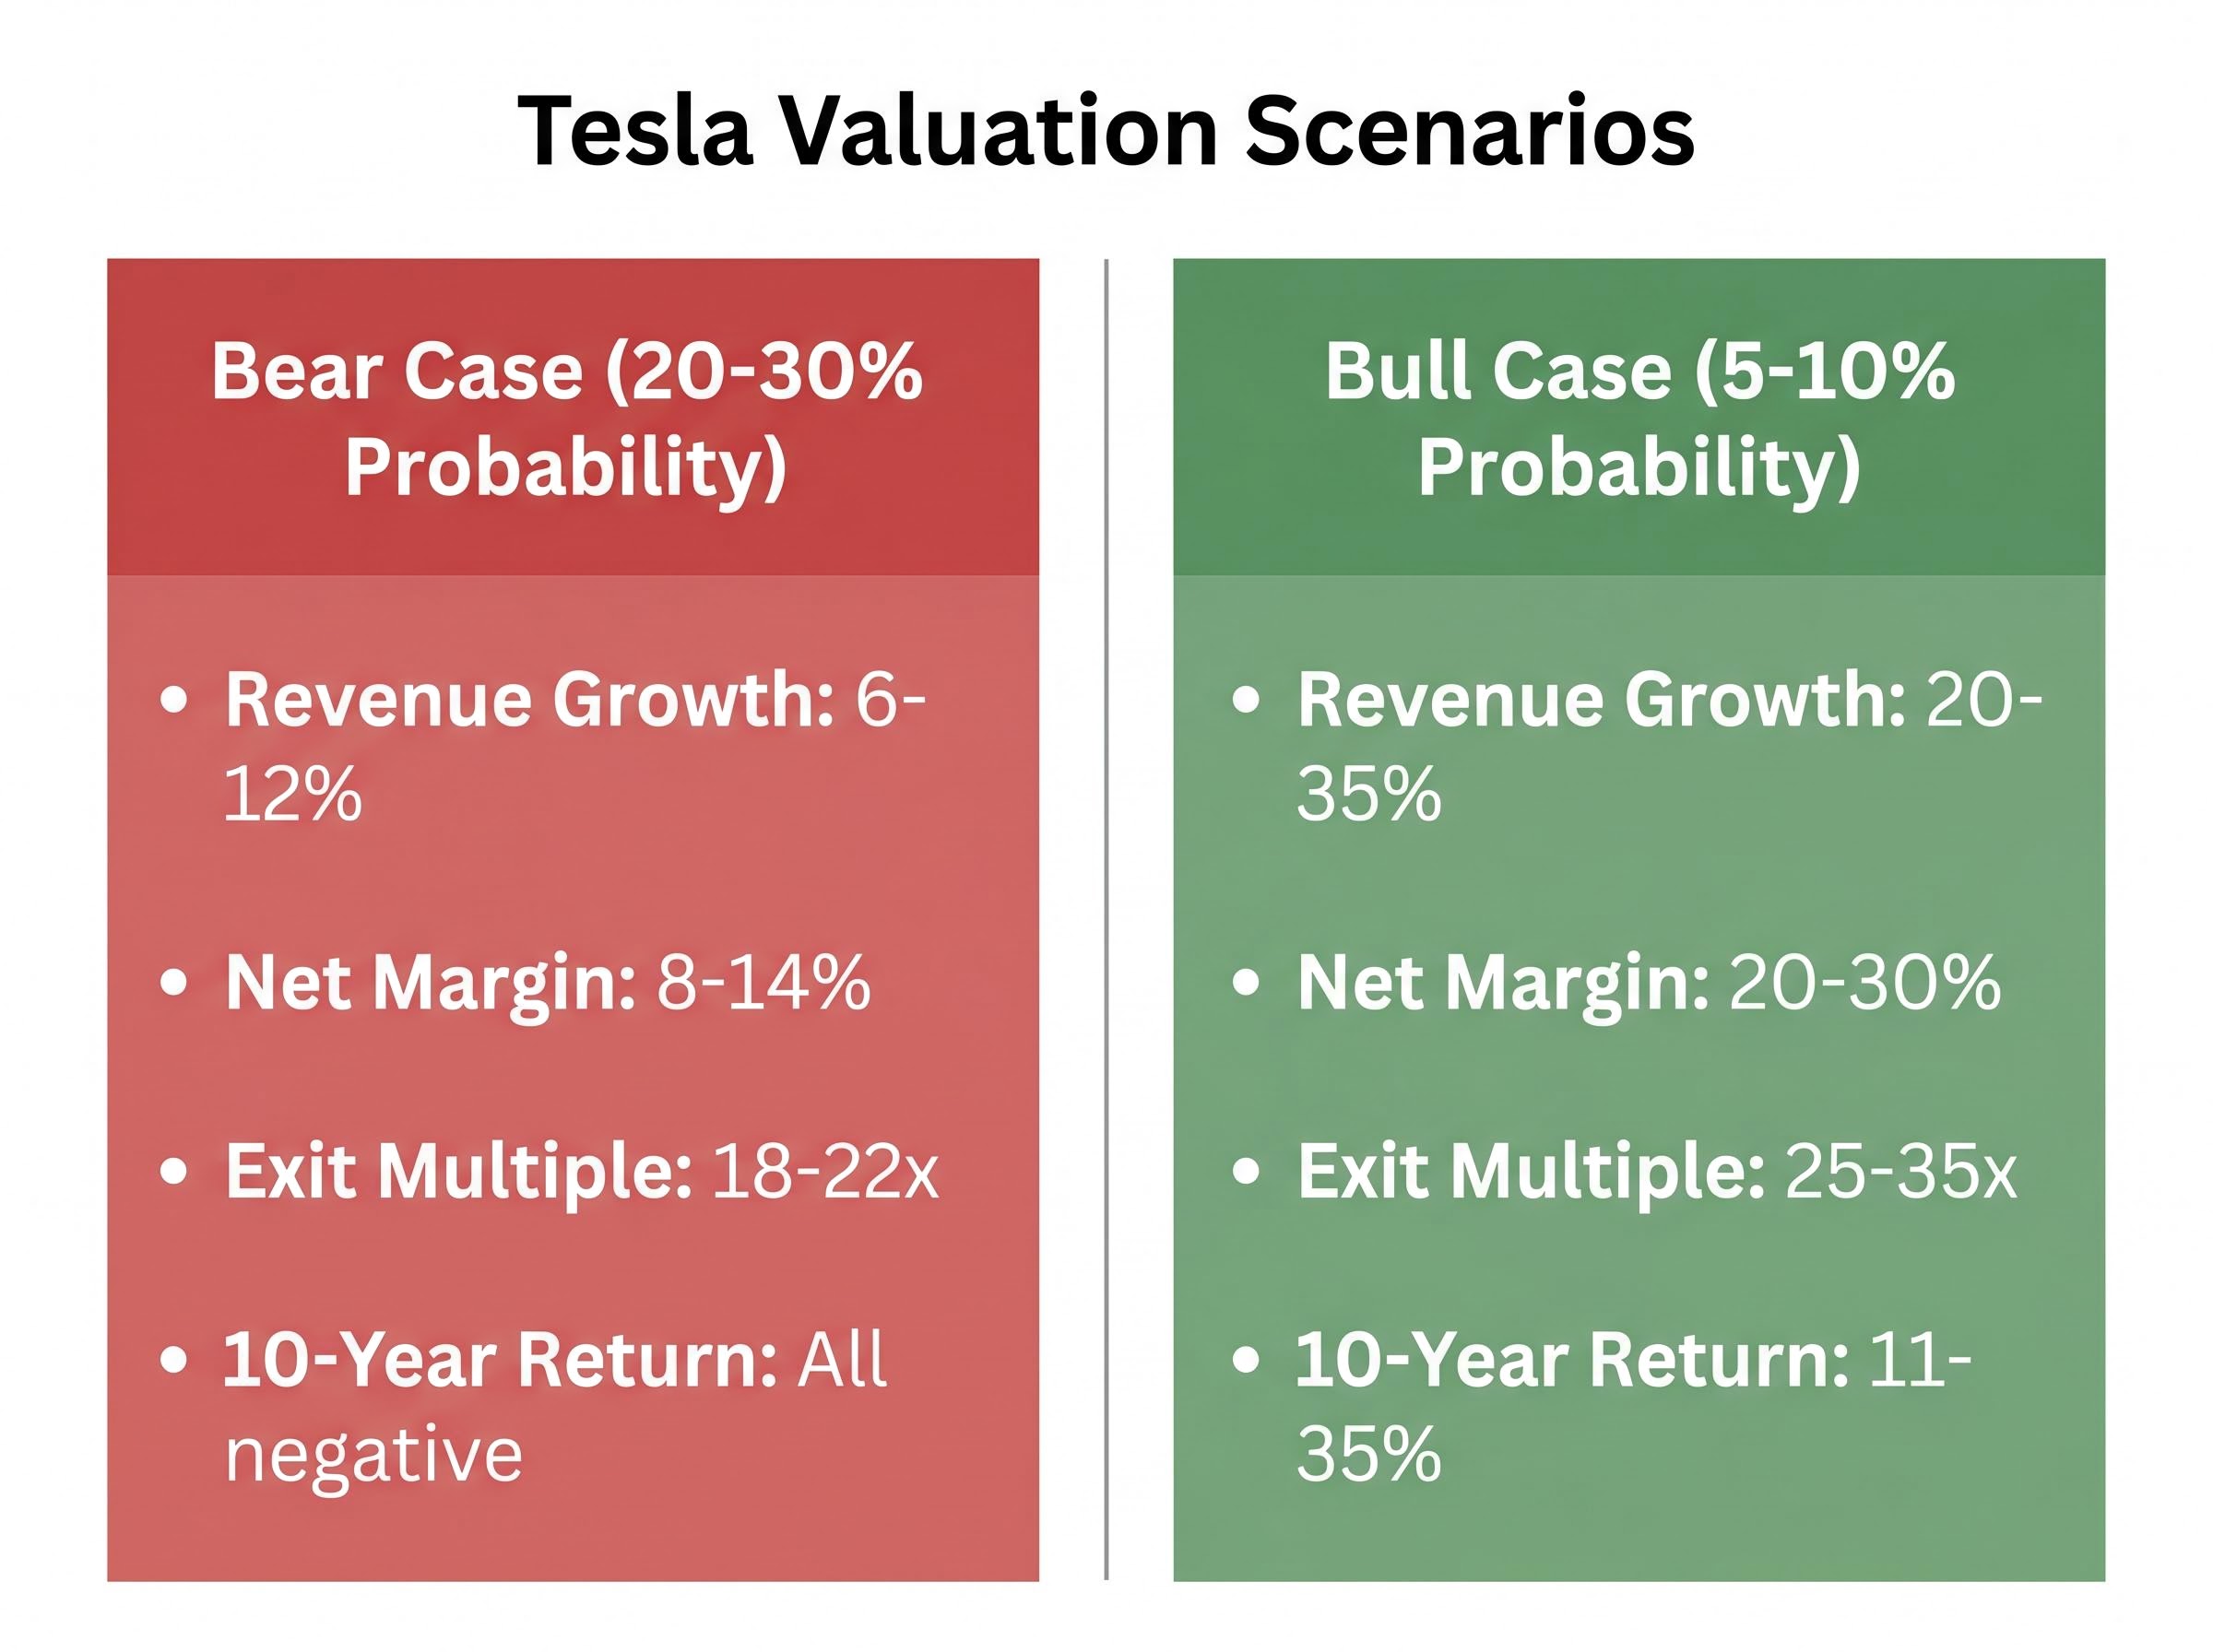
| Assumption Type | Bear Case Range | Bull Case Range |
|---|---|---|
| Revenue Growth Rate (Annual) | 6-12% | 20-35% |
| Net Profit Margin | 8-14% | 20-30% |
| Valuation Multiple at Exit | 18-22x | 25-35x |
| Projected 10-Year Annualised Return | All negative at current price | Approximately 11-35% |
The bull case projects annualised returns of approximately 11-35% over a ten-year horizon. Net profit margins expanding from the current 7-10% range to 20-30% would require Tesla to operate more like a software platform than a manufacturer. Revenue growth at a 27% midpoint demands not only sustained EV market share but entirely new revenue streams at scale.
Morgan Stanley’s overweight-equivalent thesis centres on Optimus scalability as a long-term value driver, with elevated forward multiples justified by AI and robotics optionality. Wedbush, among the most bullish voices, cites robotaxi commercialisation as a near-term catalyst. Tesla’s capex is expected to reach approximately $32 billion in 2026, a tripling that signals the scale of investment behind this thesis.
The bull case is estimated at roughly 5-10% probability of fully materialising, a figure that should inform position sizing even for investors who find the thesis compelling.
Three operational prerequisites must occur for the bull case financial assumptions to be achievable:
Elon Musk’s historical pattern is relevant calibration. Core innovations have been delivered, but on longer timelines than announced: the 2016 full self-driving claim, the 2019 one-million-robotaxi projection, and the 2021 Optimus-by-2022 statement all arrived late or remain in progress. Investors tracking milestone delivery dates against original announcements may find this pattern informative when assessing the probability assigned to each scenario.
Investors who want to go further than a single blended multiple will find our deep-dive into sum-of-the-parts valuation for Tesla, which disaggregates the automotive, energy, robotaxi, and Optimus segments into separate component values and walks through how ARK Invest’s open-source model produces a bear case of $2,900 and a bull case of $5,800 from the same underlying data.
The bear case is not a failure scenario. It is a scenario where Tesla remains a strong electric vehicle company without meaningful AI or robotics revenue contribution. The distinction matters because even this generous non-AI outcome produces troubling math at today’s price.
The bear case financial assumptions are themselves favourable relative to legacy automakers: revenue growth of 6-12% (midpoint 9%), net margins of 8-14%, and valuation multiples of 18-22 times earnings. These would represent an excellent business by any traditional automotive standard.
At approximately $375-$412 per share, every projected return outcome under the bear case model was negative. The current price does not merely include an AI and robotics premium as a bonus. It requires the premium to justify the entry point.
At current prices, the bear case produces no positive return outcome. Every dollar invested in Tesla at today’s price is, in effect, a bet on the AI transition occurring.
Goldman Sachs holds a neutral-equivalent view, noting that the AI and robotics premium embedded in the stock has moderated from its 2025 peak. The firm flagged the post-Q1 earnings sentiment environment as a headwind despite the earnings beat. Forward analyst EPS estimates are projected to grow more than five times from current levels, which already incorporates expected AI and autonomy contributions.
Several competitive headwinds make the bear case plausible:
The bear case is not a prediction. It is a floor test. Knowing that the floor produces negative returns tells an investor precisely how much of their thesis must be correct for the investment to work at today’s price.
The same company at two different prices produces entirely different return profiles. This is not a theoretical point. Tesla’s own price history illustrates it directly: shares traded at approximately $100 a few years prior, peaked near $450, and sat at approximately $407-$412 as of early May 2026.
An investor who entered near the $450 peak may still be sitting on losses even after the Q1 2026 earnings beat. The core business performed well, the results exceeded expectations, and the investment is still underwater. That is the long-term cost of entry price indiscipline.
An elevated multiple is not inherently dangerous if the embedded growth assumption is realistic. The risk emerges when the price leaves zero margin of safety. If execution slips by even one or two years on a key milestone, the multiple compresses, and the investor absorbs a loss that no amount of thesis conviction can offset.
Analyst EPS estimates declined more than 90% from their peak before recovering in forward projections. For investors who bought at peak multiples, those revision cycles translated directly into painful drawdowns, even when the long-term thesis remained intact.
A practical three-step framework for entry price discipline:
Consider an investor who assigns a 5-10% probability to the bull case, a 60-70% probability to the base case, and a 20-30% probability to the bear case. If the bear case produces negative returns at today’s price and the base case produces modest returns, the probability-weighted expected return may not justify a large allocation, even if the bull case is genuinely exciting.
This is not a formula. It is a discipline. Making the implicit explicit forces investors to confront whether their position size reflects their actual conviction level or whether they have sized for the scenario they hope for rather than the scenario they believe is most likely.
Tesla is an unusually vivid teaching case precisely because the gap between its bull and bear scenarios is so wide. That vividness makes the methodology portable. The core lesson applies to any company in transition: the question is not whether the bull case is exciting but whether the current price already assumes the bull case is the base case.
Three comparable examples reinforce the point. Analysts who built explicit bull and bear scenarios for NVIDIA’s AI data centre revenue trajectory in 2024-2025 were better positioned to hold through volatility and assess whether elevated multiples (at times exceeding 100 times forward P/E) were justified by actual results. Snowflake’s valuation debate hinged on remaining performance obligation growth as a leading indicator, with bull and bear cases producing dramatically different implied fair values from the same data. Rivian serves as the cautionary mirror: similar capex intensity and transition narrative, with outcomes significantly worse for investors who sized positions based on bull case assumptions without stress-testing the floor.
The elevated multiples applied to Tesla’s AI and robotics optionality sit within a broader market context where AI financing structures across the sector have migrated into what Minsky would classify as speculative financing, with the S&P 500 Shiller CAPE ratio reaching 40-41 in May 2026 and the top ten index constituents accounting for 40-43% of total market capitalisation.
Tesla’s Q1 2026 beat ($22.4 billion revenue, 21.7% gross margin) is a reminder that the core business is not irrelevant. Base case fundamentals set the floor from which any AI upside would compound.
Before taking a position in any transition-stage company, four questions deserve explicit answers:
The goal of scenario analysis is not to predict the future. It is to clarify what an investor is actually betting on when buying a stock at a given price.
The methodology demonstrated through Tesla applies to every high-multiple, transition-stage company an investor will encounter. It is a durable skill rather than a single-use analysis. The honest uncertainty in the Tesla case itself is instructive: a view that partial execution on autonomous driving and robotics occurs alongside a continued core auto business sits between the two scenarios, which is a probabilistically sensible position rather than a hedge.
The practical next step is concrete. Apply the reverse-engineering exercise to one position currently held or under evaluation. Ask what growth rate the current price implies, assess whether that rate is achievable, and check whether the position size reflects actual conviction.
This article is for informational purposes only and should not be considered financial advice. Investors should conduct their own research and consult with financial professionals before making investment decisions. Past performance does not guarantee future results. Financial projections are subject to market conditions and various risk factors.
Scenario-based stock valuation analysis is a method of making investment assumptions explicit by building bull, base, and bear case models, each with defined financial inputs, so an investor can compare the range of implied intrinsic values against the current market price rather than relying on a single estimate.
To reverse-engineer the implied growth rate, you work backwards from the current stock price using a DCF or earnings multiple framework, solving for the revenue growth and margin assumptions that would justify today's valuation, then compare those assumptions against your bull, base, and bear case scenarios to assess plausibility.
The comparable peer group selected determines the valuation multiple applied, which dramatically changes the implied fair value. For Tesla, applying automotive peers (12-18x forward P/E) produces a very different output than applying AI and technology peers (55-75x forward P/E), meaning the peer group choice effectively encodes the analyst's thesis about what the company will become.
Position size should reflect the probability-weighted expected return across all scenarios, not just the most optimistic outcome. If the bear case produces negative returns at the current price and the bull case carries only a 5-10% probability, the combined expected value may not justify a large allocation even if the bull thesis is genuinely compelling.
Tesla reported Q1 2026 revenue of $22.4 billion (up 16% year-over-year), earnings per share of $0.40 versus the $0.35 analyst consensus, and a gross margin of 21.7% against an expected 17%, beating estimates across all three headline metrics.