
How to Value a Stock Using Tesla’s $2,500 Analyst Spread
13 mins ago

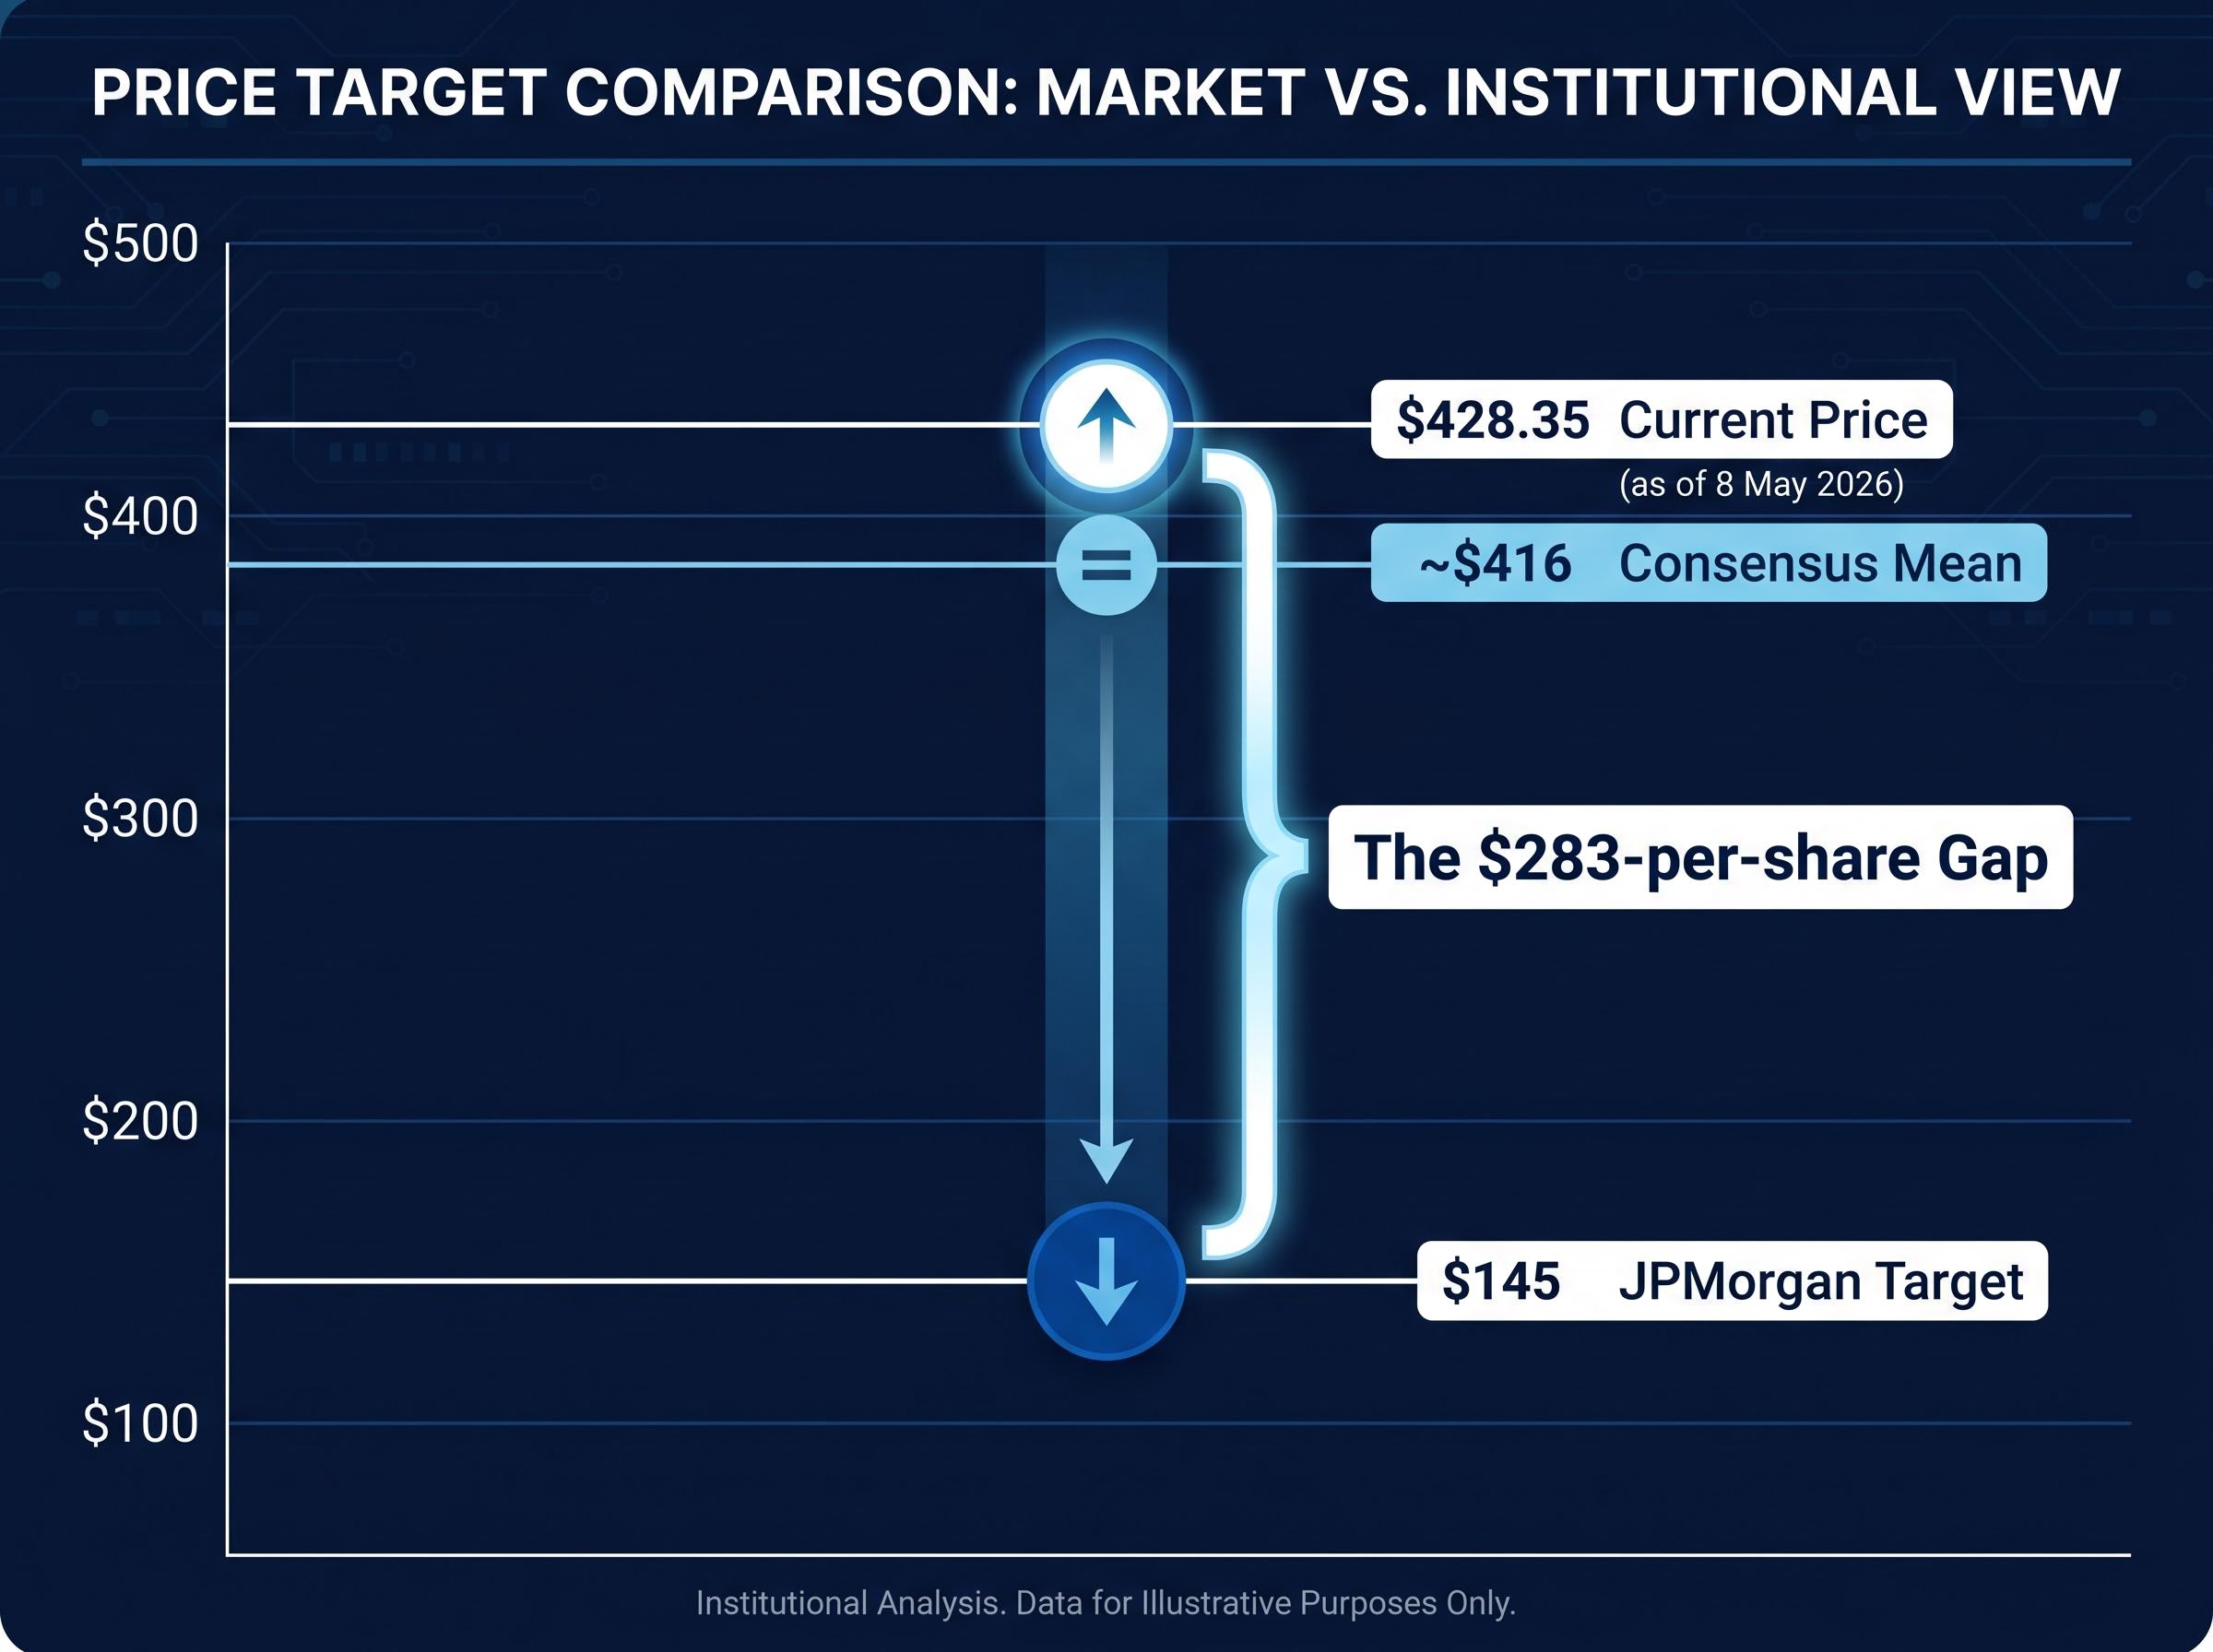
Tesla stock closed at $428.35 on 8 May 2026. JPMorgan has a $145 price target on the same stock. That is not a rounding error. It is a $283-per-share gap between two institutions looking at the same company and arriving at fundamentally different conclusions about what it is worth. When a stock is pricing in a transformation that has not yet happened, standard valuation approaches break down. The question shifts from “what is this company worth today” to “which version of this company will exist in ten years, and what is the probability of each?” That is the analytical problem every investor faces with Tesla right now, and it is the same problem that appears whenever a company is in transition between identities. What follows uses Tesla’s Q1 2026 data as a live case study to teach a replicable framework for building bull and bear case valuations, understanding how assumptions drive radically different outcomes, and identifying why entry price is often the single most consequential variable in stock valuation analysis.
The instinct is familiar: check the price-to-earnings ratio, compare it to the sector average, and form a view. For most companies, that instinct produces a reasonable starting point. For Tesla, it produces a number that confirms whichever bias the investor brought to the screen.
Applying a single valuation ratio in isolation, whether P/E, EV/EBITDA, or price-to-sales, forces a transitional company into a category it does not fully occupy. Tesla generates the majority of its current revenue as an automaker, yet it trades at multiples consistent with a high-growth technology platform. A single-metric approach cannot hold both identities at once.
This is not a Tesla-specific failure mode. Any company mid-pivot between business identities, whether a retailer becoming a logistics platform or a hardware manufacturer becoming a software subscription business, will produce misleading signals from single-ratio analysis.
The two competing analytical lenses break down as follows:
JPMorgan’s $145 target and the consensus mean near $416 are not a case of one side being right and the other wrong. Both are internally consistent views built on different scenario weights. JPMorgan weighs the bear case (weak Q1 deliveries, rising inventory, automotive margin pressure from BYD’s competitive expansion) heavily. Consensus analysts collectively assign higher probability to the technology platform upside materialising within the projection horizon.
The gap is a probability disagreement, not a data disagreement. Recognising that distinction is the first skill required before building any scenario framework.
The probability disagreement between analysts cuts deeper than it first appears: a company can execute its long-term vision successfully and still deliver poor returns to investors who entered at a price that had already captured that future in its multiple, which is precisely the scenario where a $283 gap between price targets represents not a research failure but a legitimate difference in how much execution probability each institution has discounted into the present.
A valuation model is not a calculation that produces an answer. It is a set of explicit bets about the future, structured so those bets can be tested, debated, and updated as new information arrives.
Scenario-based stock valuation addresses this problem directly by replacing a single price target with a range of explicitly modelled outcomes, each carrying its own revenue growth rate, margin assumption, and exit multiple, so the investor can see exactly what the current share price is betting on.
Three core input categories drive any forward valuation over a multi-year horizon. Each must be specified twice: once for the bull scenario and once for the bear scenario.
The following table summarises the assumption structure across a 10-year projection horizon:
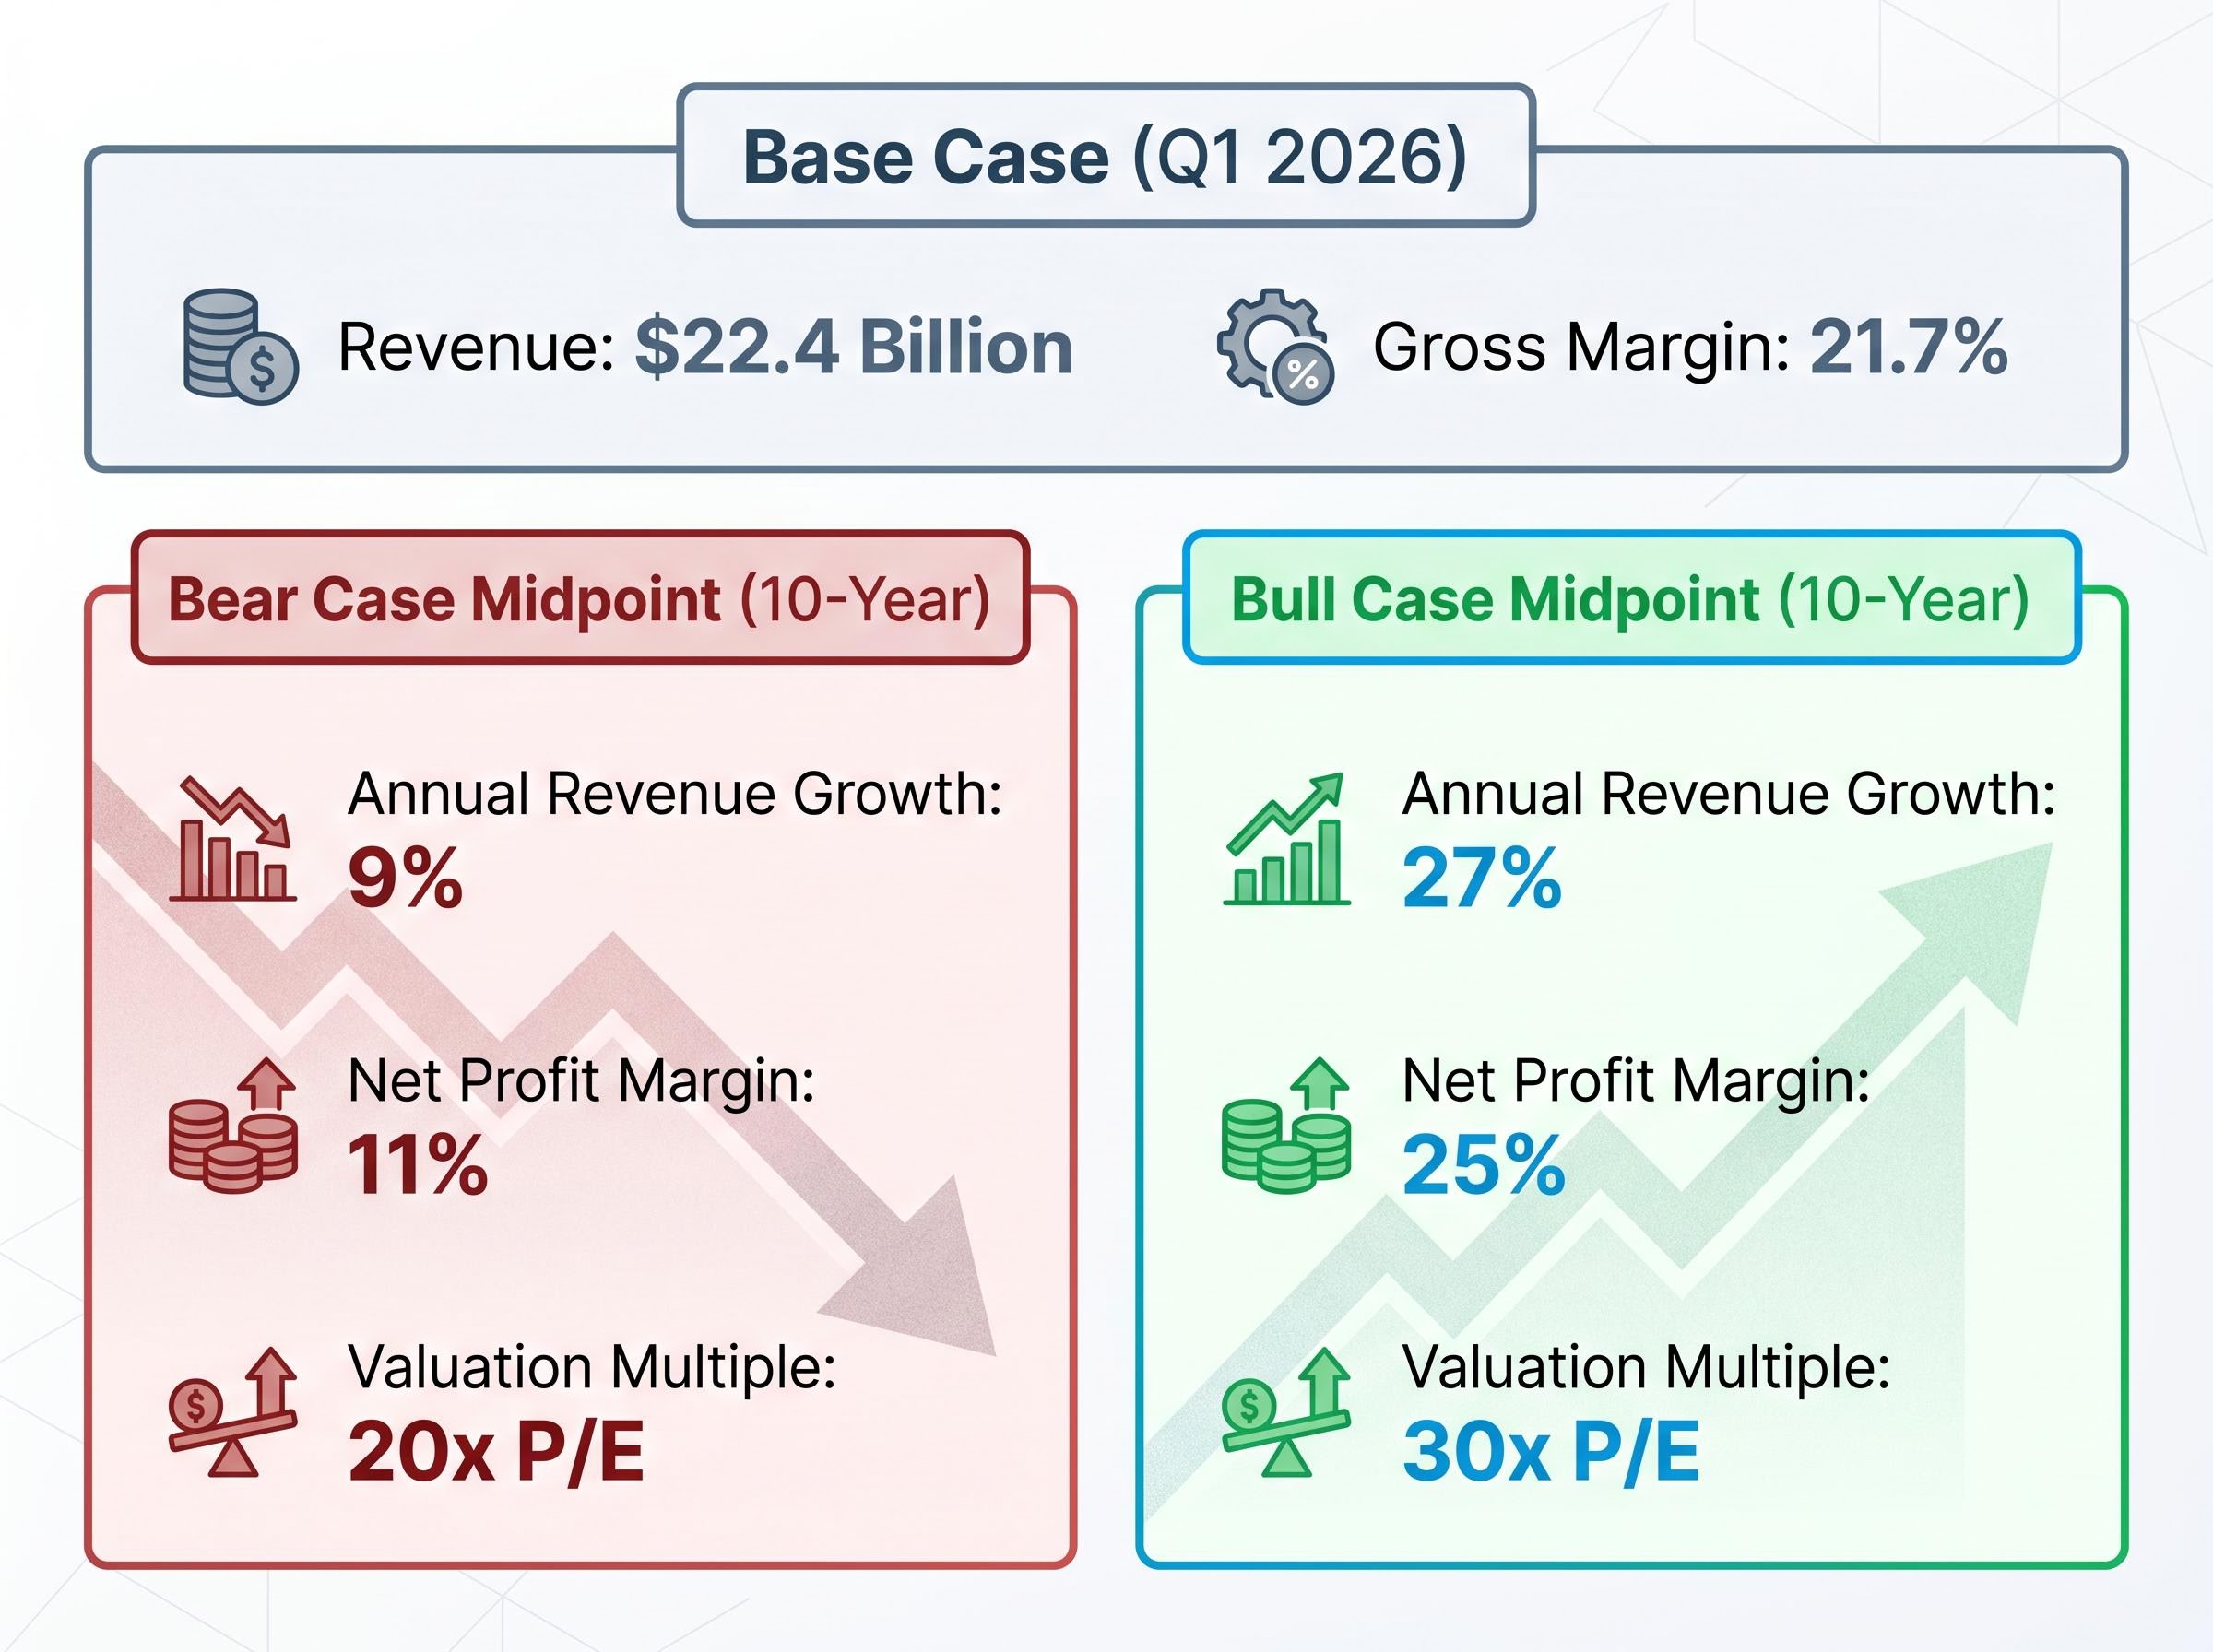
| Input | Bear Low | Bear Midpoint | Bull Midpoint | Bull High |
|---|---|---|---|---|
| Revenue growth (annualised) | 6% | 9% | 27% | 35% |
| Net profit margin | 8% | 11% | 25% | 30% |
| Valuation multiple (P/E) | 18x | 20x | 30x | 35x |
The discipline is not in getting the numbers right. It is in making every assumption explicit so each one can be individually challenged.
A narrow bull-bear gap signals a mature, predictable business. A wide gap, like the one visible in Tesla’s scenario table, signals high execution risk and high optionality simultaneously. Wide scenario gaps do not make a stock uninvestable. They change the investor’s job from valuing a business to weighing probabilities.
Q1 2026 data supports both sides of the argument. The strength of the case study is that the same earnings report fuels two incompatible narratives, and the investor must decide which evidence deserves more weight.
| Bull case evidence | Bear case evidence |
|---|---|
| Q1 free cash flow of $1.4 billion during a heavy investment phase | $25 billion-plus annual CapEx with potential for negative full-year FCF |
| Record Q1 order backlog (strongest in 2+ years); FSD paid customer base approaching 1.3 million | Battery capacity confirmed as the primary volume limiter; Waymo’s $355 million annualised revenue versus Tesla’s early-stage robotaxi commercialisation |
| Robotaxi commercial launches in Dallas and Houston (18 April 2026); Optimus V3 production beginning summer 2026 | Historical pattern of timeline slippage; Morgan Stanley caution on AI/autonomy execution timeline |
The bull indicators are concrete and current. $1.4 billion in quarterly free cash flow is not a projection; it is cash that arrived. The FSD customer base of nearly 1.3 million paid users represents a recurring revenue stream that did not exist at this scale two years ago. The robotaxi launches in Dallas and Houston on 18 April 2026, operating without a safety monitor in the vehicle, moved the programme from prototype to commercial reality.
The bear indicators are equally concrete. Elon Musk’s timeline track record is data, not opinion.
In 2019, Musk projected one million robotaxis on the road by 2020. That fleet did not materialise on anything close to the stated timeline, and the pattern extends further: a 2016 claim that all Tesla vehicles had full self-driving hardware and a 2021 projection on Optimus readiness that preceded years of additional development.
Morgan Stanley has flagged rising costs and slower-than-expected AI and autonomy rollout as reasons for caution, even while acknowledging the long-term potential.
The point is not to choose a side. It is to recognise that scenario construction starts from observable facts, and the same facts support opposing conclusions depending on the probability weight assigned to execution.
Projected return is a function of two variables: the future earnings scenario and the price paid to access it. Most valuation discussions focus exclusively on the first variable. The second, entry price, often determines whether the investment works.
The return calculation follows a straightforward sequence:
Tesla shares were available near $100 in prior years. At that entry point, even the bear case scenario produced a reasonable return because the investor paid a price that did not require the bull case to materialise. The margin of safety was built into the purchase price.
At the current price of $428.35, the mathematics shift dramatically. Forward analyst EPS estimates project more than 5x growth from current levels, incorporating assumptions about autonomy and AI revenue contributions. Those estimates declined more than 90% from peak before recovering in forward projections, a trajectory that illustrates how much the consensus itself has shifted.
Under bear case assumptions at current prices, every projected return outcome was negative.
That is the entry price lesson in its starkest form. Bull case projected annualised returns of approximately 11-35% over ten years remain attractive. But the investor at $428.35 receives no compensation if the bear case materialises. The bull case must happen for the investment to work. That is a fundamentally different risk profile than entering at a price that allows the bear case to deliver a tolerable outcome.
The methodology in the preceding sections rests on three foundational concepts. Each is worth understanding before applying the framework to any transitional company.
A single DCF projection forces false precision on genuinely uncertain variables. Consider the Optimus humanoid robot programme: V3 production is scheduled to begin in summer 2026, with a target of 1 million annual units by summer 2027. No external commercial contracts have been publicly announced. Any single revenue projection for Optimus is, at this stage, an assumption presented as a calculation. The scenario-based approach acknowledges that uncertainty rather than burying it inside a single output number.
Sum-of-the-parts valuation addresses a specific limitation of the single DCF model for hybrid-identity companies: by assigning separate discount rates and growth assumptions to the mature automotive segment, the autonomous driving option, and the Optimus robotics programme, it makes the speculative premium visible as a discrete line item rather than burying it inside an aggregate growth rate.
Damodaran’s scenario analysis framework treats each input assumption as a distinct probability bet rather than a fixed number, a discipline that forces investors to separate genuine uncertainty from the false precision that single-point DCF models tend to project.
The honest investor’s approach is to assign rough probability weights to each scenario, for example 10% bull, 60% base, 30% bear, and calculate a probability-weighted expected return rather than arguing that one scenario is “the answer.”
This approach forces the investor to be explicit about conviction level. An investor who assigns 40% probability to the bull case is making a materially different bet than one who assigns 10%, and both should know that about themselves before committing capital. Defaulting to optimism without quantifying it is not a strategy; it is a bias wearing the clothes of analysis.
The Tesla case is specific. The methodology is not. Every transitional company, whether a retailer pivoting to a subscription model, a pharmaceutical firm building an AI drug-discovery platform, or a financial services company expanding into digital assets, presents the same structural challenge: current earnings understate (or overstate) future potential, and a single-point valuation cannot capture the range of plausible outcomes.
Four lessons transfer directly from this case study:
Identifying the primary thesis signal, the single variable whose movement carries the most weight in shifting the bull case probability, matters more for ongoing position management than tracking quarterly EPS against consensus; for Tesla in 2026, that variable is California autonomous vehicle permitting and Cybercab commercialisation progress, not whether gross margin lands at 21% or 22% in any given quarter.
The most likely outcome for Tesla specifically, according to several analyst views, is partial execution: meaningful progress in autonomous driving, some Optimus revenue contribution, and a continuing automotive business. That middle path produces returns that fall between the bull and bear extremes, and forward EPS projections (more than 5x current levels) already reflect substantial execution assumptions baked into consensus. Full bull case materialisation, where all programmes deliver on schedule and at scale, carries a probability estimated at roughly 5-10%.
The investor who understands that probability, and prices it into their entry decision, is using the framework correctly.
No valuation model produces certainty. An explicit scenario framework produces something more useful: honest uncertainty. The investor who builds bull and bear cases, assigns probability weights, and checks the return profile at their actual entry price has done the analytical work that a single confident price target cannot replicate.
The $283-per-share gap between JPMorgan and the consensus is not a disagreement about Tesla’s past. It is a disagreement about which future has already been paid for.
Investors evaluating any stock in transition can apply the same three-input structure used here: revenue growth rate, net profit margin, and valuation multiple. Build the bull case. Build the bear case. Check which scenario the current price requires to deliver a positive return. That final step is where most valuation exercises fail, and where this framework earns its value.
This article is for informational purposes only and should not be considered financial advice. Investors should conduct their own research and consult with financial professionals before making investment decisions. Past performance does not guarantee future results. Financial projections are subject to market conditions and various risk factors.
Related guides on DCF methodology, margin of safety principles, and evaluating emerging technology companies offer further depth on each of the concepts applied in this case study.
Scenario-based stock valuation analysis replaces a single price target with a range of explicitly modelled outcomes, each carrying its own revenue growth rate, margin assumption, and exit multiple, so investors can see exactly what the current share price is betting on.
Widely divergent price targets, like JPMorgan's $145 versus the consensus mean near $416 for Tesla, typically reflect a probability disagreement rather than a data disagreement; each institution assigns different weights to bull and bear scenarios materialising within their projection horizon.
Entry price determines whether an investor needs the bull case to materialise for a positive return or can tolerate the bear case and still earn a reasonable outcome; at Tesla's price of $428.35, bear case assumptions produced negative projected returns, meaning the bull case must occur for the investment to work.
The three core inputs are revenue growth rate, net profit margin, and valuation multiple (such as P/E); each must be specified separately for the bull and bear scenario to create a structured range of plausible outcomes.
When management has a documented history of timeline slippage, that pattern should be incorporated into the model as a probability adjustment on execution assumptions, rather than being dismissed as irrelevant to current projections.


