
Tesla at 90x Earnings: a Framework for Valuing Transitioning Stocks
16 mins ago

Tesla’s forward price-to-earnings ratio sits at 188.68 as of 8 May 2026. In one version of the future, that number reflects a reasonable entry point into a company about to monetise autonomous fleets, humanoid robots, and artificial intelligence infrastructure. In another, it implies paying nearly 190 times future earnings for a car manufacturer that posted $0.5 billion in net income last quarter. The gap between those two readings is not a matter of opinion; it is a matter of which assumptions an investor chooses to weight, and what price they pay while making that choice.
Tesla beat Q1 2026 earnings expectations, reporting $0.41 non-GAAP EPS against a consensus of $0.35-$0.36 and growing revenue 16% year-over-year to $22.4 billion. The stock fell 3.56% the following day. That paradox, beating estimates and losing value, reveals a company whose share price is not driven by current results but by a specific vision of the future that current results can only partially validate.
What follows is a framework for stock valuation analysis that uses Tesla’s real numbers to teach a universally applicable skill: how to build bull, base, and bear case scenarios, how to stress-test valuation multiples against different futures, and why the price paid at entry is often the single most consequential variable in any investment outcome.
The instinct to look at a share price and decide whether it feels “high” or “low” is one of the most common mistakes in equity analysis. A price is not a verdict. It is an implied bet on a specific sequence of future events, and Tesla’s current numbers make that relationship unusually visible.
At approximately $398.73 per share, Tesla carries a market capitalisation of roughly $1.47 trillion. That figure is not a valuation of a car company. It is a valuation of a company that investors believe will successfully commercialise at least some combination of:
The valuation multiples confirm this reading. A forward P/E of 188.68 and an EV/EBITDA of 143.78 mean the current price embeds earnings that do not yet exist. Tesla reported GAAP net income of $0.5 billion in Q1 2026. Against a $1.47 trillion market cap, that quarterly earnings rate implies it would take thousands of years for the company to “earn back” its valuation from current profits alone.
The breakdown of standard multiples is not unique to Tesla; transition-stage stock valuation as a discipline recognises that any company mid-transformation, where the majority of projected value comes from business lines not yet visible in the income statement, requires scenario-based frameworks rather than ratio comparisons against mature peers.
Consensus price target: $398-$403. Wall Street’s median target sits almost exactly at the current trading price, indicating the market has fully absorbed available information. The next meaningful move depends entirely on execution against speculative milestones, not against consensus EPS.
The foundational skill for the rest of this framework begins here: a stock price embeds a specific future scenario, not just current performance. Every section that follows builds on that principle.
A valuation scenario is not a guess about whether a company will do well or poorly. It is a structured exercise that defines which specific assumptions must hold true for a given stock price to be justified. Three inputs work in combination to produce an implied value: a revenue growth rate assumption, a net profit margin assumption, and a valuation multiple (a ratio such as price-to-earnings that the market assigns based on growth expectations). Changing any one of these produces dramatically different outcomes.
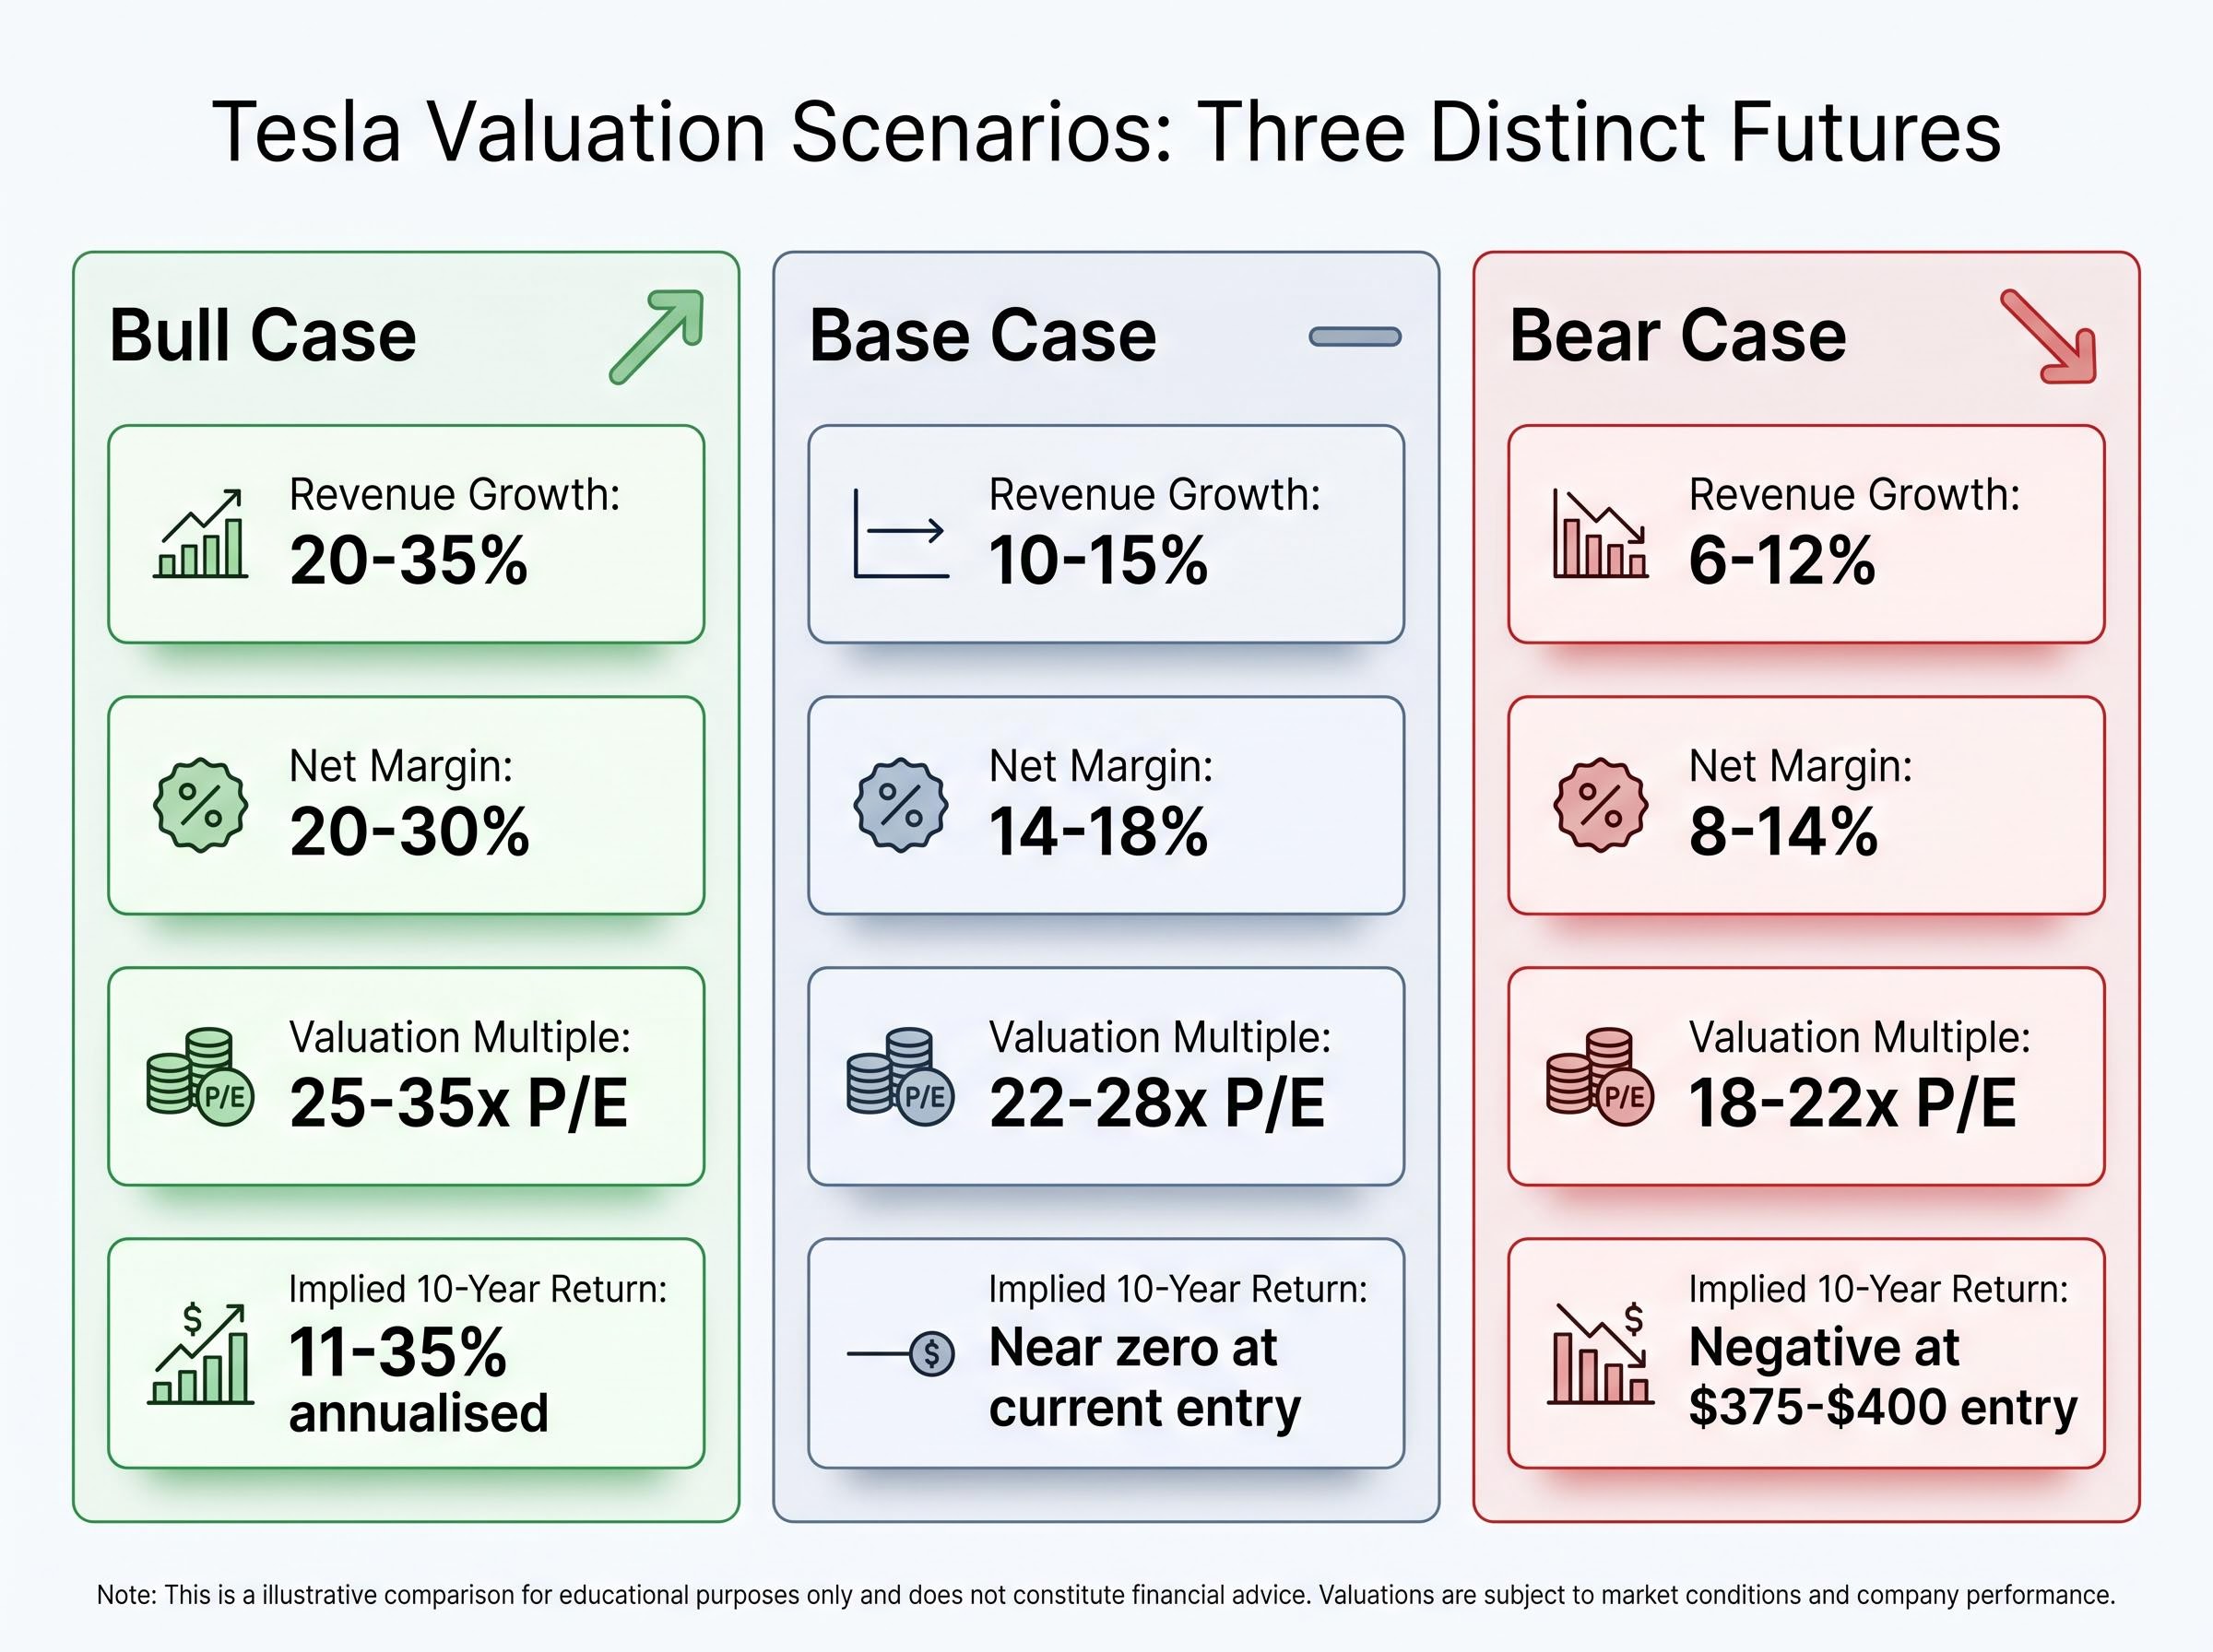
| Scenario | Revenue Growth | Net Margin | Valuation Multiple (P/E) | Implied 10-Year Return |
|---|---|---|---|---|
| Bull Case | 20-35% | 20-30% | 25-35x | Approximately 11-35% annualised |
| Base Case | 10-15% | 14-18% | 22-28x | Near zero at current entry |
| Bear Case | 6-12% | 8-14% | 18-22x | Negative at $375-$400 entry |
The bull case inputs require a specific business reality. Net margins of 20-30% are not automotive economics; they are software economics. For those margins to materialise, FSD subscription revenue and Optimus licensing would need to constitute a significant share of total revenue, generating income with minimal marginal cost per unit sold.
The base case assumes a maturing auto business with gradual energy recovery and limited near-term contribution from autonomous vehicles. It is a world where Tesla remains a strong company but does not undergo the platform transformation its valuation implies.
Probabilistic weighting of scenarios forces a discipline that single-point forecasting avoids: rather than anchoring on the most compelling case, an investor must assign an explicit likelihood to each outcome and compare the blended expected value against the current market price, a step that frequently reveals the bull case is priced in even before it is labelled as such.
The bear case deserves particular attention because it is frequently misunderstood. Revenue growth of 6-12% is above the long-run GDP average for the United States. It exceeds what Ford or General Motors would typically be expected to achieve. Bear case net margins of 8-14% would represent a profitable, well-run industrial company by any conventional standard.
The bear case is not a prediction that Tesla fails. It is a recognition that at a $375-$400 entry price, all projected return outcomes turn negative unless the bull scenario materialises. The current price leaves no room for anything short of exceptional execution.
Tesla’s Q1 2026 earnings report functions as a live case study in reading financial data as scenario evidence rather than as standalone numbers. Each metric simultaneously supports and challenges the bull thesis.
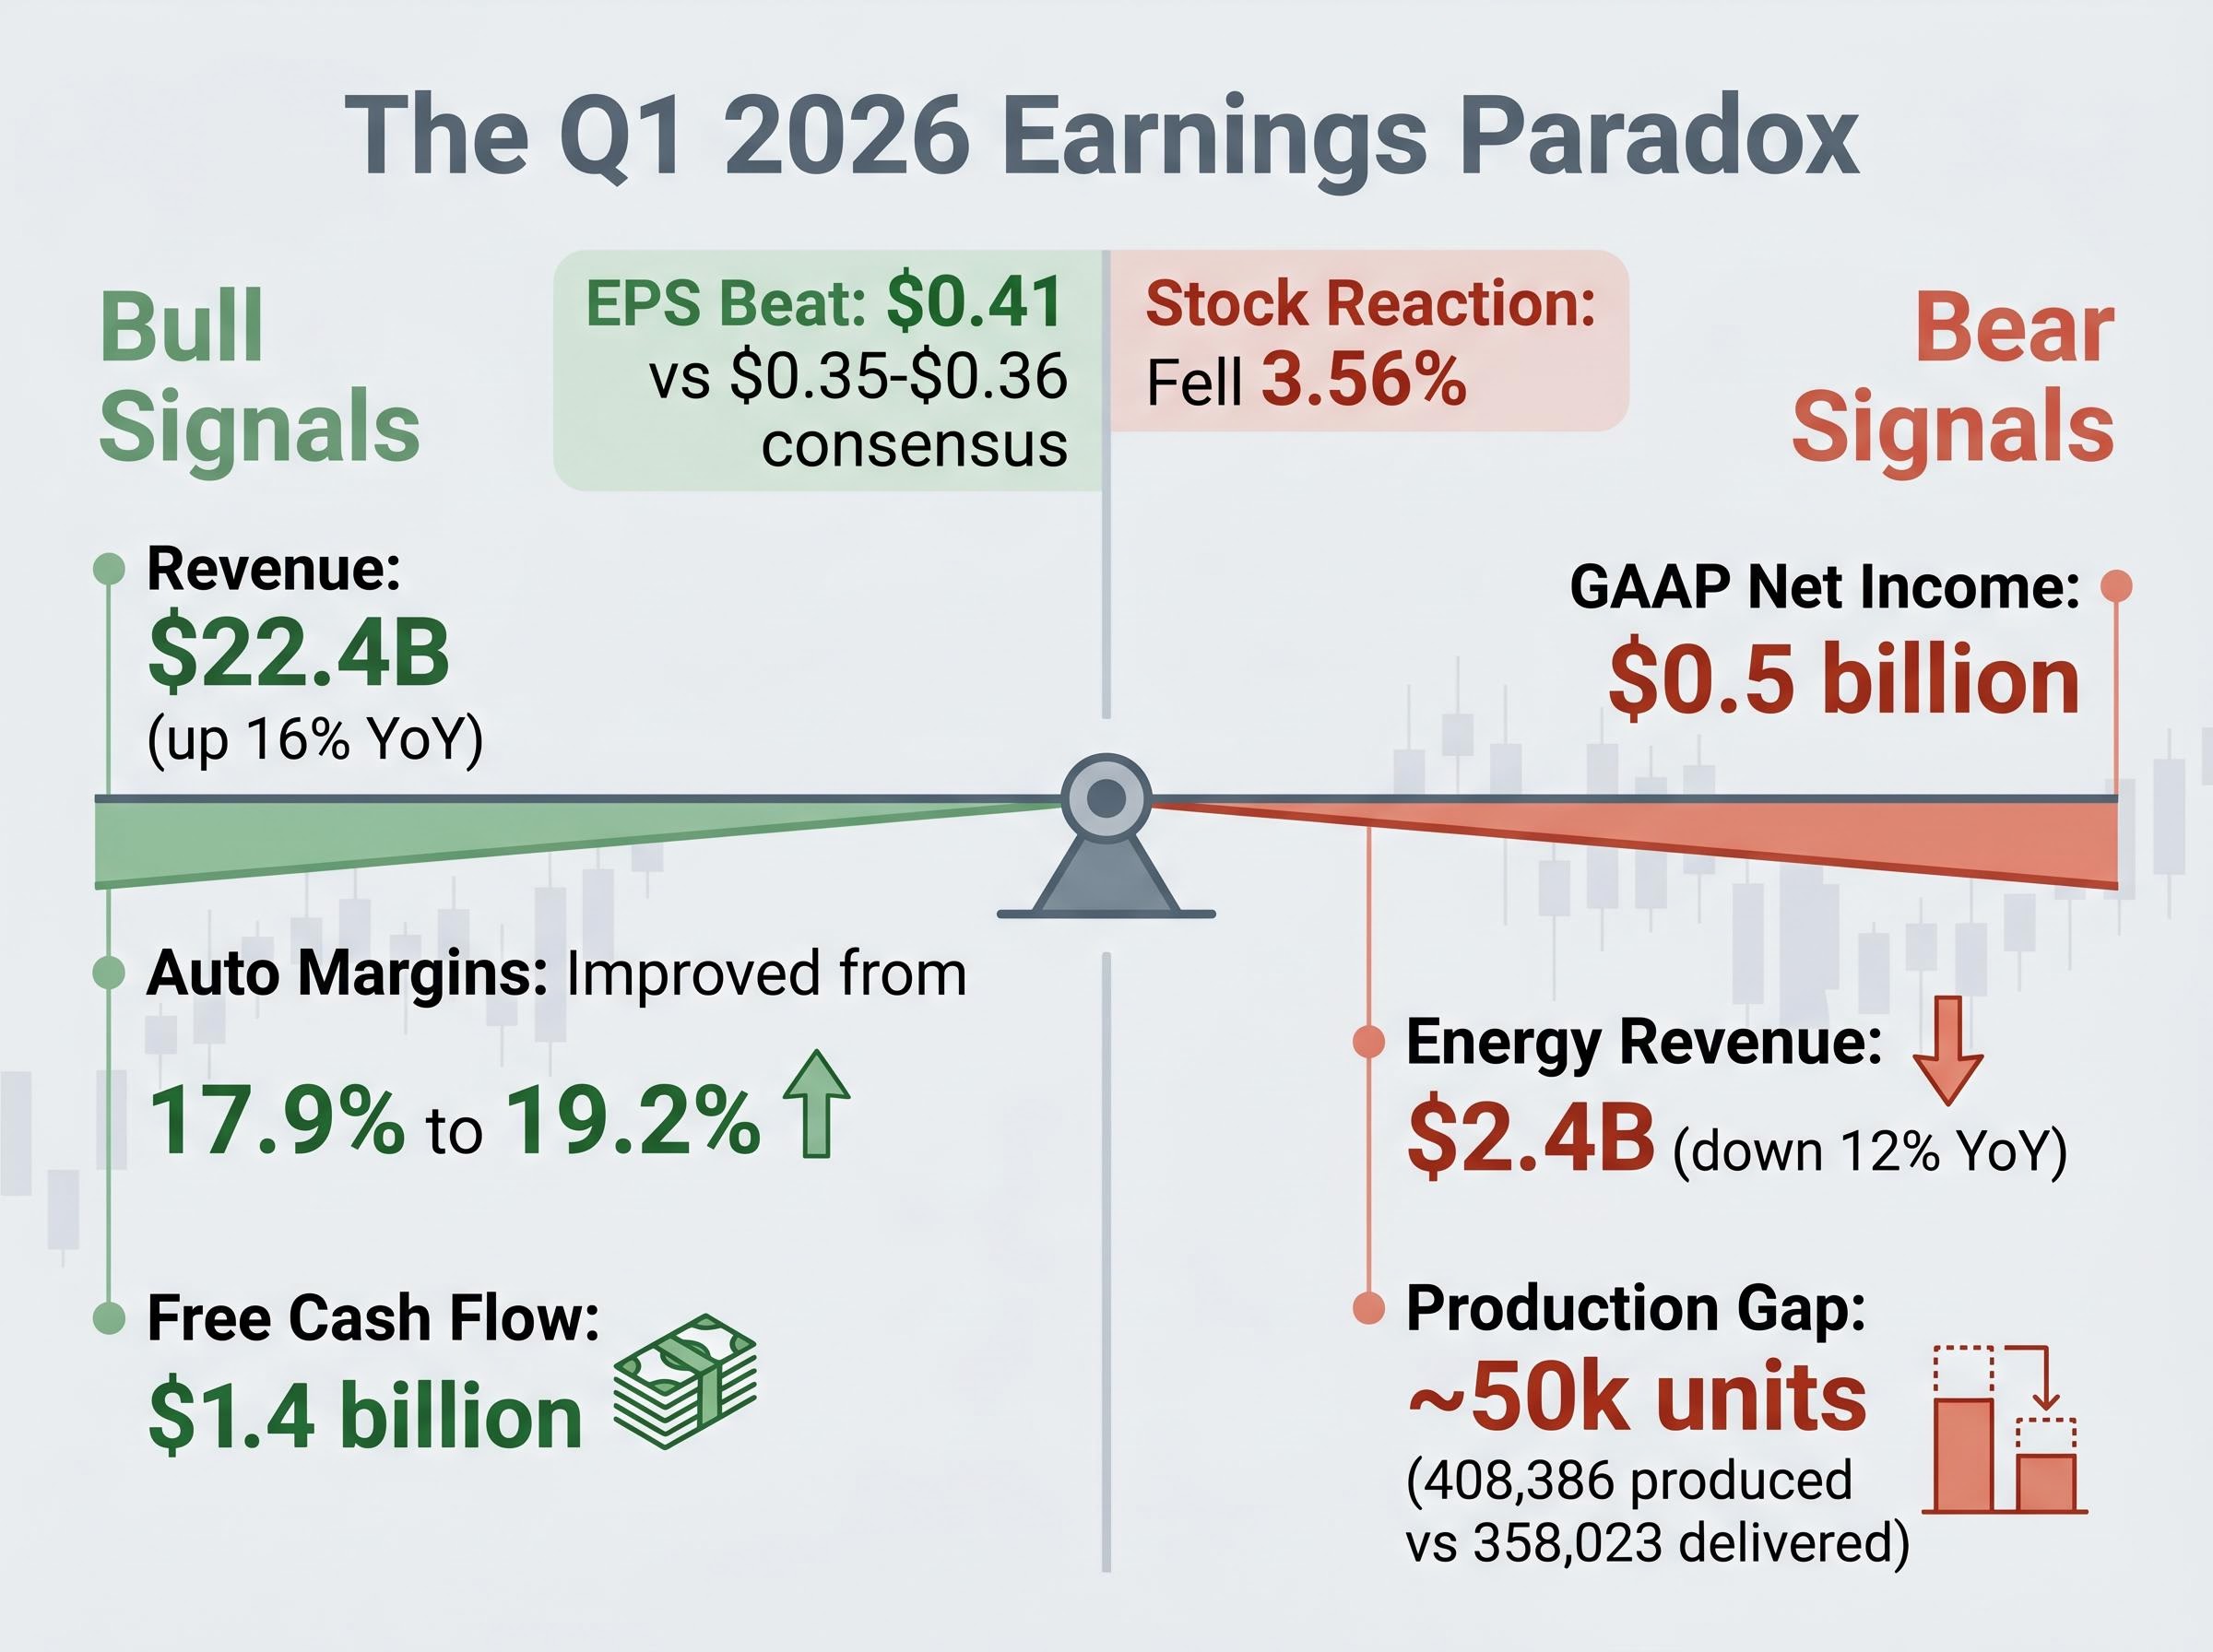
The structural tension sits in the $25 billion-plus capital expenditure commitment for 2026. Tesla is simultaneously producing modest GAAP profits and committing to investment levels that dwarf current earnings, a bet that future returns from AI training infrastructure, battery manufacturing, and autonomous vehicle deployment will justify the outlay. Cash on hand of $44.7 billion provides the runway; whether the destination justifies the spend remains the open question.
Post-earnings stock decline: Tesla beat Q1 2026 EPS estimates and fell 3.56% the next day. The market is not evaluating Tesla against consensus EPS. It is evaluating execution against a speculative roadmap, and Q1 data did not move the needle on the milestones that matter most to the current valuation.
The same company purchased at two different prices is two fundamentally different investments. Tesla’s own history illustrates this with unusual clarity.
Consider three entry points and what each requires:
The margin of safety concept, buying at a price low enough that conservative assumptions still produce acceptable returns, is the single most powerful risk management tool available to any investor. At $398.73, that margin has largely evaporated for Tesla unless the speculative milestones deliver.
The CFA Institute equity valuation framework formalises the relationship between intrinsic value and market price, establishing that a stock trading above its intrinsic value under conservative assumptions offers no margin of safety regardless of the quality of the underlying business.
The gap between analyst price targets is itself a measurement of risk. Wedbush’s Dan Ives holds a $600 target, implying approximately 50% upside. Ark Invest’s Cathie Wood maintains a $2,600 target, implying roughly 550% upside but requiring near-total execution across every speculative business line. JP Morgan has flagged approximately 60% downside risk.
When credible analysts are $2,000 apart on the same stock, that dispersion is not noise. It is a signal that small changes in assumptions produce enormous valuation swings. Forward EPS growth projections from the analyst consensus imply earnings growing more than 5x from current levels, a figure already embedded in the forward P/E of 188.68. Whether that growth materialises is the question the market cannot agree on, and the range of disagreement quantifies the uncertainty an investor is accepting at any given entry price.
Analyst target dispersion functions as a quantitative proxy for the width of the scenario distribution: when credible analysts are hundreds of dollars apart on the same stock, the gap is not a failure of analysis but a direct measure of the variance in assumptions about which business a company will ultimately become.
A valuation model built in isolation is a mathematical exercise. A valuation model stress-tested against competitive reality becomes a probability assessment, and the competitive field facing Tesla is better funded and further along than many bull case models acknowledge.
| Company | Funding / Valuation | Current Operational Scale | Key 2026 Milestone |
|---|---|---|---|
| Waymo (Alphabet) | $16 billion raised | ~3,000 robotaxis across 10 cities | Continued geographic and ridership expansion |
| Figure AI | $1.8 billion total funding | BotQ factory ramping to 1 robot per hour | Commercial deployment scaling |
| Boston Dynamics | ~$22 billion valuation | ~$110 million revenue (2024, Spot deployments) | Atlas humanoid production commencing |
Waymo represents the most operationally mature autonomous vehicle competitor. With $16 billion in funding, a fleet of approximately 3,000 robotaxis, and active operations across 10 cities, it has achieved a deployment scale that Tesla’s Cybercab programme has not yet matched. Tesla has self-certified the Cybercab to bypass production caps, but as of 8 May 2026, has not filed the permits necessary to operate a commercial AV service in California, the benchmark jurisdiction for autonomous deployment.
In humanoid robotics, Figure AI has raised $1.8 billion and is ramping its BotQ factory to produce one robot per hour. Boston Dynamics, valued at approximately $22 billion following the Hyundai acquisition, has confirmed Atlas production commencing in 2026. These are not hypothetical competitors; they are companies with capital, production infrastructure, and commercialisation timelines that overlap directly with Tesla’s Optimus roadmap.
A calibration input, not a criticism: Elon Musk’s public timeline projections have historically arrived later than announced: the 2016 claim that all Tesla vehicles had full self-driving hardware, the 2019 prediction of one million robotaxis by 2020, and the 2021 statement that Optimus would be deployment-ready in 2022. A rigorous scenario model incorporates this pattern into the probability weight assigned to management guidance on future milestones.
California’s Department of Motor Vehicles adopted new rules on 29 April 2026 allowing traffic citations for autonomous vehicles from 1 July 2026, a signal that the regulatory framework is actively evolving. The bull case requires Tesla to navigate this framework as effectively as Waymo already has.
The framework taught throughout this guide collapses into a single practical sequence. Every investor evaluating a high-multiple growth stock faces the same four steps:
The core teaching insight: With consensus price targets sitting at the current trading price, the market has already absorbed the base case. An investor buying Tesla at $398.73 is not making a bet on a good company. They are making a bet on which direction the speculative premium moves next, and the range between JP Morgan’s approximately 60% downside flag and Ark Invest’s $2,600 target measures the width of that bet.
Tesla is the case study. The methodology is the product. Build three scenarios with explicit assumptions. Stress-test those assumptions against funded competitors already in the field. Anchor every return projection to the specific price paid. Define a personal threshold for acceptable risk-reward rather than outsourcing that judgment to an analyst target. This framework applies to any company whose stock price is pricing in a transformation that has not yet occurred.
Investors ready to apply this framework to their own positions will find our deep-dive into growth stock scenario analysis covers the specific Q2 2026 catalysts to monitor, the competitive deployment asymmetry between Tesla and Waymo in detail, and a worked example of how auto gross margin above or below 18% at the July earnings call shifts scenario probability weights.
This article is for informational purposes only and should not be considered financial advice. Investors should conduct their own research and consult with financial professionals before making investment decisions. Past performance does not guarantee future results. Financial projections are subject to market conditions and various risk factors.
Stock valuation scenario analysis is a structured method of defining which specific assumptions about revenue growth, profit margins, and valuation multiples must hold true for a given stock price to be justified. Instead of relying on a single forecast, investors build bull, base, and bear cases and assign probabilities to each outcome to compare blended expected value against the current market price.
A forward P/E of 188.68 means investors are paying nearly 190 times Tesla's expected future earnings, which implies the current price has already embedded earnings from business lines, such as autonomous robotaxi fleets and Optimus humanoid robots, that do not yet appear in the income statement.
Tesla reported $0.41 non-GAAP EPS against a consensus of $0.35-$0.36 and grew revenue 16% year-over-year, yet the stock fell 3.56% the following day because the market is not evaluating Tesla against consensus EPS but against execution on speculative milestones like FSD commercialisation and Cybercab deployment that Q1 data did not materially advance.
A margin of safety is the gap between the price paid for a stock and the estimated fair value under conservative assumptions; it means an investor can be meaningfully wrong about the future and still earn an acceptable return. At Tesla's current price of approximately $398.73, the base case produces near-zero expected return, indicating the margin of safety has largely evaporated unless speculative milestones deliver.
Wide analyst price target dispersion is a direct quantitative signal of scenario uncertainty rather than noise; for Tesla, the gap between JP Morgan's roughly 60% downside flag and Ark Invest's $2,600 target reflects how small changes in assumptions about autonomous vehicles and humanoid robotics produce enormous valuation swings, and investors should treat that dispersion as a measure of the risk they are accepting at any entry price.


