You picked the right company. The thesis was sound, the earnings were growing, the balance sheet was clean. You bought the stock, and then watched it fall 20% over the next three months while nothing about the business changed. By the time the price recovered, you had either sold at a loss or held through enough pain to swear off the position entirely. The return you deserved on paper never made it into your brokerage account.
This is not a personal failure. It is a structural gap in the way most retail investors are taught to think about stock selection. A fundamentally strong ASX stock can drop 20-30% over months purely on the back of sentiment, liquidity shifts, and institutional positioning, with zero change to intrinsic value. ASIC data confirm the pattern: many retail investors systematically buy just before prices fall and sell just before recoveries begin, leading to significant aggregate losses. The problem is not what you are buying. It is that you have no framework for when.
Here is a practical process you can apply to any stock on your ASX watchlist this week. It covers how to read a chart before you commit capital, what volume tells you that price alone cannot, how to structure entries and exits with pre-defined risk, and the five specific mistakes that cost Australian retail investors the most money. You will not need to abandon your fundamental research. You will need to add a timing layer to it.
What fundamentals can tell you and what they cannot
Fundamental analysis does exactly what it is designed to do. It answers whether a business is worth owning, at roughly what valuation, and over what time horizon. If you are screening for solid earnings, manageable debt, and durable competitive advantages, you are doing the right work. Empirical evidence consistently shows that fundamental strategies outperform over longer horizons, and nothing in this guide asks you to stop doing that research.
Your assessment of intrinsic value relies heavily on essential fundamental analysis metrics like earnings per share and profit margins, which ensure your initial screening targets companies that actually deserve your capital.
The limitation is precise. Fundamentals are not built to tell you whether today is a good day to buy or sell. A company trading at a discount to your assessed fair value can still fall another 30% before the market agrees with you, and if your circumstances change during that drawdown, whether a retirement date arrives, a property purchase proceeds, or an unexpected bill lands, you may be forced to sell a position that was analytically correct at precisely the wrong moment.
ASIC has observed that many retail investors act on valuation alone, buying stocks that “look cheap” and selling stocks that have already recovered, a pattern that produces large cumulative losses across the retail investor population. The cost of being right about the business but wrong about the timing is real, and you have probably already paid it at least once.
Two separate questions require two separate tools:
- What fundamentals answer: Is this business worth owning at all? At what valuation? Over what horizon?
- What fundamentals do not answer: Is the price likely to move in your favour from here? Is supply or demand dominant right now? Where should you place your stop?
Fundamentals tell you what to own. Technicals tell you when to own it. You need both.
When big ASX news breaks, our subscribers know first
Reading a chart before you risk a dollar: the three structures that matter
Every ASX stock, at any given moment, is doing one of three things. Once you can identify which one, you have a filter that immediately sorts your watchlist into “not yet,” “watching closely,” and “ready to evaluate for entry.” That filter is the foundation everything else in this framework builds on.
Uptrend and downtrend: knowing which side of the market you are on
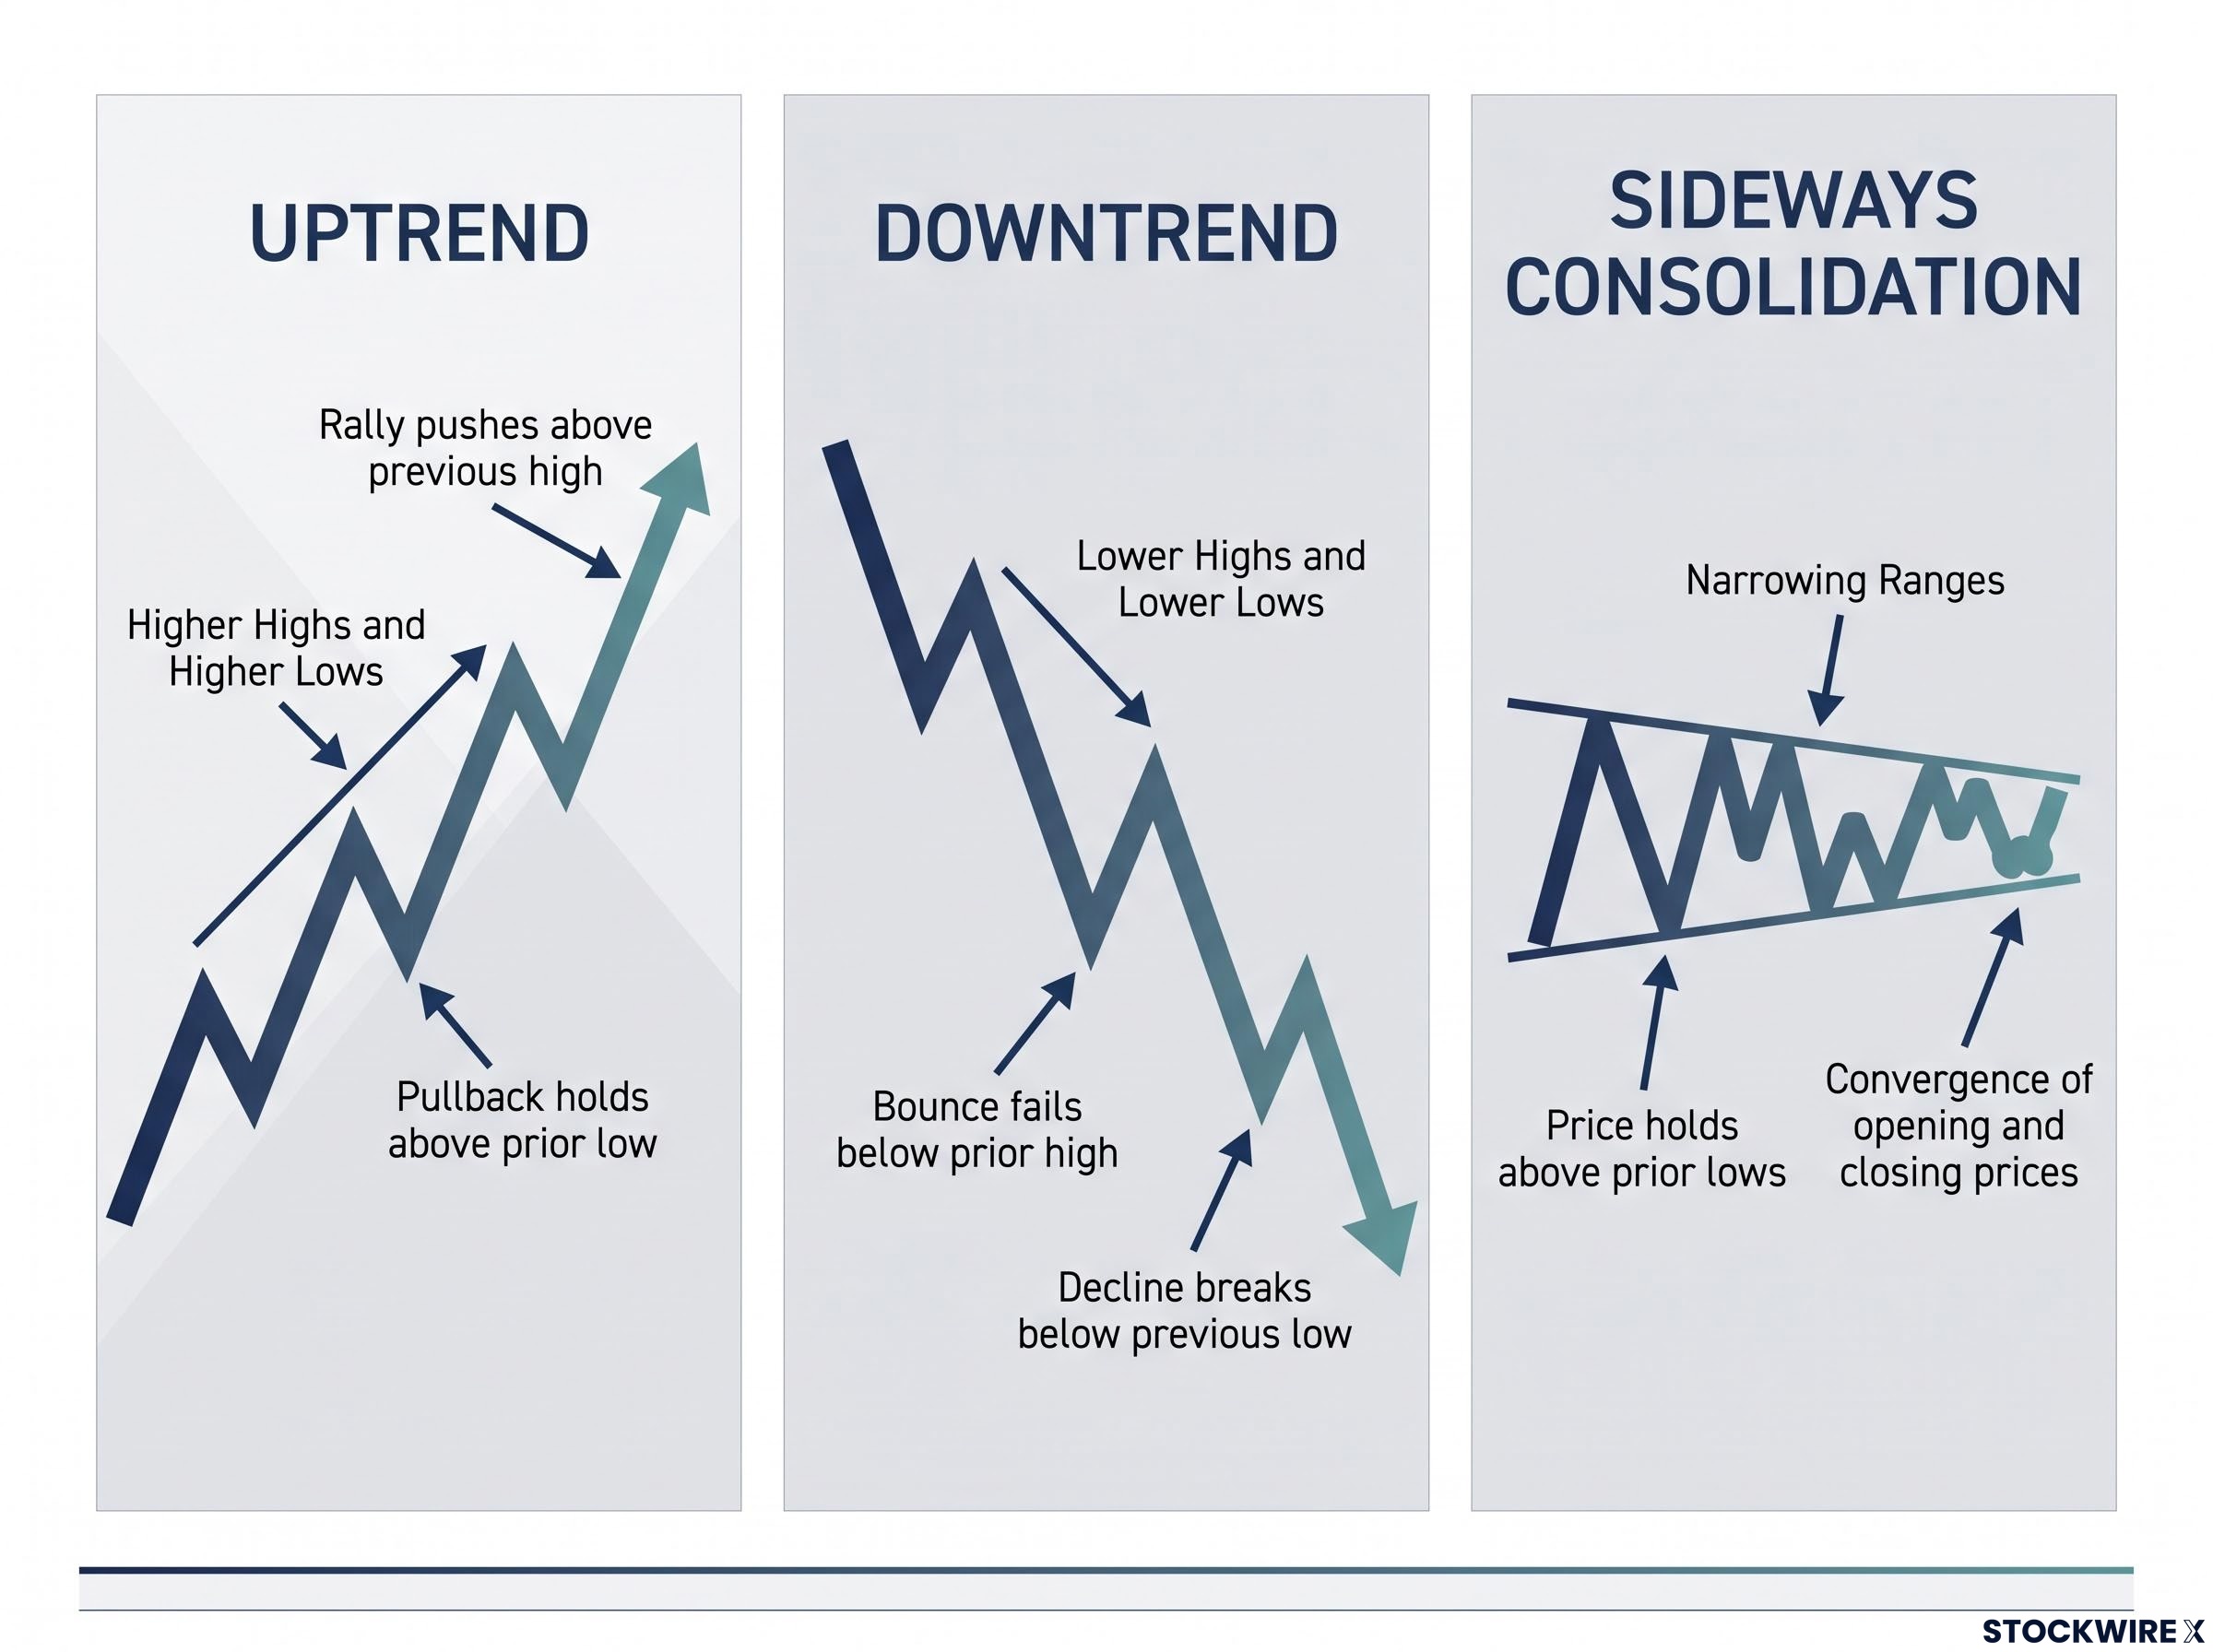
An uptrend is a series of higher highs and higher lows. Each pullback holds above the prior low, which tells you demand is dominant: buyers are stepping in at progressively higher prices.
- Price makes a new high, then pulls back
- The pullback holds above the previous low
- The next rally pushes above the previous high
- The pattern repeats, creating a staircase of rising prices
A downtrend is the mirror image: lower highs and lower lows. Each rally fails at a lower level than the one before, confirming that supply is dominant and sellers control the price.
- Price makes a new low, then bounces
- The bounce fails below the prior high
- The next decline breaks below the previous low
- Selling pressure increases with each cycle
The single most common timing error among retail investors is buying a downtrending stock on fundamental valuation grounds alone. The business may be worth more than the current price, but the market is actively repricing it lower, and stepping in front of that momentum is a low-probability trade.
Sideways consolidation: where the opportunity often hides
Consolidation is the transition zone between trend phases. After a sustained decline, price stops making new lows and begins oscillating in a range. This is where you should pay closest attention, because it is where reversals are born.
The three visual signals to watch for on daily and weekly charts:
- Narrowing ranges: The distance between daily highs and lows compresses, showing that neither buyers nor sellers are winning convincingly
- Price holding above prior lows: Failed attempts to break below the base of the range signal that selling pressure is exhausting itself
- Convergence of opening and closing prices: When candles start closing near where they opened, it tells you the tug-of-war is reaching equilibrium
Recognising these three structures gives you a framework to assess any ASX stock’s price behaviour without complex indicators. When a stock on your watchlist shifts from downtrend to consolidation, it moves from the “not yet” column to “watching closely,” and that is the first practical act of combining technicals with your existing fundamental work.
Volume confirmation: the filter that separates real moves from traps
You have identified a stock that has built a base after a decline. The consolidation signals look right. The question now is whether the base is worth acting on, or whether it is a pause before another leg down. Volume is what answers that question.
Price tells you what happened. Volume tells you how serious it was.
Volume measures how many shares trade in a given period, and it functions as a conviction filter for price moves. Without it, you are pattern-watching. With it, you are evaluating evidence.
Integrating trading volume confirmation into your routine reveals whether institutional capital is genuinely supporting a breakout or if retail enthusiasm is driving a fragile rally.
Three specific volume signals to check before committing capital:
- High-volume breakouts and reversals carry more weight. When price breaks above the consolidation range on volume significantly above the recent average, the move is more likely to persist. A breakout on thin volume frequently fails within days.
- Accumulation at lows signals institutional buying. Look for sustained buying volume on up days near the base of the range, combined with decreasing volume on down days. This pattern often indicates that larger, better-resourced investors are absorbing supply at those levels, a signal that selling pressure is exhausting itself.
- Low-volume rallies are fragile and frequently trap retail buyers. A price bounce on minimal volume tells you conviction is absent. These rallies fail at a high rate, and they are the specific mechanism by which investors who acted on fundamentals alone get trapped in false breakouts.
Volume data is available on most Australian brokerage and charting platforms at no additional cost. For any stock on your watchlist where the chart structure looks promising, checking volume before you act is the difference between “this looks interesting” and “this is worth committing capital to.” Skipping this step is why many technically aware investors still get caught in false moves.
A practical entry and exit framework for ASX stocks
Knowing what to look for is not the same as knowing when to act and how much to risk. This section converts the concepts from earlier into a sequential process: each step qualifies the next, and skipping a step is what creates the timing errors this guide opened with.
Defining your entry: the four-step sequence
- Confirm the fundamental case. Screen for ASX stocks with solid earnings, manageable debt, and competitive advantages. This is the work you are already doing. It narrows the universe to businesses worth owning.
- Assess trend and structure on daily and weekly charts. Is the stock in a clear uptrend, downtrend, or sideways range? If it remains in a strong, unbroken downtrend, wait. Look for a base forming.
- Wait for consolidation plus volume confirmation. During a base after a decline, watch for tight sideways price action, narrowing daily ranges, failed new lows, and rising volume on tests of support. These signals tell you buyers are absorbing supply.
- Enter on confirmation of reversal. Common entry triggers include a breakout above resistance on strong volume, pattern completion (such as an inverse head-and-shoulders or double bottom breaking the neckline), or a momentum confirmation signal like RSI (a measure of whether a stock is being overbought or oversold) crossing above 50, or MACD (a momentum indicator that tracks the relationship between two moving averages) turning up from below zero after basing.
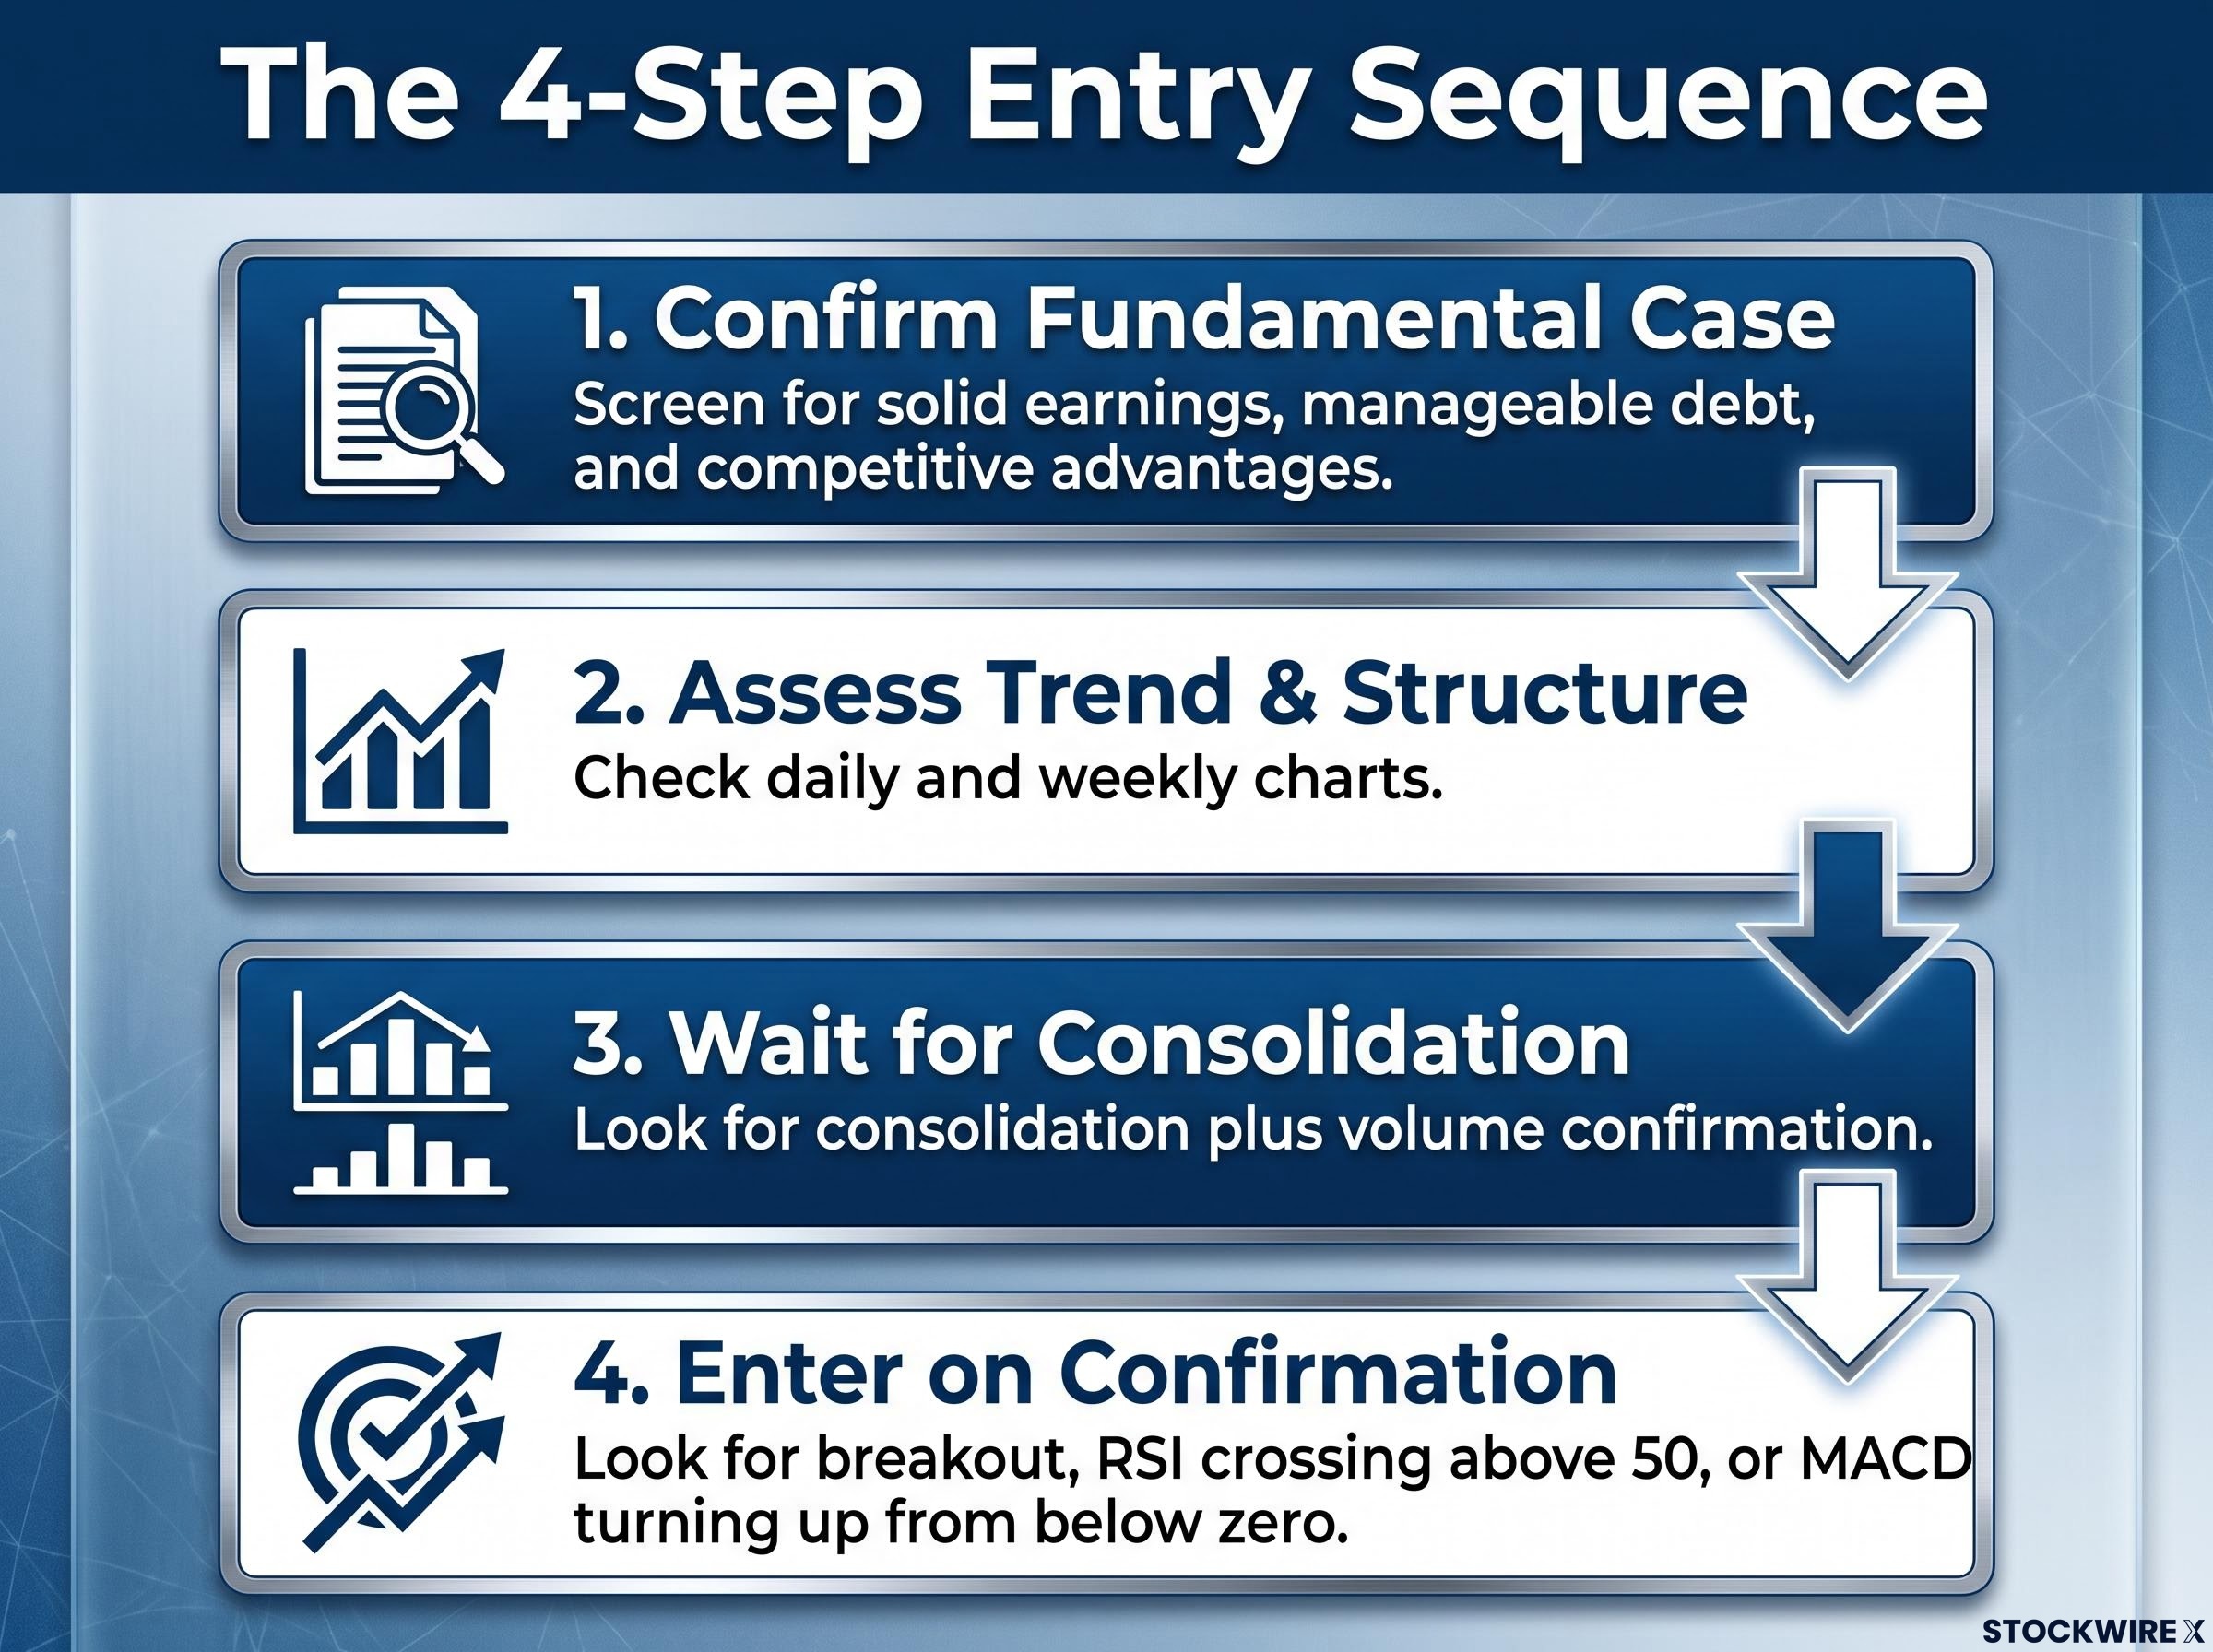
The sequence works as a gate. Each step must be satisfied before you move to the next. If the fundamental case is strong but the chart shows a clear downtrend with no base forming, the answer is “not yet,” not “buy anyway.”
Stops, sizing, and exits: the discipline that protects the gain
Deciding in advance where your stop sits, how large your position will be, and where you intend to exit is what distinguishes a planned trade from an impulsive one. For retail investors in volatile ASX sectors like resources and small caps, building this habit before entering a position is what keeps a run of losing trades from causing lasting damage to your portfolio.
Logical stop placement means positioning your stop at a level that objectively invalidates the trade setup:
- Below the base of the consolidation pattern
- Below the most recent swing low in an uptrend
- Below a well-defined support level
Position sizing flows directly from the stop. Professional risk management texts commonly suggest risking 0.5-2% of your portfolio per trade. The formula: acceptable dollar risk divided by risk per share (entry price minus stop price) equals your position size.
ASIC Moneysmart guidance on share trading risks covers the core principles of managing exposure in volatile markets, including the importance of understanding your risk tolerance and not committing capital you cannot afford to lose, which underpins every position sizing decision you make.
Three exit methods give you a structured approach to taking profits:
| Method | What it involves | When to use it |
|---|---|---|
| Target prior resistance | Setting initial profit targets at historical resistance zones where selling previously emerged | When you want a defined exit point and the stock has clear overhead resistance levels |
| Risk-reward filter | Only entering when potential reward is at least 2-3 times the defined risk | Before every entry, as a minimum threshold that ensures the strategy’s edge even with modest win rates |
| Trailing stop | Raising the stop below successive swing lows or moving averages as the trade moves in your favour | When a position is profitable and the trend remains intact, allowing profits to run while protecting the gain |
Five mistakes ASX retail investors make and how this framework prevents them
Each of these errors is something you have probably done, or come close to doing. Naming them is not instruction for its own sake. It is diagnostic: if you can recognise your own pattern, you can apply the specific part of the framework that addresses it.
Many of these recurring investing mistakes stem from the heavy concentration of bank and resource stocks on the local exchange, which creates structural traps for inexperienced traders.
According to ASIC data, retail traders who attempt to time every market move consistently tend to buy near peaks and sell near troughs, accumulating substantial losses over time. These figures reflect a real and recurring cost paid by investors who act without a structured process.
- Buying at 52-week lows because a stock “looks cheap.” Without evidence of stabilisation or reversal, low prices can still go much lower. The chart structure step (Step 2) prevents this by requiring you to see a base forming before you act on a valuation signal.
- Ignoring higher timeframes. A daily uptrend within a weekly downtrend is fragile. Most timing frameworks stress aligning your trades with the dominant higher-timeframe trend. Checking both weekly and daily charts (Step 2) catches this mismatch before it costs you.
- Moving stops wider after entry to avoid being stopped out. This turns a planned, limited-risk trade into an open-ended bet. The position sizing and stop discipline (Step 4 and the exit framework) pre-defines your risk in dollar terms. Once set, the stop stays.
- Neglecting volume confirmation. Patterns without volume are significantly less reliable. The volume confirmation step (Step 3) is one of the simplest ways to improve entry quality, and skipping it is the most common reason technically aware investors still get trapped.
- Overtrading and day-trading without a demonstrable edge. ASIC data confirm this is one of the most destructive behaviours for retail capital. The four-step entry sequence forces you to wait for multiple conditions to align before acting, which naturally reduces trade frequency to only the highest-conviction setups.
For each mistake, the framework section that prevents it is already built into the process you have learned in this guide. The discipline is not separate from the analysis; it is the analysis, applied consistently.
Tackling behavioural biases like FOMO and panic selling requires this exact type of structural habit, ensuring your risk management rules override emotional reactions during sharp market drawdowns.
Making technical analysis part of your ongoing ASX process
Understanding the framework is one thing. Applying it consistently is where the returns come from. The investors who benefit most from combining fundamentals and technicals are those who build a weekly review routine rather than reaching for charts only when a position is already going wrong.
A practical five-step process you can begin this week:
- Build a watchlist of fundamentally sound ASX stocks. These are the companies you have already identified through your earnings, debt, and competitive advantage screens.
- Map the weekly and daily trend, key support and resistance, and recent volume behaviour for each. This takes minutes per stock once you know what to look for.
- Only consider entries when the technical picture shows a healthy uptrend or a completed base confirmed by price and volume. If neither condition exists, the stock stays on the watchlist. No action required.
- Define entry, stop, and initial target before placing the trade. Size the position so a stop-out represents a small, acceptable fraction of your portfolio (the 0.5-2% guideline).
- Journal each trade with both the fundamental thesis and technical rationale. Review outcomes periodically to refine your process. This is how you learn which setups work best for the ASX sectors and stock types you follow.
Empirical work indicates that combining fundamental and technical analysis can improve timing, reduce drawdowns, and help convert fundamental insight into more consistent realised returns. This approach does not remove risk. No framework does. But it adds the timing layer that fundamental analysis alone was never designed to provide.
For investors looking to develop a more structured grounding in this combined approach, Wealth Within offers an accredited diploma in share trading and investment that covers both technical and fundamental analysis as part of a formal curriculum.
Your next step is not to master all of this at once. It is to apply the framework to one stock on your existing watchlist this week. Map the trend, check the volume, define your risk. That single exercise will tell you more about how this process works than any amount of reading.
This article is for informational purposes only and should not be considered financial advice. Investors should conduct their own research and consult with financial professionals before making investment decisions.
—