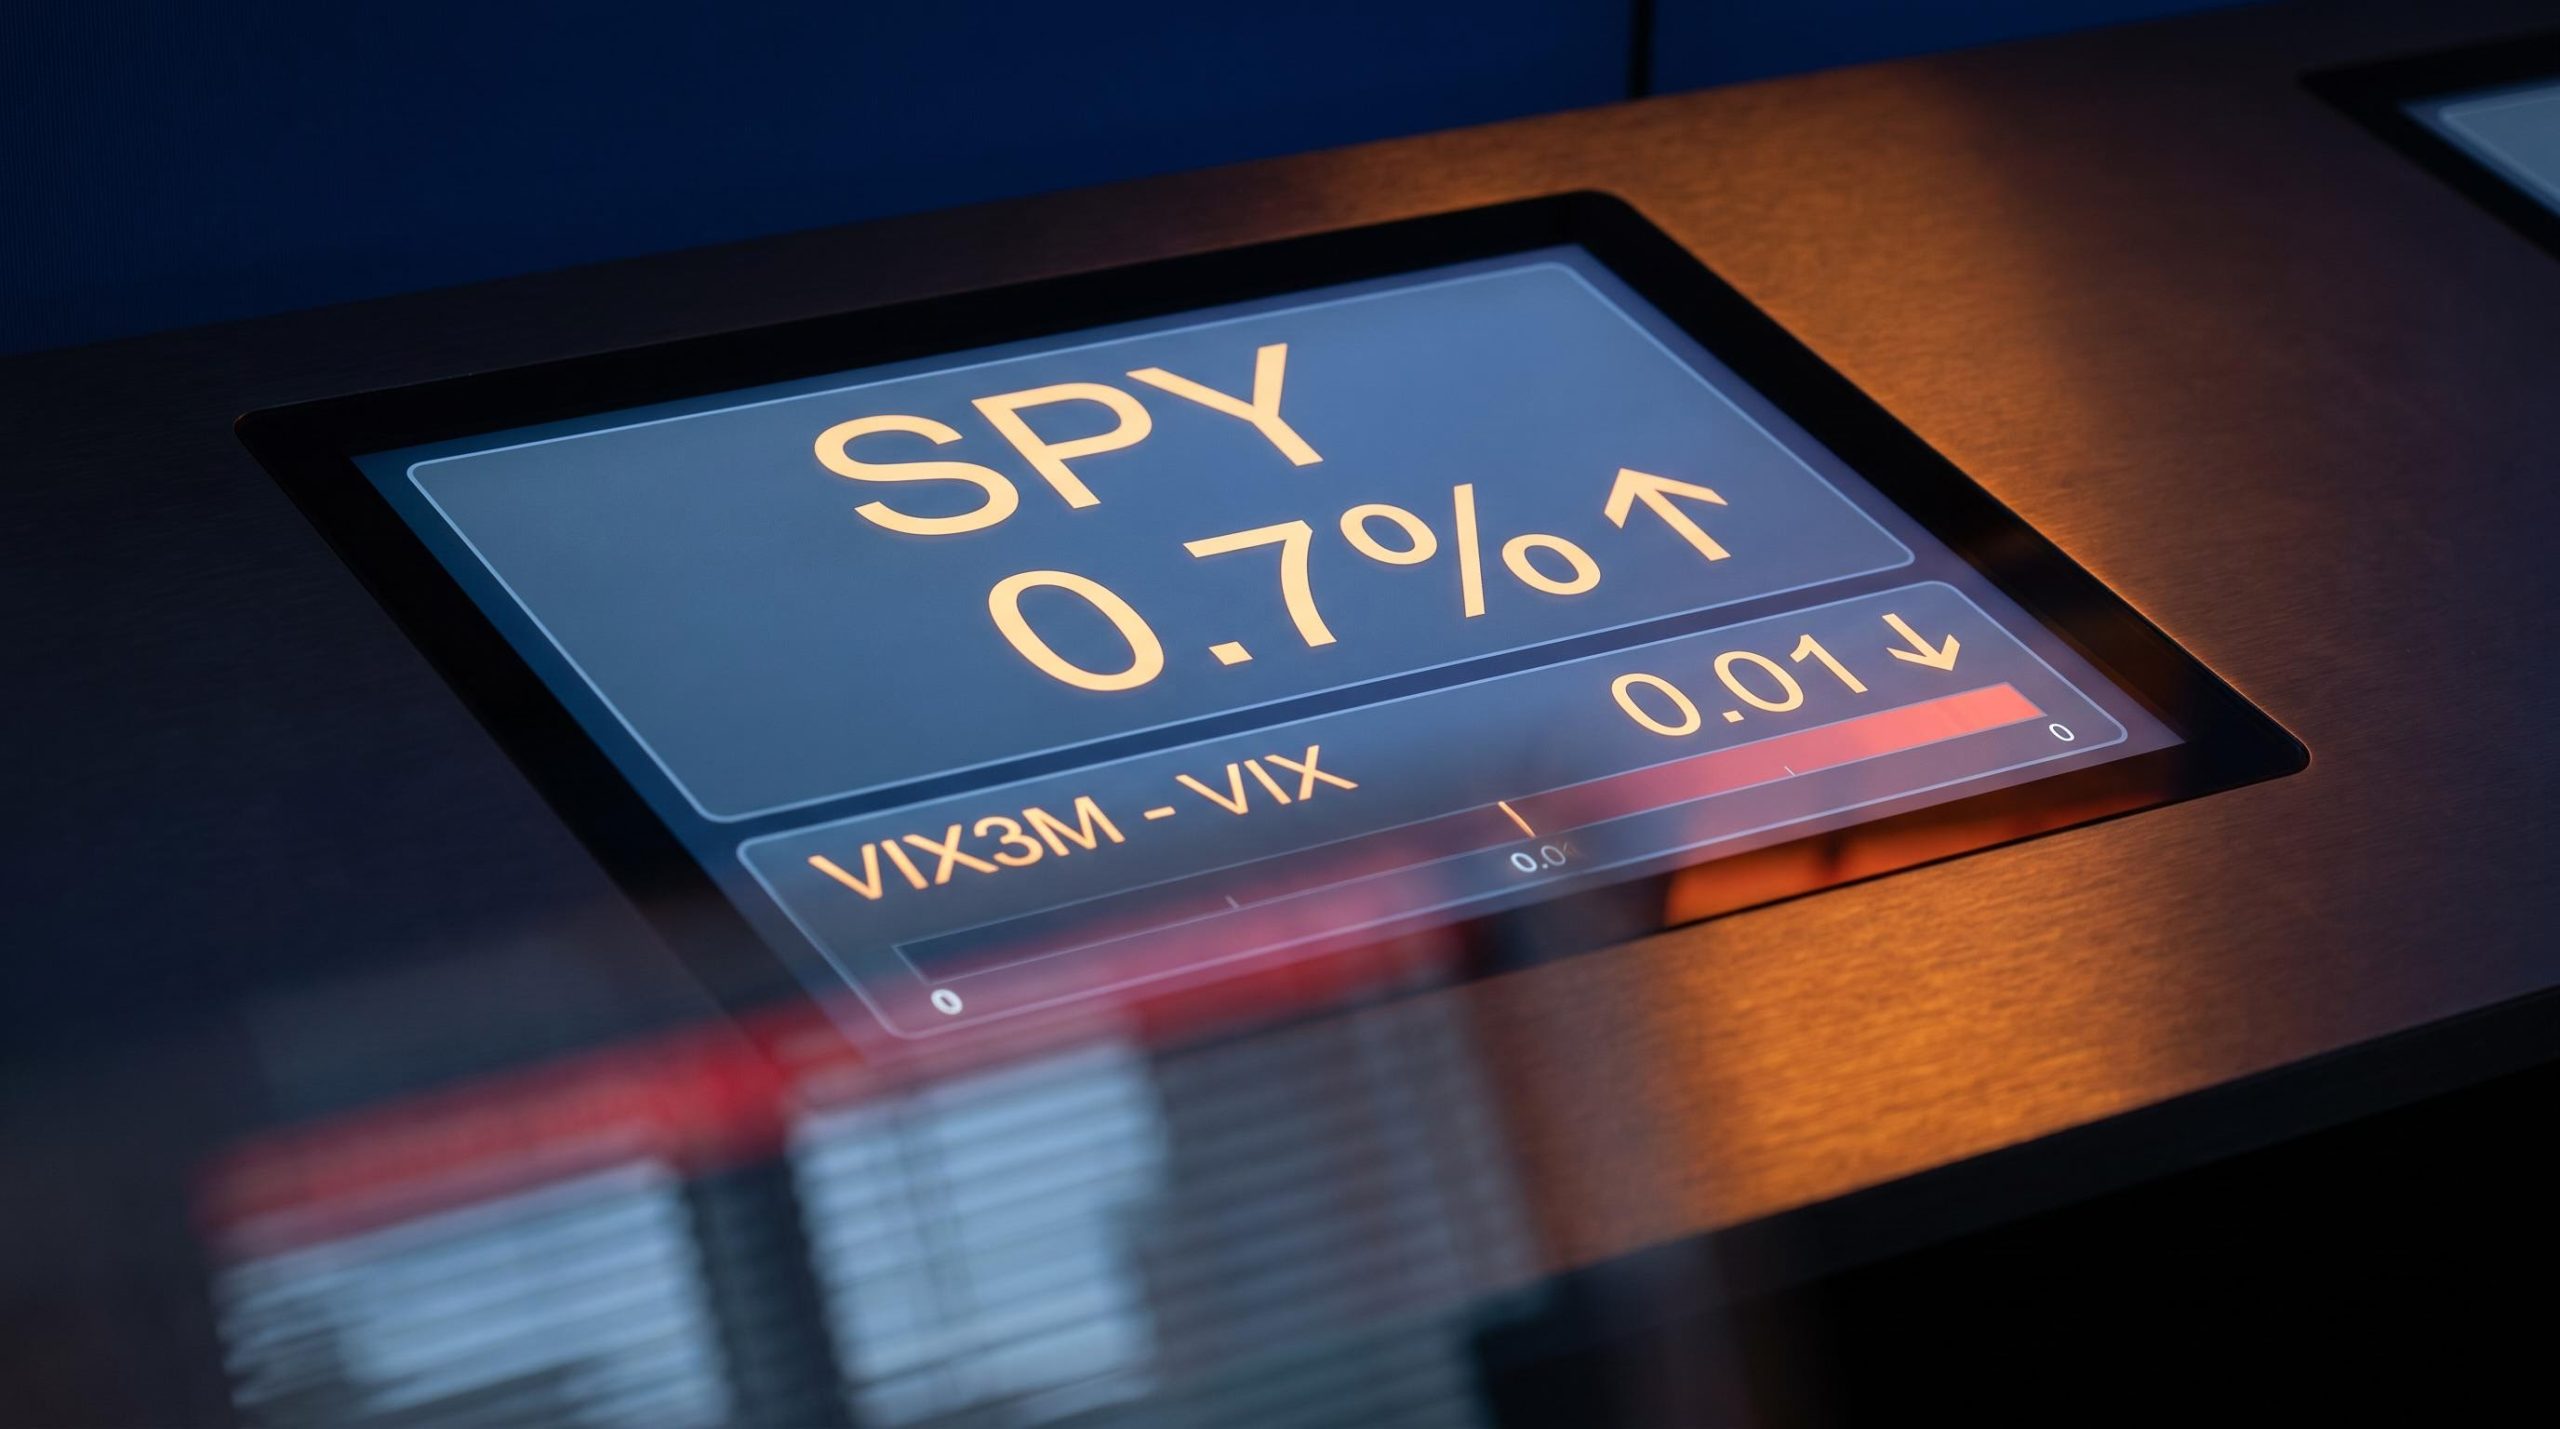
A retail trader pulls up the premarket screen at 8:45 a.m. Eastern, sees SPY gapping up 0.7%, and sizes into a long at the open. The logic feels sound: the market is already moving higher, so the day should close green. The question is whether that assumption has any statistical foundation, or whether it is intuition dressed up as a strategy.
Overnight gaps are one of the most discussed signals in active equity trading. The popular belief that gap size reliably predicts daily direction persists across trading forums, premarket commentary, and YouTube tutorials. Yet historical data from 2017 to 2026 shows that gap size alone barely beats a coin flip for most price ranges. If you are relying on it, you are not using an edge. You are experiencing random confirmation.
Here is what the data actually tells you, and in what order those questions should be asked. After this, you will know why the directional question is the least useful thing to ask about a gap, and what to ask instead before committing capital at the open.
The coin-flip problem: what gap size actually predicts about SPY’s daily close
SPY closes positive on approximately 53-55% of all trading days, reflecting the index’s structural upward drift. That is the baseline. Any gap-based directional rule needs to beat that figure by a meaningful margin to represent genuine edge rather than noise riding the market’s long-run bias.
The data, bucketed by overnight gap size, does not cooperate with the popular narrative.
| Gap Size | Open-to-Close “Up” Rate | vs. Unconditional Drift (53-55%) |
|---|---|---|
| 0.1-0.25% | ~50% | Below baseline |
| 0.25-0.5% | ~50% | Below baseline |
| 0.5-1.0% | Low-to-mid 50s | At or near baseline |
| 1-2% | ~60% | ~5-7 points above |
Across nearly all gap size categories, the open-to-close positive rate sits within a narrow band of roughly 49% to 57%, which is functionally indistinguishable from the market’s unconditional drift. A meaningful departure from that baseline only appears in the 1-2% upside gap range, where the positive close rate climbs to around 60%, a margin of approximately 10 percentage points over chance. Those sessions are both rare and typically catalyst-driven.
At the strongest point in the data, the 1-2%+ upside gap bucket, close to 40% of those sessions still finished lower from the open. That reversal rate undermines the “gap-up means green day” assumption even where the statistical tilt is largest.
Your instinct to act on a premarket gap size is being driven by pattern recognition, not probability. The historical record does not support the confidence you are likely placing in that signal. The difference between 50% and 55% is not an edge. It is noise shaped like conviction.
Market inefficiency, driven by passive index dominance and behavioural biases rather than random error, helps explain why small overnight gaps cluster near coin-flip directional rates: when the pricing signal is weak, no gap size below a meaningful threshold carries reliable information about the day’s subsequent direction.
When big ASX news breaks, our subscribers know first
The better question: which gaps actually fill, and when?
“Does this gap fill?” is a substantially better question than “does this gap predict a green or red day?” Small gaps behave like noise in thin overnight futures markets. Fading them toward the prior session’s close is a more statistically grounded approach than attempting to trade any gap directionally.
Same-day fill probability falls sharply as gap size increases, and the decay follows a consistent pattern across multiple large-sample studies of SPY.
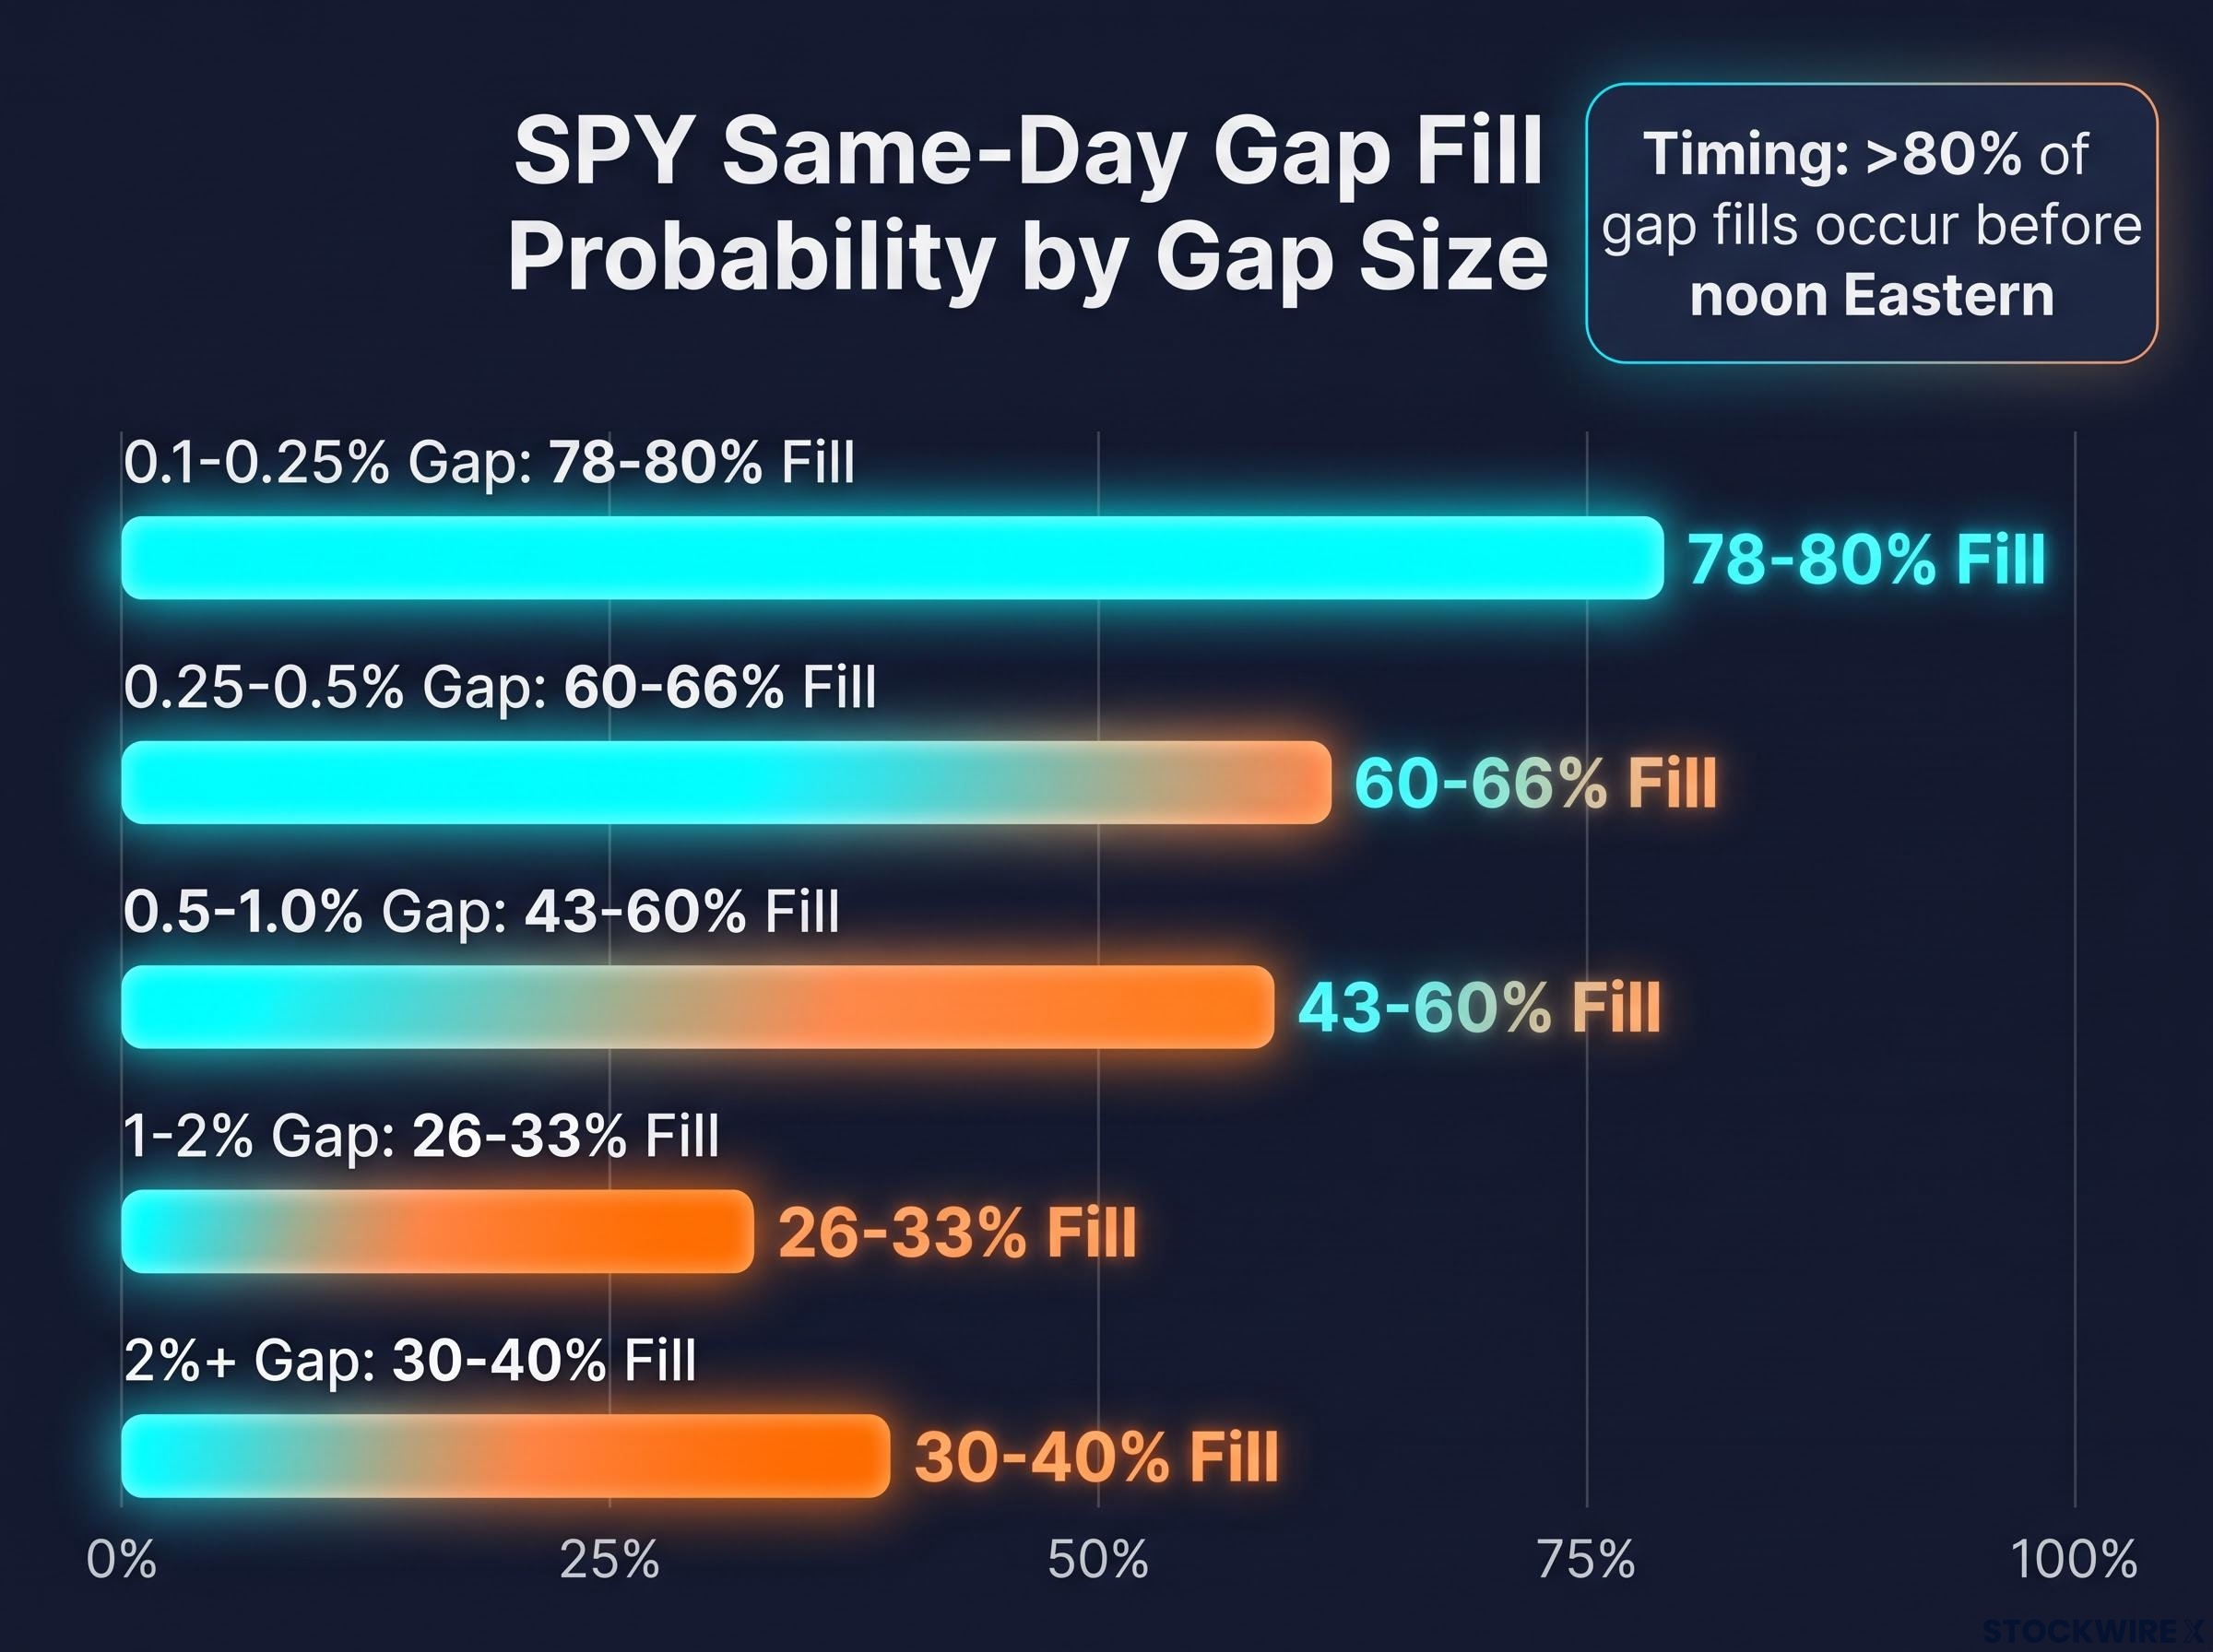
| Gap Size Category | Same-Day Fill Rate | Fill Within 5 Sessions |
|---|---|---|
| Very small (0.1-0.25%) | ~78-80% | ~91-92% |
| Small-moderate (0.25-0.5%) | ~60-66% | ~82-90% |
| Medium (0.5-1.0%) | ~43-60% | Sample-dependent |
| Large (1-2%) | ~26-33% | Sizable fraction unfilled |
| Very large (2%+) | ~30-40% | ~50% still open after 5 sessions |
Across all gaps combined, SPY gaps fill intraday approximately 60% of the time. But that headline number masks the real structure. Below 0.5%, fill rates sit at 70-80% or higher. Above 1.5%, they collapse to 30-40%, and roughly half remain unfilled five sessions later.
Gap-down sessions show slightly higher fill rates than gap-ups, approximately 69% versus 59%. That asymmetry is consistent with the structural upward drift of equities: mean-reversion pressure pulls harder into bearish gaps because the underlying market carries a positive long-run bias.
When fills do happen, they happen early. More than 80% of all gap fills occur before noon Eastern. The implications for execution are direct:
- Your stop placement must account for the first-hour volatility where most fills concentrate
- Entry timing matters more in the morning session than at any other point in the day
- If a gap has not filled by midday, the probability it fills that session drops sharply, and afternoon participation in a fade trade carries diminishing statistical support
The sharp decay in fill rates above 0.5% tells you something actionable: large gaps are not temporary dislocations to be faded by default. They are potential repricing events. Treating them the same way as small gaps is the specific mechanical error that produces outsized losses in gap-fade strategies.
Reading the regime: how VIX level and term structure separate noise from repricing
Fill probability gives you a baseline, but it cannot resolve the ambiguous middle cases on its own. A 0.7% gap-down has a same-day fill rate somewhere in the 43-60% range. Is that a fade or not? The answer depends on what the volatility market is telling you.
The primary tool for making that distinction is the VIX term structure, which refers to the relationship between short-dated implied volatility (what the options market expects over the next 30 days) and longer-dated implied volatility (what it expects over the next 90 days or more).
The VIX-based regime filters described here draw on the same underlying mechanics as implied volatility in individual options chains, where the number extracted from live market prices reflects collective expectation about future movement magnitude rather than any directional forecast.
In normal conditions, the VIX term structure slopes upward: near-term volatility is lower than longer-term volatility. This shape is called contango, and it tells you the market is pricing near-term conditions as calmer than the longer-run average. Under stress, the curve flattens or inverts into what is called backwardation: near-term implied volatility trades above longer-dated volatility because traders are paying a premium for immediate protection.
A simple, calculable spread captures this: VIX3M (the three-month volatility index) minus VIX (the one-month index). When the result is positive, you are in contango. When it turns negative, the curve is in backwardation and the market is pricing stress.
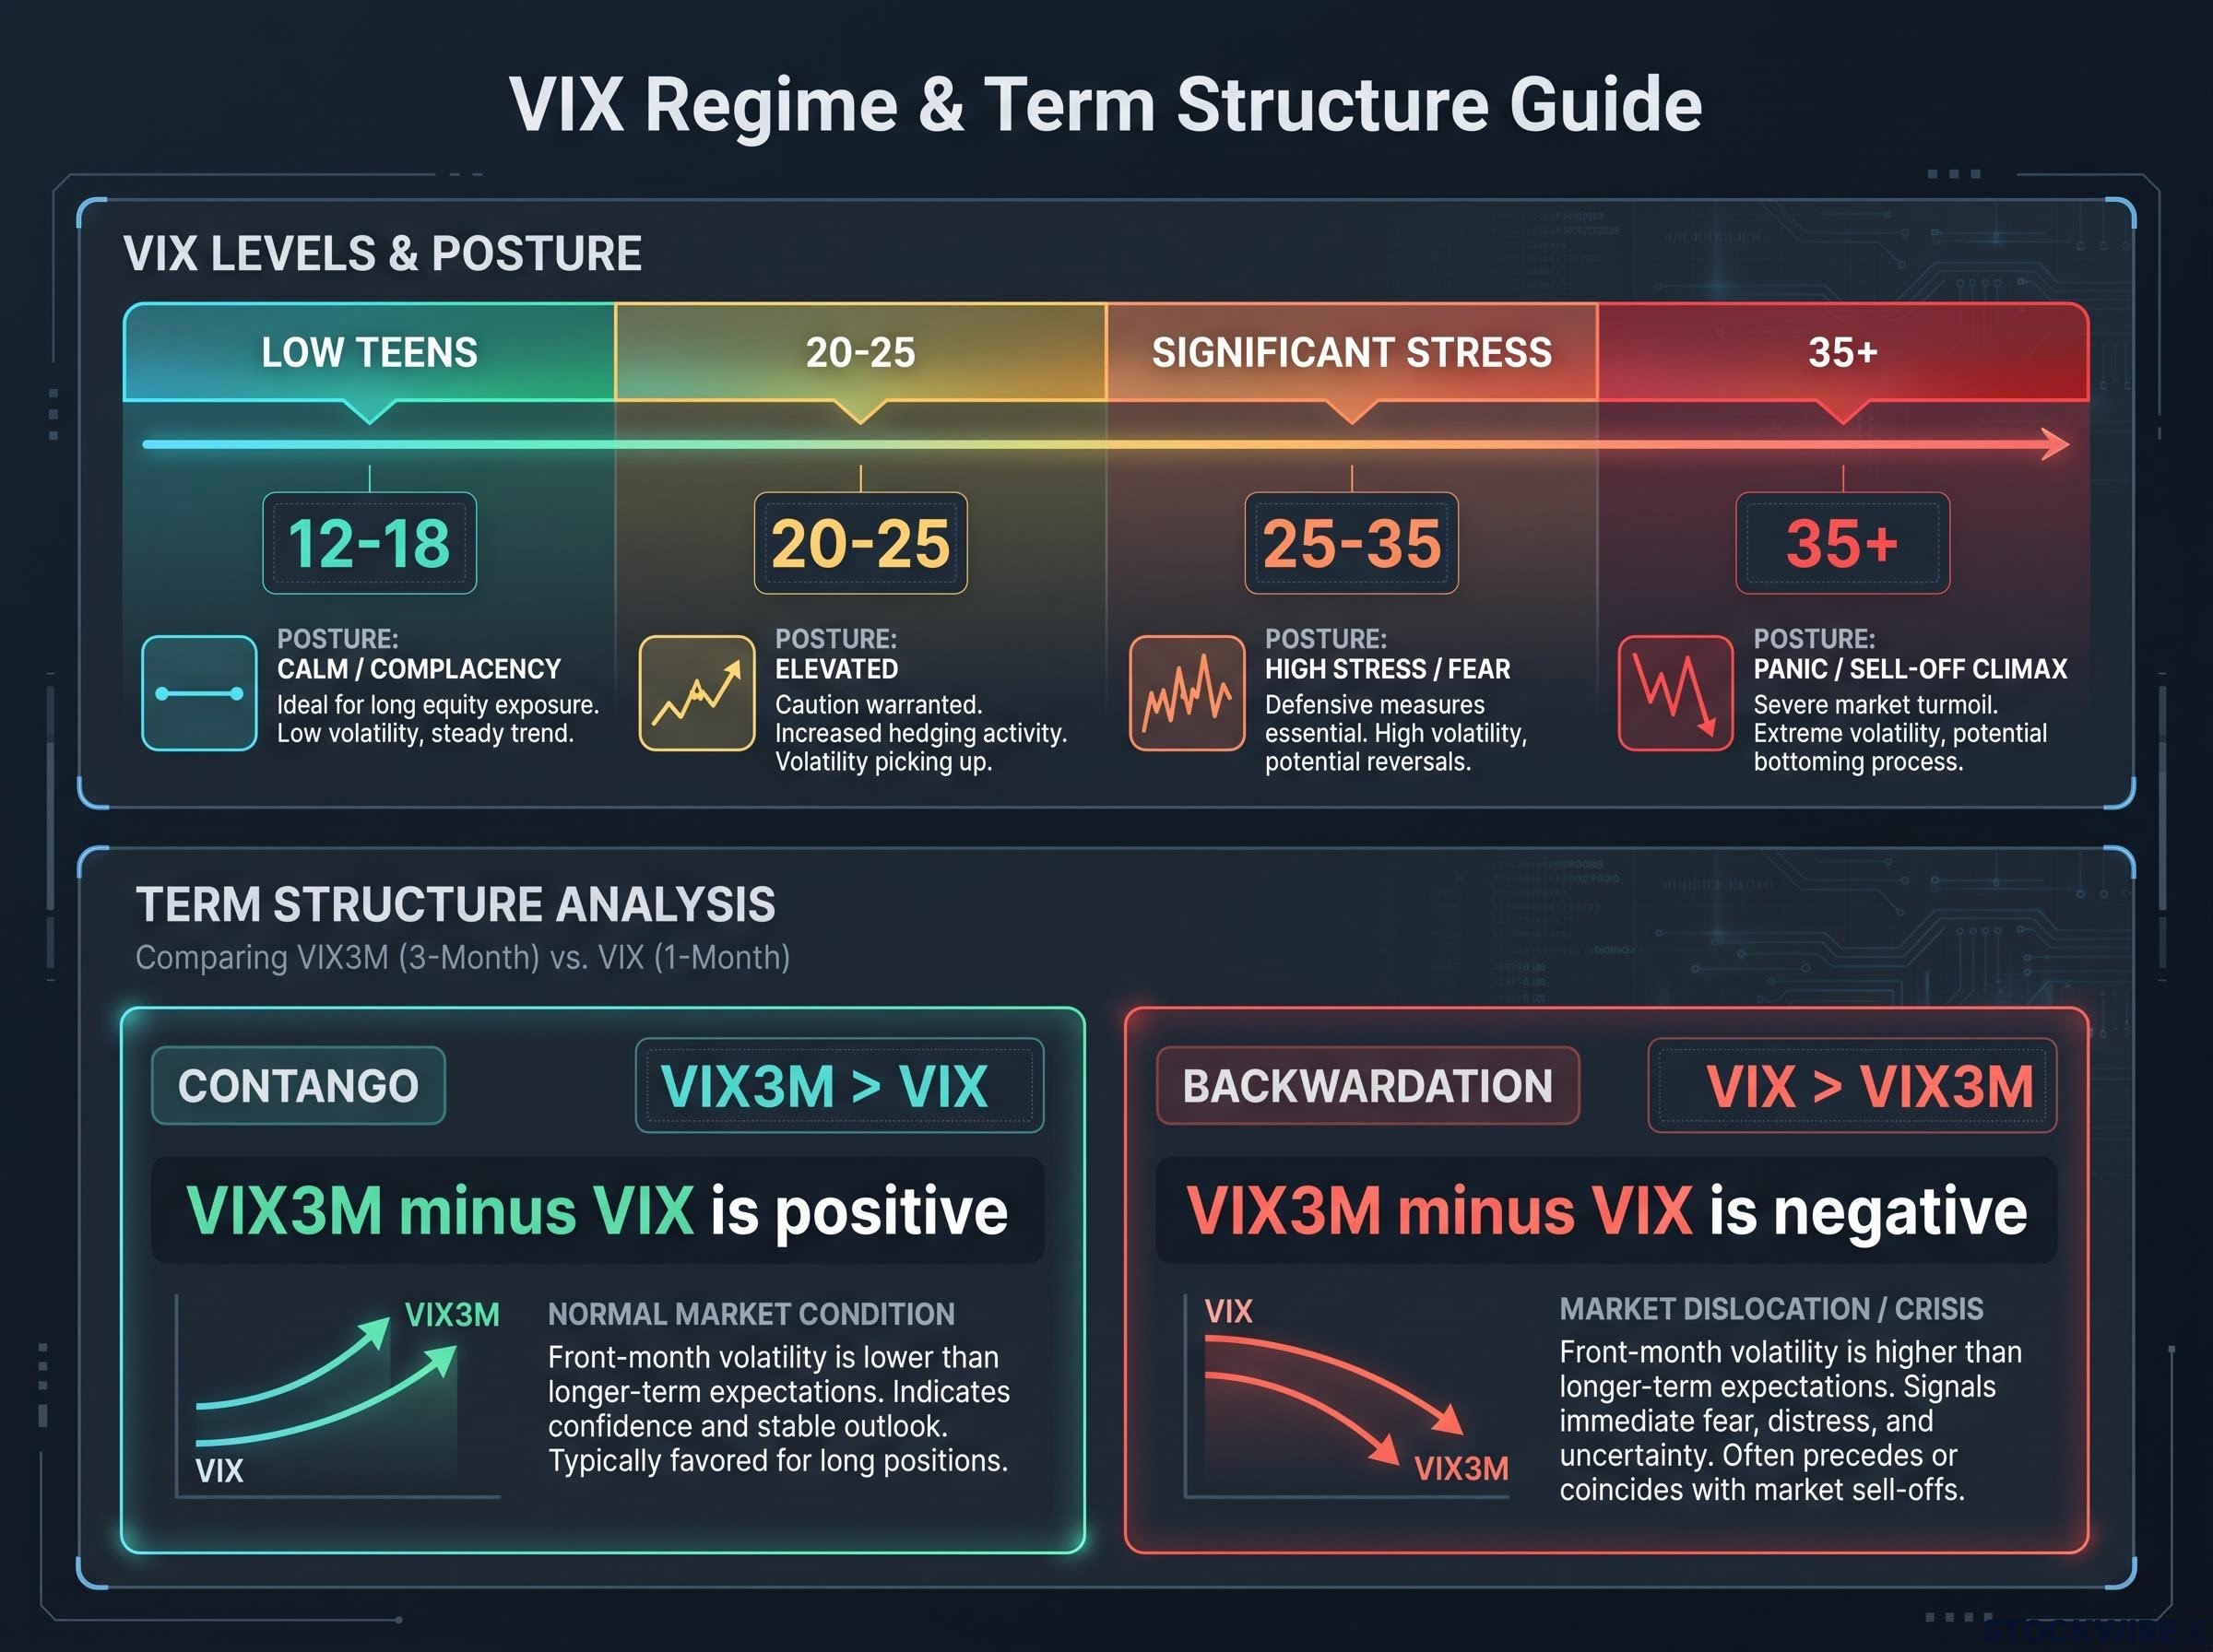
| VIX Level | Implied Regime | Recommended Posture |
|---|---|---|
| Low teens and below | Calm | Gap-fade setups statistically grounded |
| 20-25 | Elevated but not crisis | Fade with reduced size; confirm with term structure |
| 25-35 | Significant stress | Defensive; require strong confirming evidence |
| 35+ | Panic / sell-off climax | Do not fade without regime confirmation |
Applying the volatility overlay: two scenarios compared
The two contrasting scenarios make the decision logic concrete.
- Muted VIX, contango intact. You see SPY gap down 0.8% premarket. VIX is at 16, up marginally from the prior close. The VIX3M minus VIX spread is positive. What you are looking at is orderly selling in thin overnight markets, with no repricing of near-term risk by the options market. The prior close still functions as a plausible price magnet. This supports a mean-reversion posture, sized to the fill-probability baseline for a gap of that magnitude.
- VIX spike, backwardation. You see SPY gap down 0.8% premarket. But VIX has jumped from 18 to 27. The VIX3M minus VIX spread has turned negative. What you are looking at is a genuine stress signal. The options market is pricing near-term conditions as riskier than the longer-run outlook, which means traders are paying up for immediate protection. The prior close may no longer be a relevant price magnet. Fading this gap requires much smaller size and stronger confirming evidence.
The term structure spread is the one variable that tells you whether the gap you are looking at is priced as temporary noise by the options market or as the beginning of a sustained regime shift. That distinction determines whether fading the gap is a high-probability trade or a directionally reckless one.
A decision hierarchy that puts the right questions in the right order
The framework synthesises into four questions, asked in a specific order. The sequence matters because each layer resolves uncertainty before the next question becomes relevant.
- How large is the gap? Check the overnight gap size against the fill-probability thresholds. Under 0.5%: high-probability mean-reversion candidate (70-80% same-day fill). 0.5-1.0%: ambiguous zone where volatility context decides. Over 1.5%: treat as a potential repricing event and do not assume mean reversion.
- What is the VIX doing? Check whether VIX is at calm, elevated, or stress levels. This tells you whether the broader market is pricing the conditions around the gap as normal or abnormal.
- What is the term structure doing? Check the VIX3M minus VIX spread. A positive spread (contango) confirms the VIX-level signal and supports mean-reversion posture. A negative spread (backwardation) contradicts a calm VIX reading or amplifies a stressed one. This is the confirmation step.
The VIX contango structure, where front-month contracts trade below outer contracts, is the same curve shape this article uses as a baseline for the calm-regime gap-fade posture, and its relationship to broader valuation signals is a layer of context the framework here does not attempt to resolve.
- What direction is the gap? Note it, but do not act on it in isolation. Most gap buckets produce 50-55% open-to-close “up” rates, barely above unconditional drift.
The directional question is the least reliable filter available, yet it is the first thing most traders ask. The hierarchy inverts that instinct deliberately.
The full framework needs to be run premarket, not reactively during the open. More than 80% of gap fills concentrate before noon Eastern, which means the decision about whether and how to trade a gap must be made before the bell, not in the first five minutes of price action.
What the framework does not do is guarantee outcomes. It structures probabilities so that position sizing and risk management can be calibrated to the statistical likelihood of each scenario rather than to the trader’s directional conviction.
The hierarchy tells you something you are likely not doing currently: you are starting with the least informative question, which direction will this day go, when you should be starting with the most informative one, how big is the gap and what does that imply about fill probability. That inversion is the root cause of most gap-based trading errors.
What this framework changes, and what it cannot fix
The three-layer argument is straightforward. Directional gap prediction is near-random for most gap sizes, with the maximum observed edge only about 10 percentage points above random, and only on the largest upside gap sessions. Fill probability provides the most actionable statistical structure, particularly for gaps under 0.5% where same-day fill rates sit at 70-80% or higher. And volatility regime context, specifically VIX level combined with term structure, resolves the ambiguous middle cases where fill probability alone does not give you a clear answer.
Options market signals extend the regime-reading framework beyond VIX level into put-call skew, futures curve clustering, and breadth divergence, each of which adds granularity to the question of whether near-term implied volatility is pricing a temporary dislocation or an entrenched stress regime.
This is a shift in the quality of the questions you ask before opening a position, not a signal system that guarantees edge.
One limitation needs to be stated plainly: even the best-calibrated probability framework will lose on roughly 20-40% of trades depending on gap size category. Position sizing must reflect that reality rather than the win rate you want to believe in. Large gap sessions above 1.5% remain the framework’s most ambiguous zone, requiring regime confirmation before any fade.
The practical takeaways reduce to three:
- The fill-probability threshold system by gap size: under 0.5% is high-confidence mean reversion, 0.5-1.0% is ambiguous, over 1.5% demands caution
- The VIX and term structure check as a regime filter, using the VIX3M minus VIX spread to distinguish noise from repricing
- The decision hierarchy with direction as the final, lowest-weight input, not the starting point
The behavioural shift is not from losing to winning. It is from acting on low-confidence directional intuition to acting on higher-confidence structural probability, and that difference, applied consistently across many trades, is where the compounding effect of statistical discipline shows up in your results.
This article is for informational purposes only and should not be considered financial advice. Past performance does not guarantee future results. Traders should conduct their own research and consult with financial professionals before making trading decisions.
—