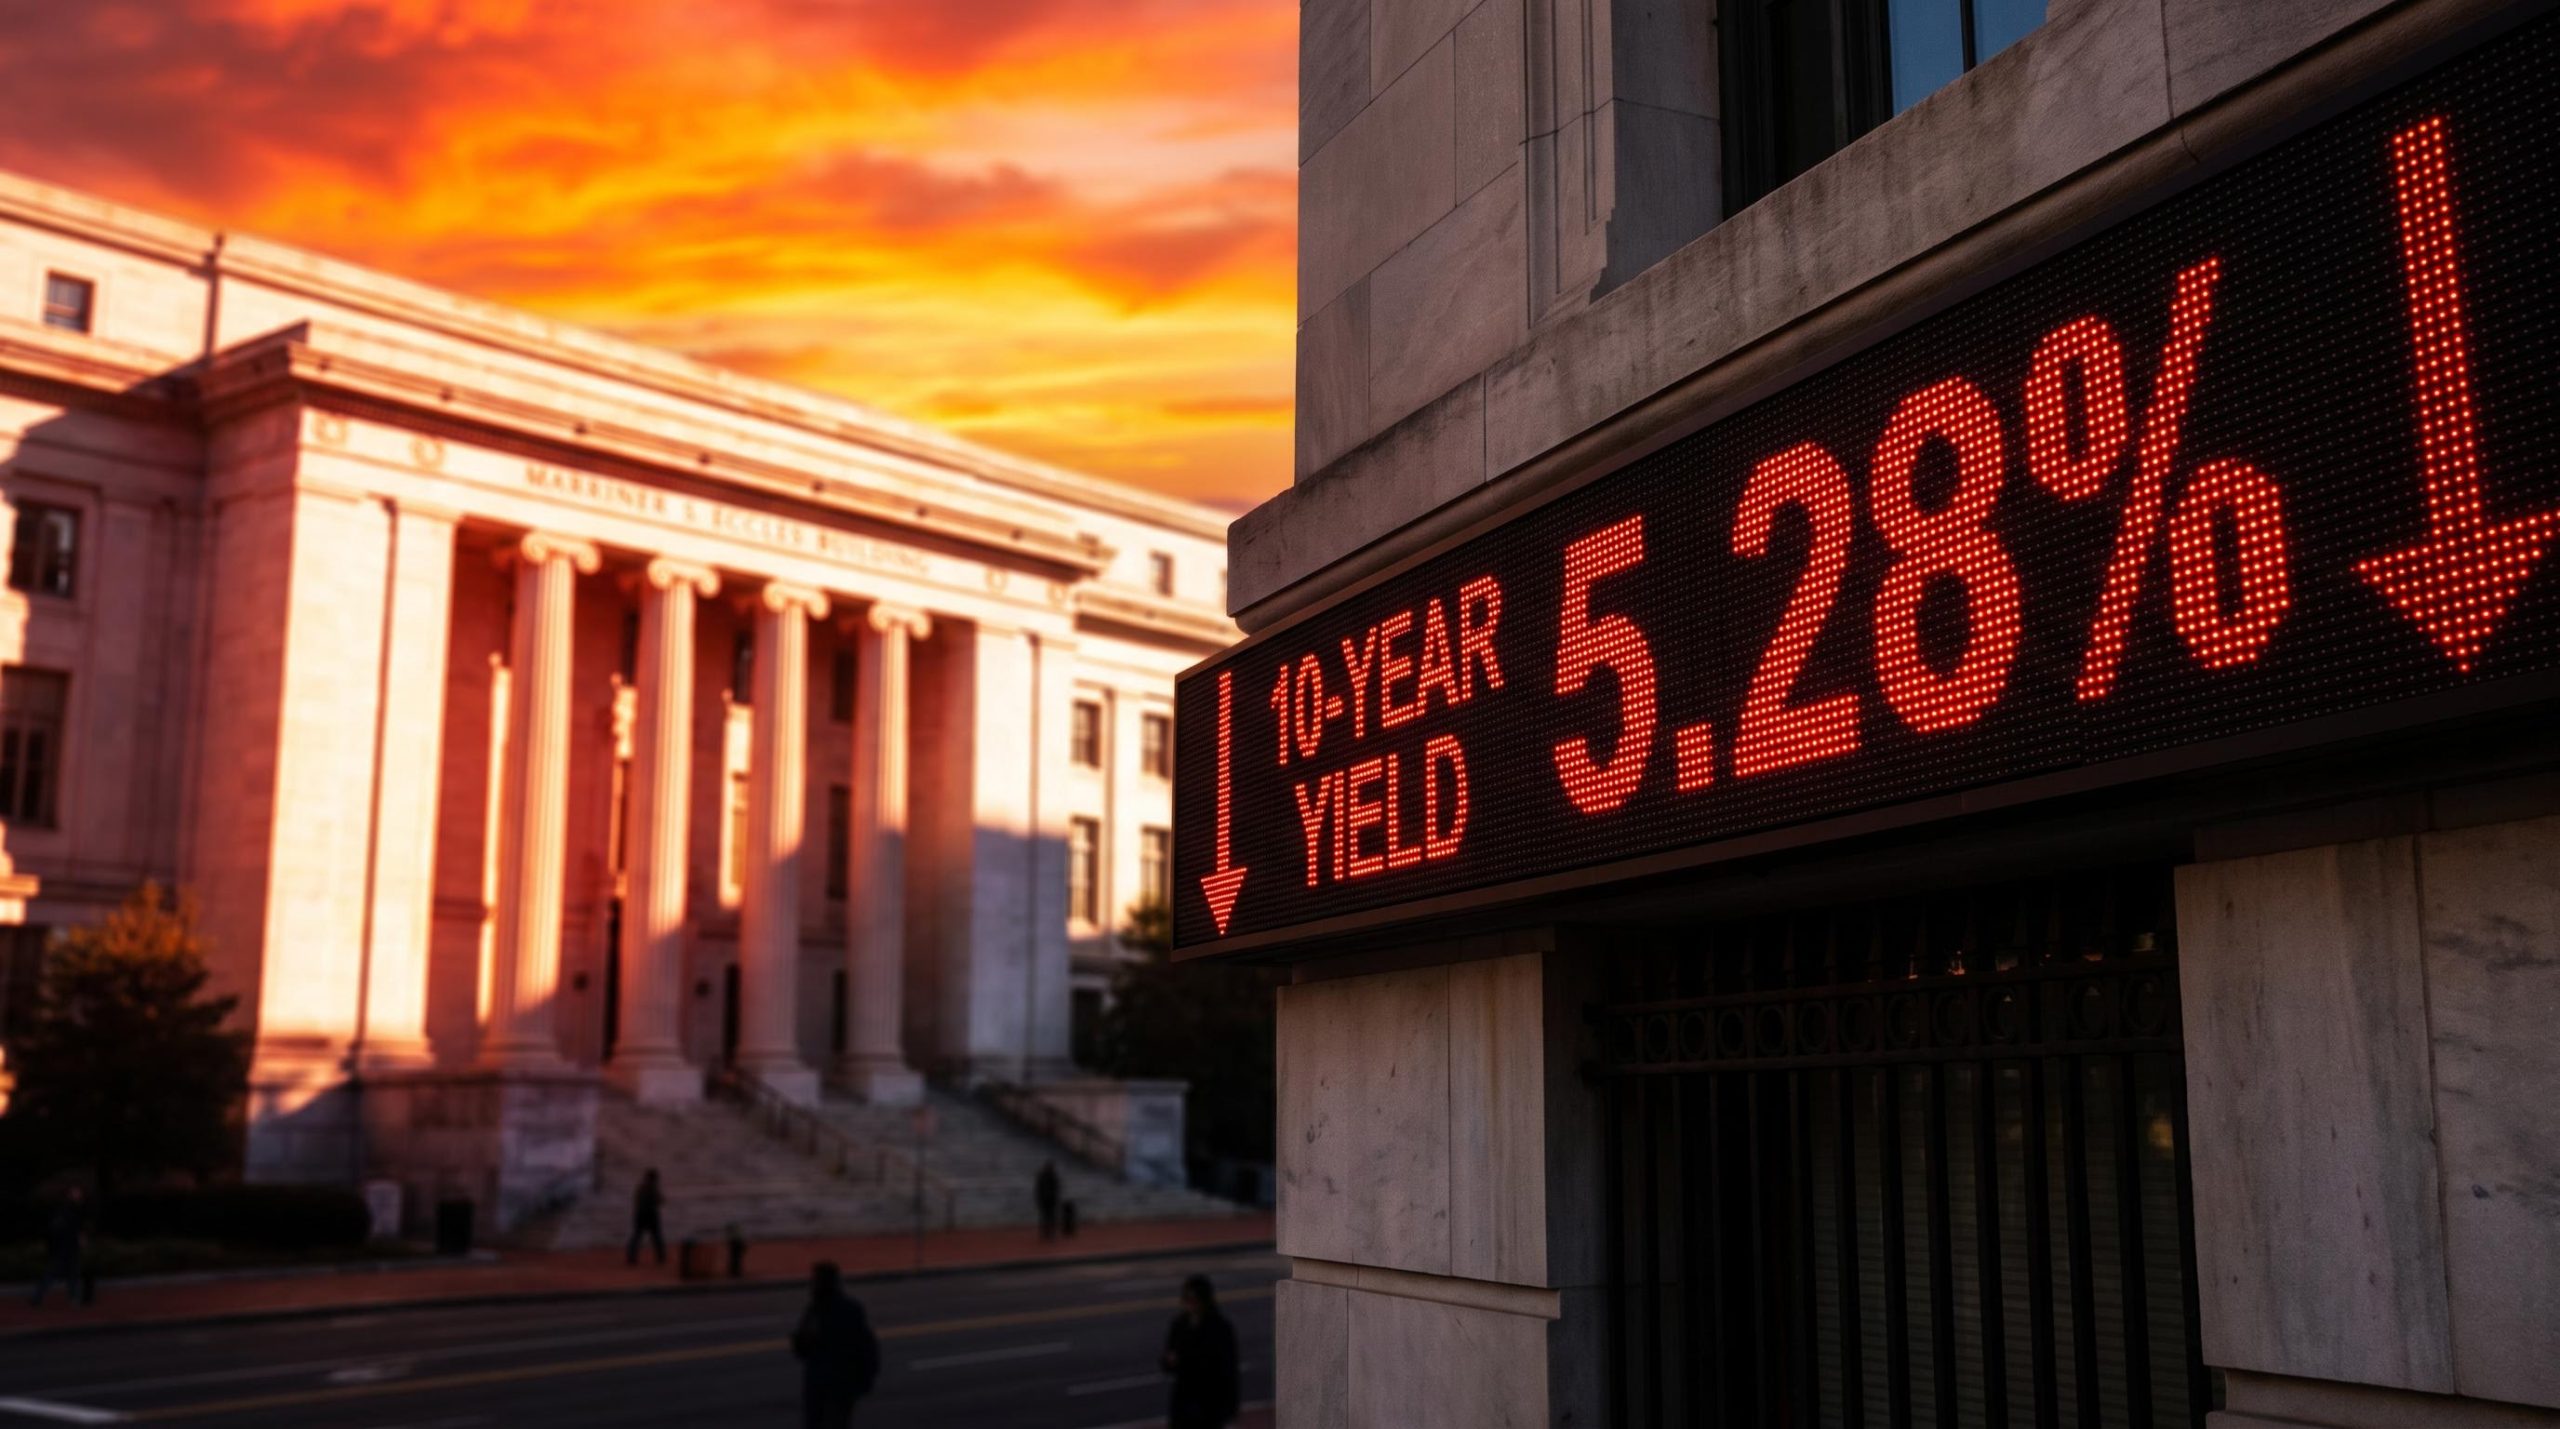
Most people assume regulators simply forgot to test what would happen if interest rates climbed. The real problem with the SVB stress test failure is stranger than that. The standard test imagined a recession in which bond yields fall, so the losses that sank Silicon Valley Bank (SVB) sat outside anything the test was designed to measure.
Governor Michelle Bowman has argued that a plausible rising-rate scenario would have shown SVB below minimum capital as early as Q4 2021. That was more than a year before the bank collapsed.
This still matters in October 2026. The effective federal funds rate sits around 3.88%, US banks still carry hundreds of billions of dollars in unrealised securities losses, and the Supreme Court’s Loper Bright ruling is changing how stress tests can evolve.
Here is why the test missed the risk, why banks usually profit when rates rise, and how you can judge a bank’s own rate exposure from its public filings.
Why did the Fed’s stress tests assume falling yields?
The design made sense when it was built. After 2008, every serious downturn brought the same response: central banks cut rates hard. So the Federal Reserve’s severely adverse scenario pairs a sharp rise in unemployment, falling asset prices and wider credit spreads with short-term Treasury rates dropping several percentage points to near zero.
That pairing follows the “severe yet plausible” standard. In a global recession, investors flee to safety, yields fall, and the bonds banks hold become more valuable. Under that logic, an inflation shock with climbing rates was never the central case.
With yields back near pre-QE norms, the low-rate world that shaped the original stress test design looks more like the exception than the rule, which strengthens the case for testing rising-rate paths.
The Fed also had a legal reason to keep this scenario at the centre. Under Dodd-Frank, the severely adverse result gives the Fed leverage to restrict a bank’s dividends and buybacks.
Rate risk, in this world, looked like a margin problem. If rates stayed low, banks would earn thinner profits on lending. Nobody built the core test around large mark-to-market losses, meaning the drop in a bond’s current market value when rates rise.
The Bowman finding Governor Michelle Bowman said a plausible scenario with rising rates and fair-value treatment of securities would have shown SVB below minimum capital as early as Q4 2021.
There were partial exceptions. The global market shock, applied to banks with large trading operations, imposes instant moves in rates, spreads, equities and currencies, and has included yield-rise shocks. According to commentary by Benjamin Chabot, exploratory scenarios in 2023 and 2024 also allowed rates to rise. The Fed’s formal exploratory analysis with rising rates and rapid deposit repricing arrived in 2024.
| Feature | Traditional severely adverse scenario | 2024 exploratory funding-stress scenarios |
|---|---|---|
| Rates direction | Short-term rates fall to near zero | Rates rise |
| Inflation | Falling | High and persistent, or increasing |
| Deposit behaviour | Not a central stress | Rapid repricing of a large share of deposits |
| Purpose | Capital planning and leverage over dividends and buybacks | Explore rate and funding risks; aggregate results only |
The takeaway for you is that a “pass” answers a narrow question. It tells you a bank can survive a falling-rate recession. It tells you nothing about the opposite shock.
When big ASX news breaks, our subscribers know first
What actually sank SVB, and why did the tests not see it?
No single weakness killed SVB. Three of them interacted.
First, the bank held large amounts of long-duration Treasuries and mortgage-backed securities (MBS) classed as held-to-maturity (HTM). HTM securities are bonds a bank intends to keep until they mature, so their unrealised losses did not fully show up in pre-2023 capital metrics. Second, its funding came from concentrated, uninsured technology-sector deposits, with uninsured deposits above 90% of the total at failure. Third, it had limited interest-rate hedging.
Duration risk is the arithmetic behind SVB’s losses: the longer a bond’s maturity, the more its market value drops for each point yields rise, so you can see why long-dated holdings were so exposed.
Here is how those ingredients combined:
- Rates rose quickly through 2022.
- The market value of SVB’s long-dated bonds fell, creating large unrealised losses.
- Those losses became visible to depositors, many of them sophisticated tech firms and venture funds.
- Uninsured depositors moved their money, turning a rate problem into a liquidity problem.
- SVB failed in March 2023.
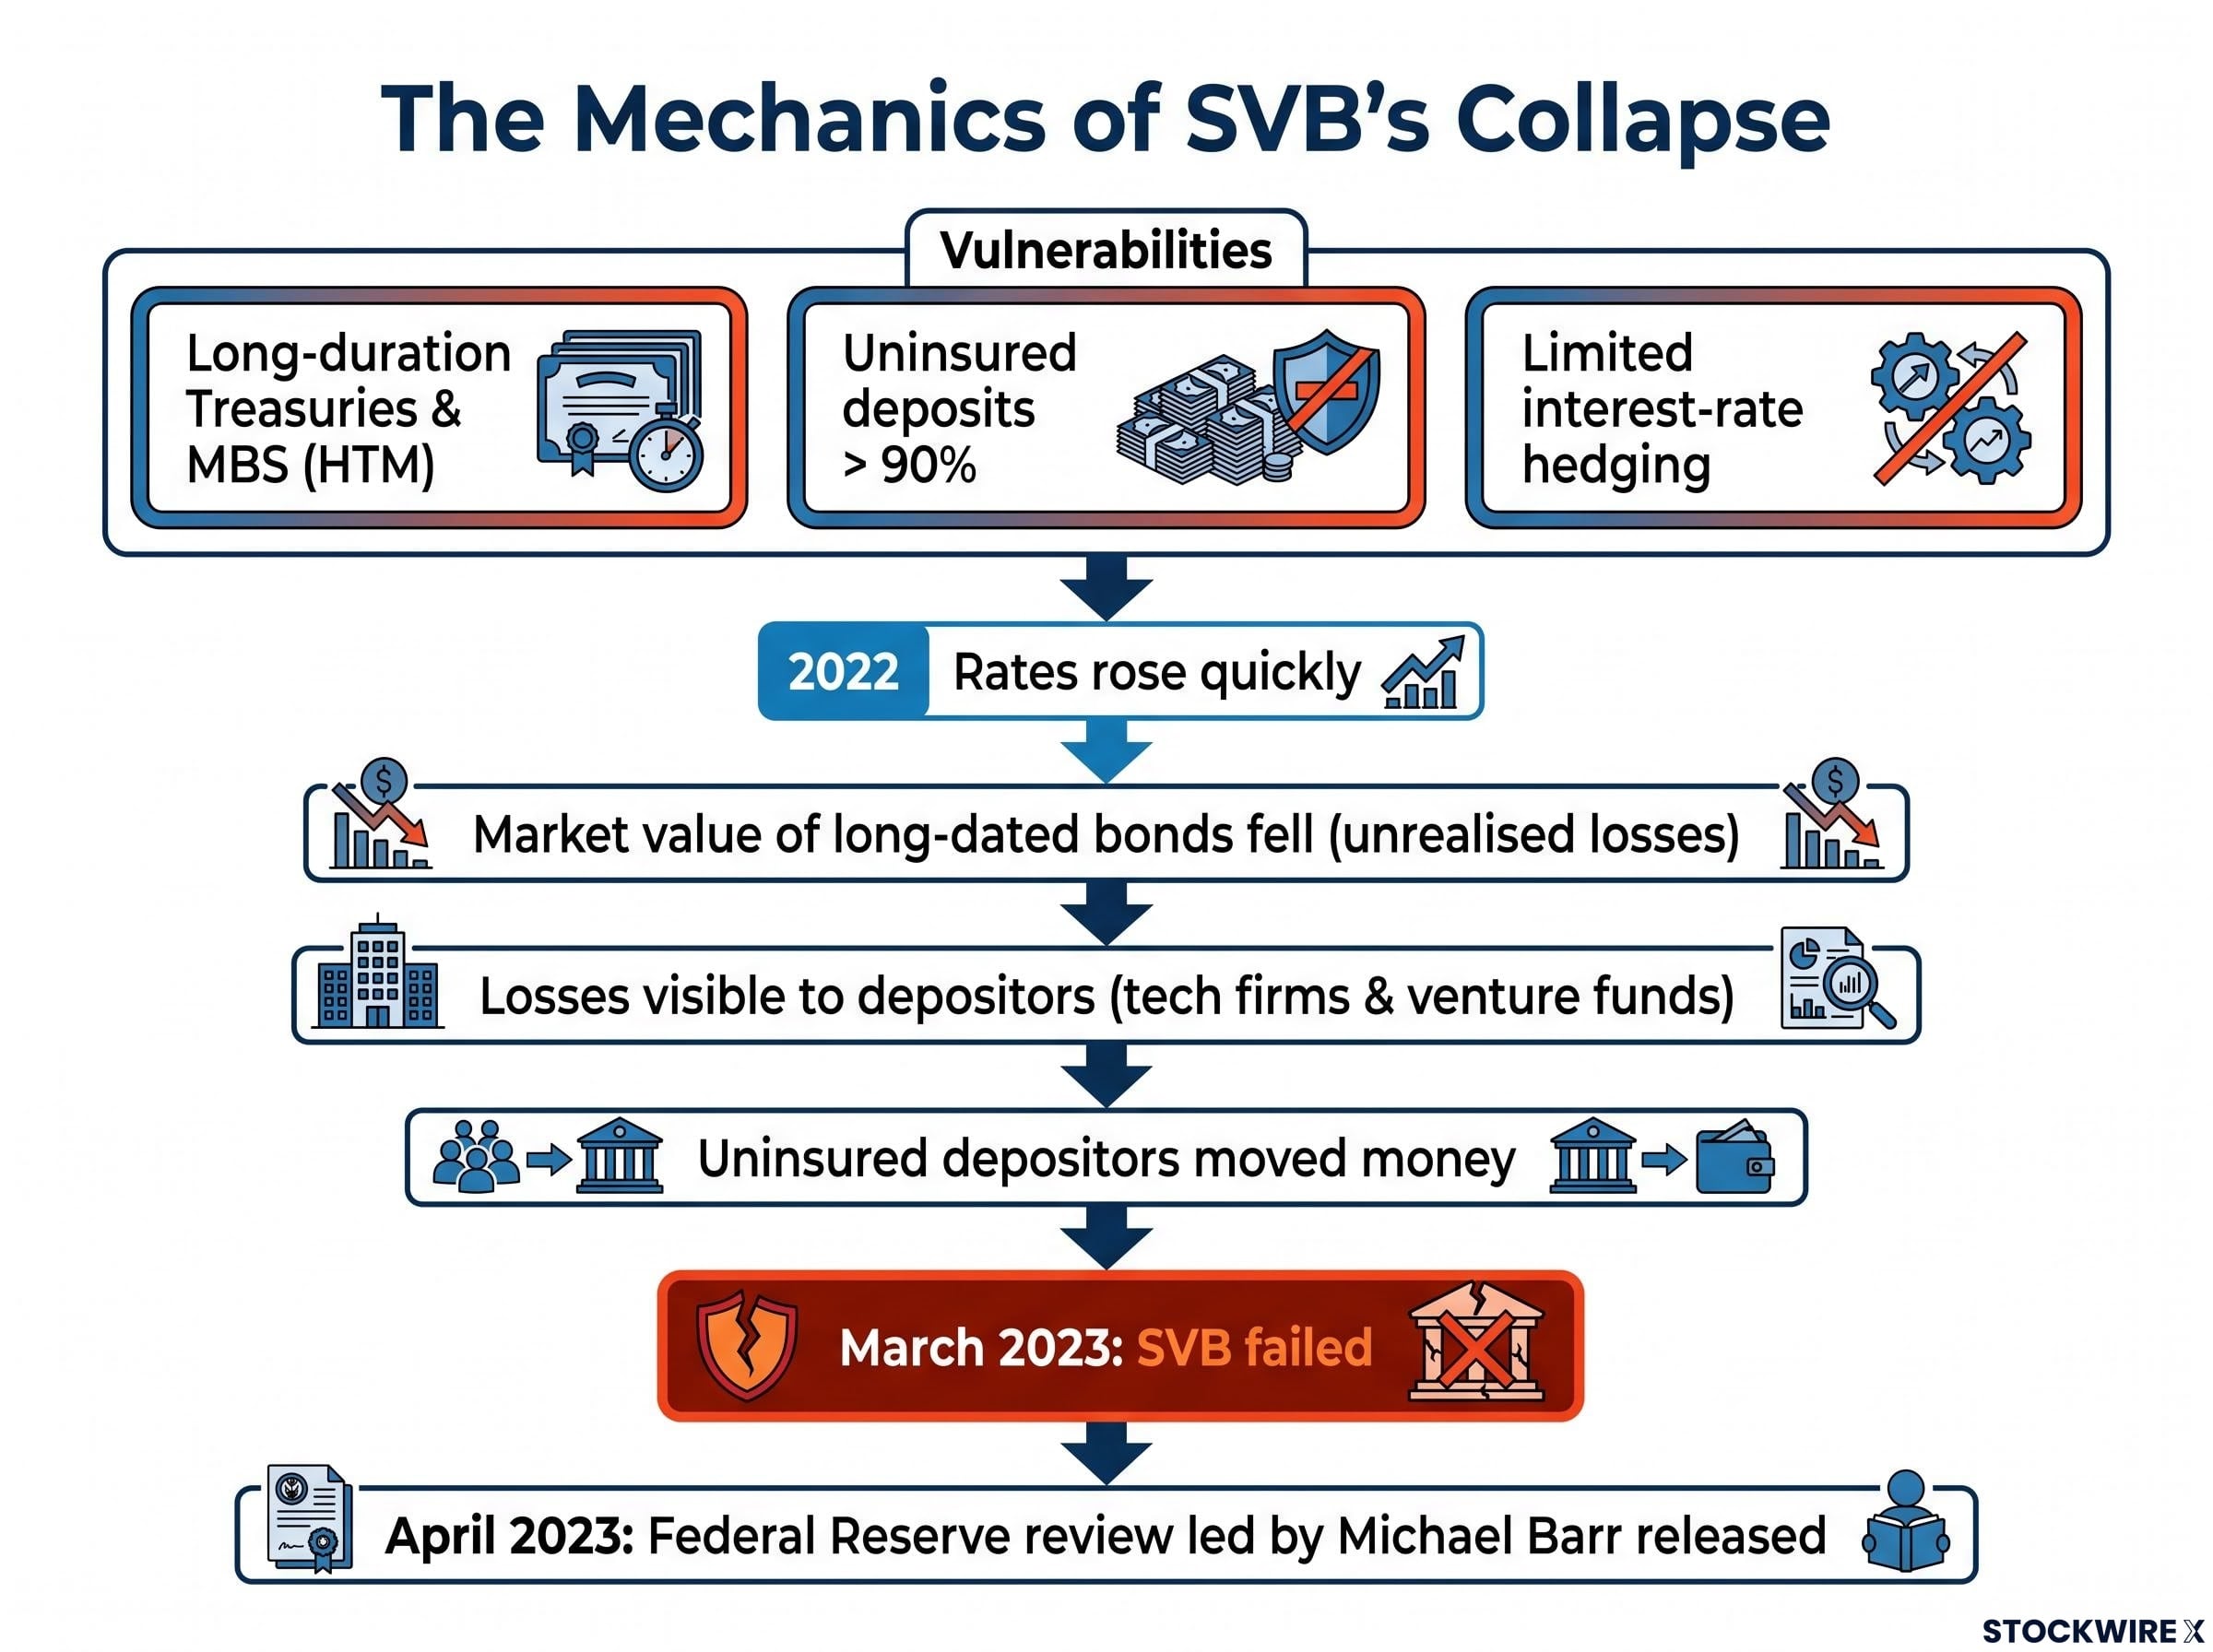
The Federal Reserve’s review, led by Vice Chair for Supervision Michael Barr and released in April 2023, pointed to insufficient hedging and to the way rate risk fed liquidity risk. The pattern echoes the 1980s savings and loan crisis, when thrifts funded long fixed-rate mortgages with short-term deposits and were crushed when rates jumped.
What should stick with you is that this risk sat in plain sight on the balance sheet. Duration, deposit mix and hedging are all things you can check in a bank’s filings today.
Was SVB an outlier?
One camp says yes. Chabot argued that SVB’s failure did not shock other large banks, and this view points to its unusually high uninsured share, single-industry concentration and large unhedged HTM positions.
The other camp points out that many mid-sized banks carried significant unrealised losses and sizeable uninsured deposits in 2022-2023. That suggests a broader weakness the standard tests did not fully catch.
One caution applies to both sides. The claim that banks generally hedge well could not be verified, because current hedging positions were not confirmed.
Why do banks usually earn more when rates rise?
Here is the counterintuitive part: rising rates normally help banks. SVB was the exception.
The reason is timing. Many loans carry floating rates, so the interest a bank earns resets quickly. The interest it pays depositors tends to lag.
Deposit beta Deposit beta is the share of a change in market interest rates that a bank passes on to its depositors.
Chabot notes that deposit rates have historically risen by only about two to three tenths of short-rate increases. A simple example: if short-term rates rise by 1 percentage point and a bank’s deposit beta is 30%, its loan income on floating-rate loans climbs by roughly the full point while its deposit costs rise by just 0.3 points. The gap is extra profit.
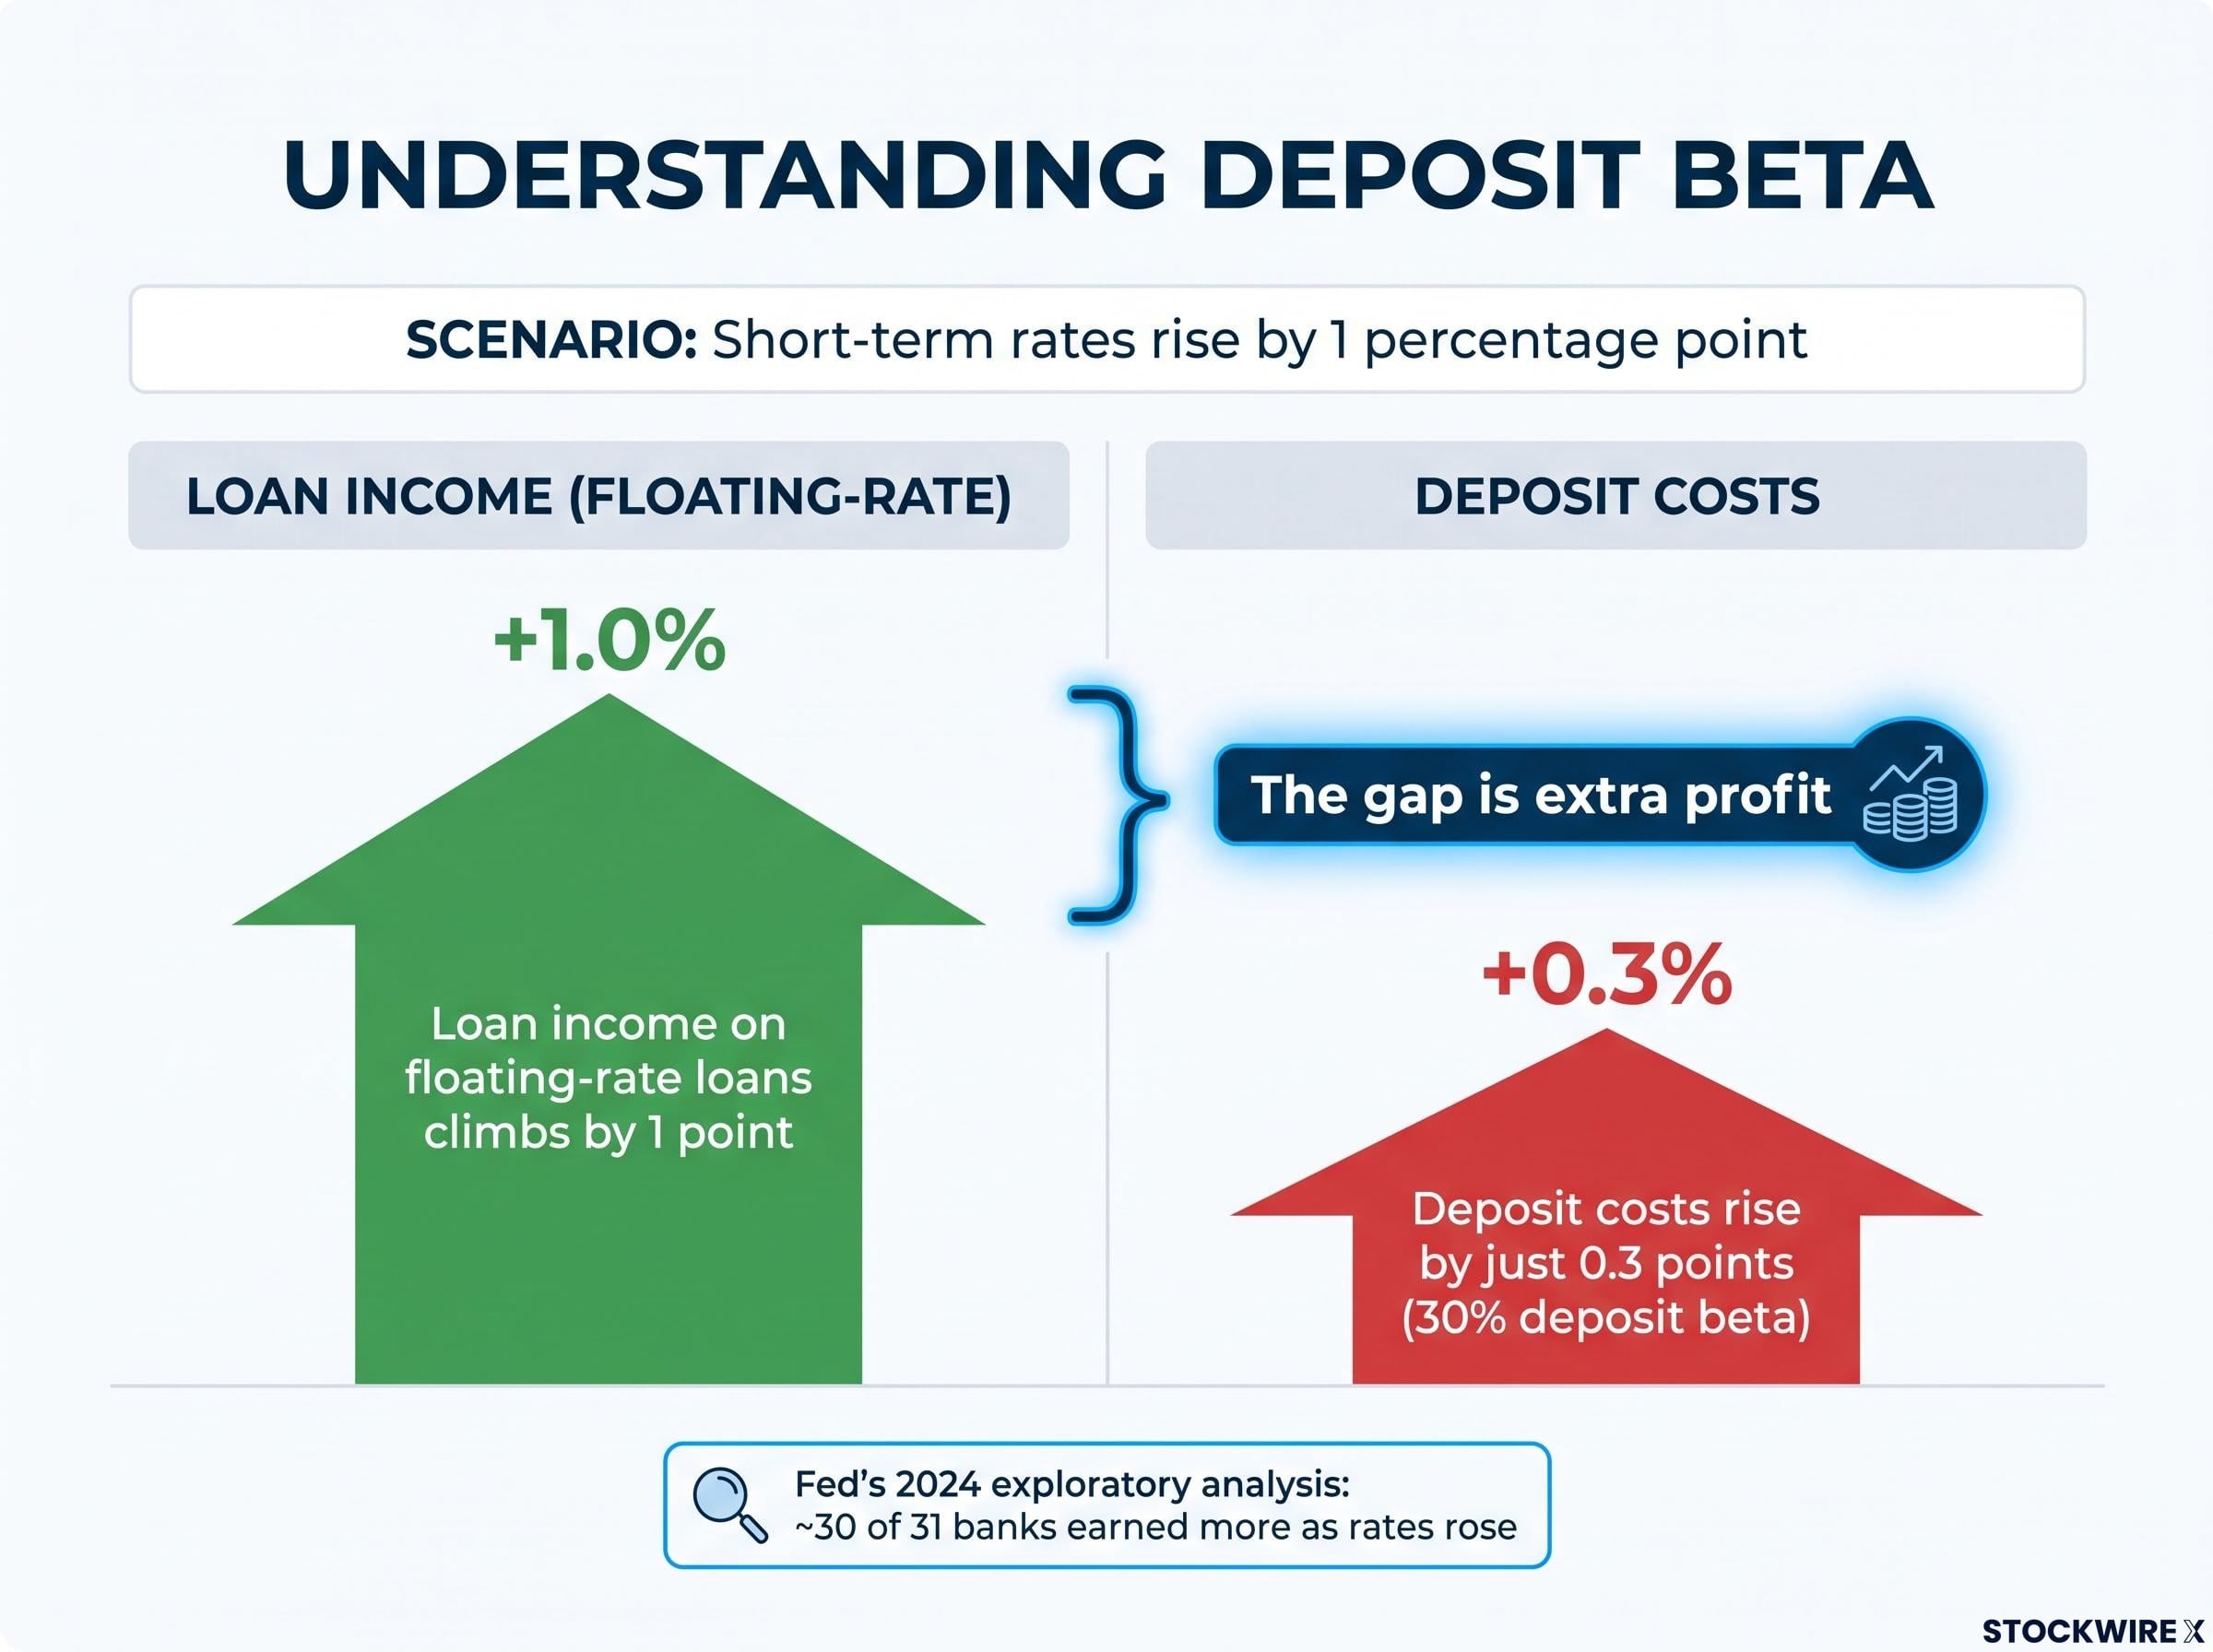
Research on recent cycles puts system-wide betas often at or below 50%, with community banks showing a median around 34% in the 2022-2023 tightening cycle. A 30-50% range is commonly cited for community banks when rates decline. Lower betas protect net interest margin, the gap between what a bank earns on assets and pays on funding; higher betas signal pressure.
The Fed’s 2024 exploratory analysis fits this picture. Aggregate common equity tier 1 (CET1) capital, the highest-quality capital a bank holds, fell about 2.7 points to a minimum of 10.0% in the severe scenario and 1.1 points to 11.6% in the milder one. Large banks stayed above minimums in aggregate. Chabot reports that about 30 of 31 banks earned more as rates rose, though the Fed publishes only aggregate results, so that count could not be confirmed.
Whether rising rates help or hurt depends on conditions like these:
- Helps: floating-rate loans, sticky retail deposits, low deposit beta, a normal upward-sloping yield curve
- Hurts: long-duration fixed-rate assets, mobile or uninsured deposits, high deposit beta, an inverted yield curve where short rates exceed long rates
With the effective fed funds rate near 3.88% and SOFR around 3.90% in early October 2026, the variable to watch is not rate direction. It is a bank’s deposit beta and funding mix, which decide whether rates work for you as a depositor or shareholder, or against you.
Oil-driven inflation is one route back to the rising-rate scenario the old tests ignored, and an energy shock that forces the Fed to resume hikes would put unhedged duration under pressure again.
Will Loper Bright make stress tests more transparent, or just slower?
The case for more openness is attractive. In June 2024, the Supreme Court’s ruling in Loper Bright Enterprises v. Raimondo sharply limited Chevron deference, the old practice of courts deferring to an agency’s reading of an unclear law.
For the Fed, that likely means stronger legal grounding, fuller records and notice-and-comment processes, where the public can respond before a rule is finalised, for significant model or scenario changes. Clearer models invite accountability, curb arbitrary supervisory discretion, and, as Chabot suggests, could improve through academic feedback.
The trade-offs are real, though.
If every parameter is public, banks may tune portfolios and hedges to the published scenario and converge on the same approach. A single model error could then become systemic. Formal rulemaking also takes time, which may slow responses to risks such as rate-sensitive deposit flight and stress in office and multifamily property.
| Effect | Upside | Downside | Systemic implication |
|---|---|---|---|
| Published models and scenarios | Accountability and public scrutiny | Banks optimise to the test | Model monoculture |
| Notice and comment | Less arbitrary discretion | Slower updates | Emerging risks captured later |
| Fuller administrative records | More legally durable rules | Less nimble supervision | Greater reliance on exploratory analyses and targeted reviews |
The picture is incomplete. Effects were still unfolding in 2026, no 2025 or later stress test results or exploratory analyses appeared in the research reviewed, the 2027 scenarios have not been released, and the status of proposed 2026-2027 transparency changes could not be established.
For you, this means future results may be more legally solid but slower to reflect new risks. That puts more weight on a bank’s own disclosures.
How can you evaluate a bank’s interest-rate risk?
You can run these five checks against a bank’s latest filing:
- AOCI relative to CET1. Accumulated other comprehensive income (AOCI) records unrealised gains and losses on certain securities. Warning sign: losses that are large relative to CET1, as at SVB, can erode capital in a forced sale even when regulatory rules exclude them.
- Duration gap. This compares how long a bank’s assets take to reprice against its liabilities. Warning sign: long-dated bonds funded by short-term or rate-sensitive deposits.
- Deposit structure. Warning sign: a high uninsured share, concentration in one sector, and easy digital withdrawals.
- Hedging and IRRBB governance. Interest rate risk in the banking book (IRRBB) covers how rate moves affect non-trading assets. Warning sign: thin use of swaps or options, and scenarios that rarely combine rising rates with funding stress.
- Scenario sensitivity. Warning sign: disclosures that ignore curve inversion or assume low deposit betas and minimal outflows.
For calibration, regulatory data cited by Chabot showed over 99% of banks well capitalised as of Q2 2025, largely by construction, since undercapitalised banks must raise capital or merge. Unrealised losses tell a more useful story.
| Quarter | Total unrealised losses | Change |
|---|---|---|
| Q3 2024 | $364B | Down $149B (29%) |
| Q4 2025 | $306.1B | Down $31.0B (9.2%), lowest since Q1 2022 |
| Q1 2026 | $325.1B | Up $19.0B (6.2%) |
The Q1 2026 figure comes from an FDIC speech summarising its Quarterly Banking Profile; the profile document itself cites a different, much smaller securities figure that may reflect another measure. Chabot flags a steep yield-curve inversion as the main risk now, with regulators monitoring property and liquidity risks into 2026.
The core read is simple. Large unrealised losses relative to CET1, paired with concentrated uninsured deposits, signal SVB-style exposure whatever the capital ratio says.
Investors exploring how hedging works in practice can read our dedicated guide to interest rate options for bond portfolios, which shows how long rate options can offset embedded volatility exposure.
What the stress test lesson changes, and what it leaves open
SVB slipped through because of scenario design, not lack of effort. The test asked whether banks could survive a falling-rate recession, and SVB’s risk lived in the opposite scenario. Rising rates and funding stress are now part of supervisory thinking, even if formal changes move slowly after Loper Bright.
Three things deserve your attention next: the release of the 2027 scenarios, any notice-and-comment changes to models, and the next FDIC Quarterly Banking Profile.
Until then, the decision sits with you. Judge a bank by its balance sheet structure and deposit behaviour, not by a stress test pass alone.
Past performance does not guarantee future results. Projections and scenario outcomes are subject to market conditions and various risk factors, and forward-looking statements are speculative and may change.
This article is for informational purposes only and should not be considered financial advice. Investors should conduct their own research and consult with financial professionals before making investment decisions.