
Most investors treat government bonds as the safe side of their portfolio. In 2026, that assumption is being tested in ways the 2022 selloff only previewed: sovereign bonds are losing capital faster than equities as yields climb, and the mechanics behind that reversal are not widely understood.
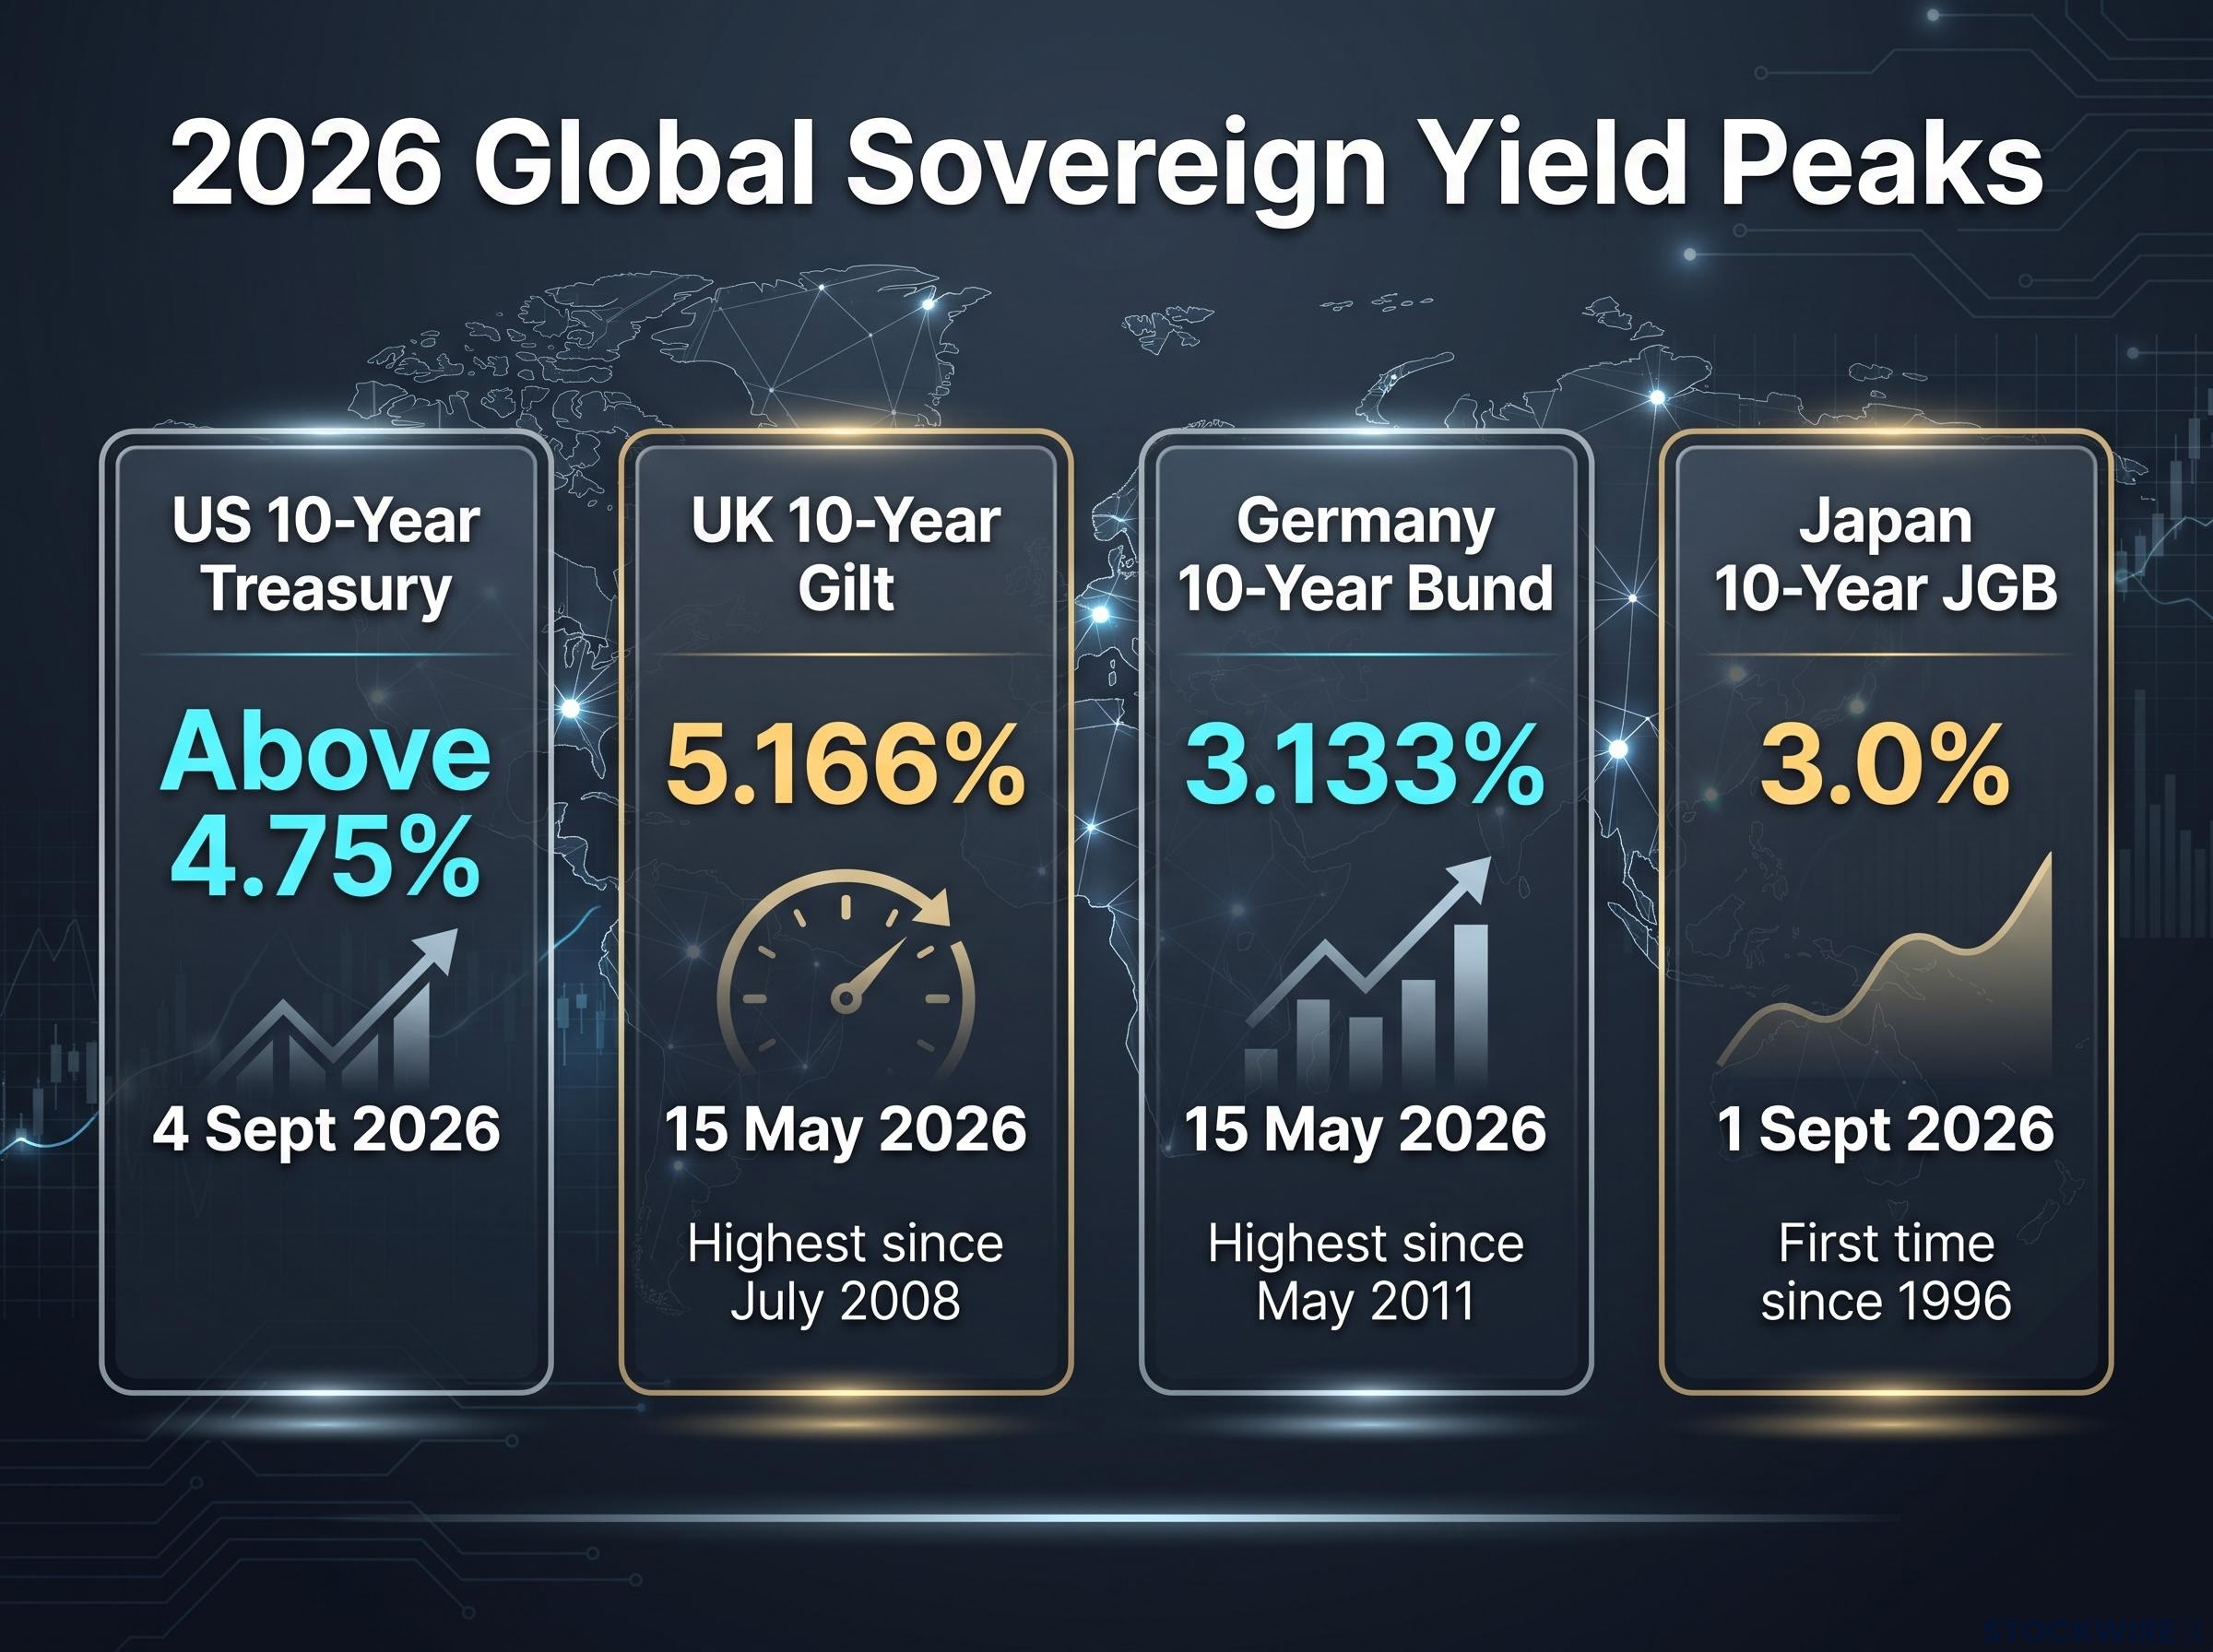
The numbers are not marginal. The US 10-year Treasury spiked above 4.75% in early September 2026, UK gilt yields touched 5.166% in May (the highest since 2008), German Bund yields reached levels unseen since 2011, and the Japanese 10-year JGB touched 3.0% for the first time since 1996. This is a repricing of the relationship between duration, safety, and capital preservation that many investors have never had to navigate.
Understanding how bonds behave versus stocks under rising yields starts with the mechanics. This piece gives you a framework for why bonds fall the way they do, what current flow data reveals about how institutional investors are actually repositioning, and where the strategic risks sit if you respond by abandoning sovereign debt entirely. The goal is not to predict where yields go next. It is to make the mechanics clear enough that you can make a considered call about your own exposure.
Why rising yields destroy bond prices faster than most investors expect
Here is the result that surprises people first: when yields rise, long-dated government bonds can lose more capital than equities over the same window. The “safe” asset falls harder than the “risky” one. To understand why, you have to start with the single most important relationship in fixed income.
Bond prices and yields move in opposite directions. When market yields rise, the fixed interest payments on an existing bond become less attractive than what a newly issued bond offers, so the price of the older bond has to fall until its effective yield matches the market. That is the inverse price-yield relationship, and it is mechanical, not sentiment-driven.
The amplifying variable is duration. Duration measures how sensitive a bond’s price is to a change in yield, and it rises with the time until the bond matures. The longer you have to wait to get your money back, the more a shift in yields reprices the value of those distant payments today.
Bond duration is the single number that translates a yield move into a dollar loss on your portfolio, and the 2022 experience made its consequences concrete: the Bloomberg US Aggregate Bond Index fell 13.0% that year while long-dated zero-coupon Treasuries dropped 39.2%, the worst outcome for long-duration US bonds since 1754.
As a rough guide, the percentage price change of a bond for a small yield move is approximately its duration divided by one plus the yield, multiplied by the change in yield. Applied to a long-dated bond, the outcome is stark.
A 100-basis-point rise in yields produces roughly a 24-26% capital loss on a 30-year zero-coupon bond. That is a double-digit drawdown from a single percentage-point move in what is supposed to be the defensive part of a portfolio.
Long-maturity sovereigns are the most exposed for two reasons: they carry high duration, and they often carry low coupons relative to today’s yields, which leaves no meaningful income cushion to offset the price fall. For context, here is where major benchmark yields sit:
- United States: 10-year Treasury above 4.75% on 4 September 2026, the first time since January, as global borrowing costs climbed.
- United Kingdom: 10-year gilt at 5.166% on 15 May 2026, the highest since July 2008.
- Germany: 10-year Bund at 3.133% on 15 May 2026, the highest since May 2011.
- Japan: 10-year JGB at 3.0% on 1 September 2026, the first time since 1996.
If you hold long-dated government bonds and yields are rising, you are not in the safe part of your portfolio. You are in the part that loses capital most predictably and most mechanically of all.
How equities absorb yield pressure differently
Equities are not contractually fixed cash flows. A share is a claim on a company’s future earnings, and those earnings can grow with nominal GDP and inflation, which gives equities a natural partial hedge that a fixed coupon simply cannot offer.
Sectors with structural growth narratives illustrate the point. Technology is the clearest current example: earnings expectations there can move on adoption and product cycles largely independent of yield dynamics.
This does not make equities immune to rising yields. Higher yields raise the discount rate applied to future earnings and can compress valuations. But the transmission is indirect and variable, not the direct arithmetic that governs a bond’s price.
When big ASX news breaks, our subscribers know first
What the flow data actually shows about investor behaviour right now
The headline narrative is that investors are fleeing bonds. The flow data tells a more precise story, and reading it correctly changes how you interpret your own positioning.
Start with BNY’s iFlow Mood indicator. It measures the spread between marginal equity flows and flows into short-dated core sovereign bonds, so a falling reading signals investors leaning away from equities and toward safety at the short end of the curve. On 2 September 2026, BNY’s Market Movers note reported an iFlow Mood of negative 0.112, which sits in the neutral zone.
An iFlow Mood of negative 0.112 in the neutral zone means renewed geopolitical uncertainty trimmed equity positioning only modestly, while demand for core sovereign bonds stayed firm. This is not panic. It is a measured tilt.
That reading marks a shift from earlier in 2026, when equity selling picked up while flows into core sovereigns held steady. The picture is not static, and the ETF data underneath it reveals the real pattern: a barbell.
| Timeframe | Asset Category | Flow Direction | Volume | Source |
|---|---|---|---|---|
| May 2026 | Taxable bond ETFs (all) | Inflow (record month) | $53.4B | Morningstar |
| May 2026 | Long govt & EM bond ETFs | Outflow | Shedding assets | Morningstar |
| Aug 2026 | iShares TLT (20+yr Treasury) | Inflow | $5.3B | Morningstar |
| Aug 2026 | Ultrashort bond ETFs | Inflow | $12.2B | Morningstar |
| Apr 2025 | Short-term govt bond funds | Inflow | $18B | Reuters/LSEG Lipper |
Look at the shape. In May 2026, taxable bond ETFs pulled in a record $53.4 billion, yet long government bond ETFs and emerging-market bond ETFs were the two categories shedding assets. Money was moving into fixed income, just not into the long end.
The barbell sharpened in August 2026: iShares TLT, the 20-plus-year Treasury fund, took in $5.3 billion and returned to positive net flows for the year, while ultrashort bond ETFs added $12.2 billion in the same month. Investors are holding both ends and hollowing out the middle.
The 2025 comparison confirms the instinct. In the week to 9 April 2025, US bond funds saw $15.0 billion of outflows, the largest since late 2022, while short-term government bond funds attracted $18 billion that month.
The barbell pattern tells you that sophisticated investors are not abandoning sovereign bonds altogether. They are shortening duration aggressively, which is a fundamentally different signal than a simple risk-on rotation into equities. Read your own holdings through that lens: the question is less “bonds or not” and more “where on the curve.”
Two crises that show what duration risk looks like when it breaks
The duration argument stays abstract until you attach it to named events with real losses. Two episodes from 2022, plus one live development now, make the mechanics concrete.
Take them in order:
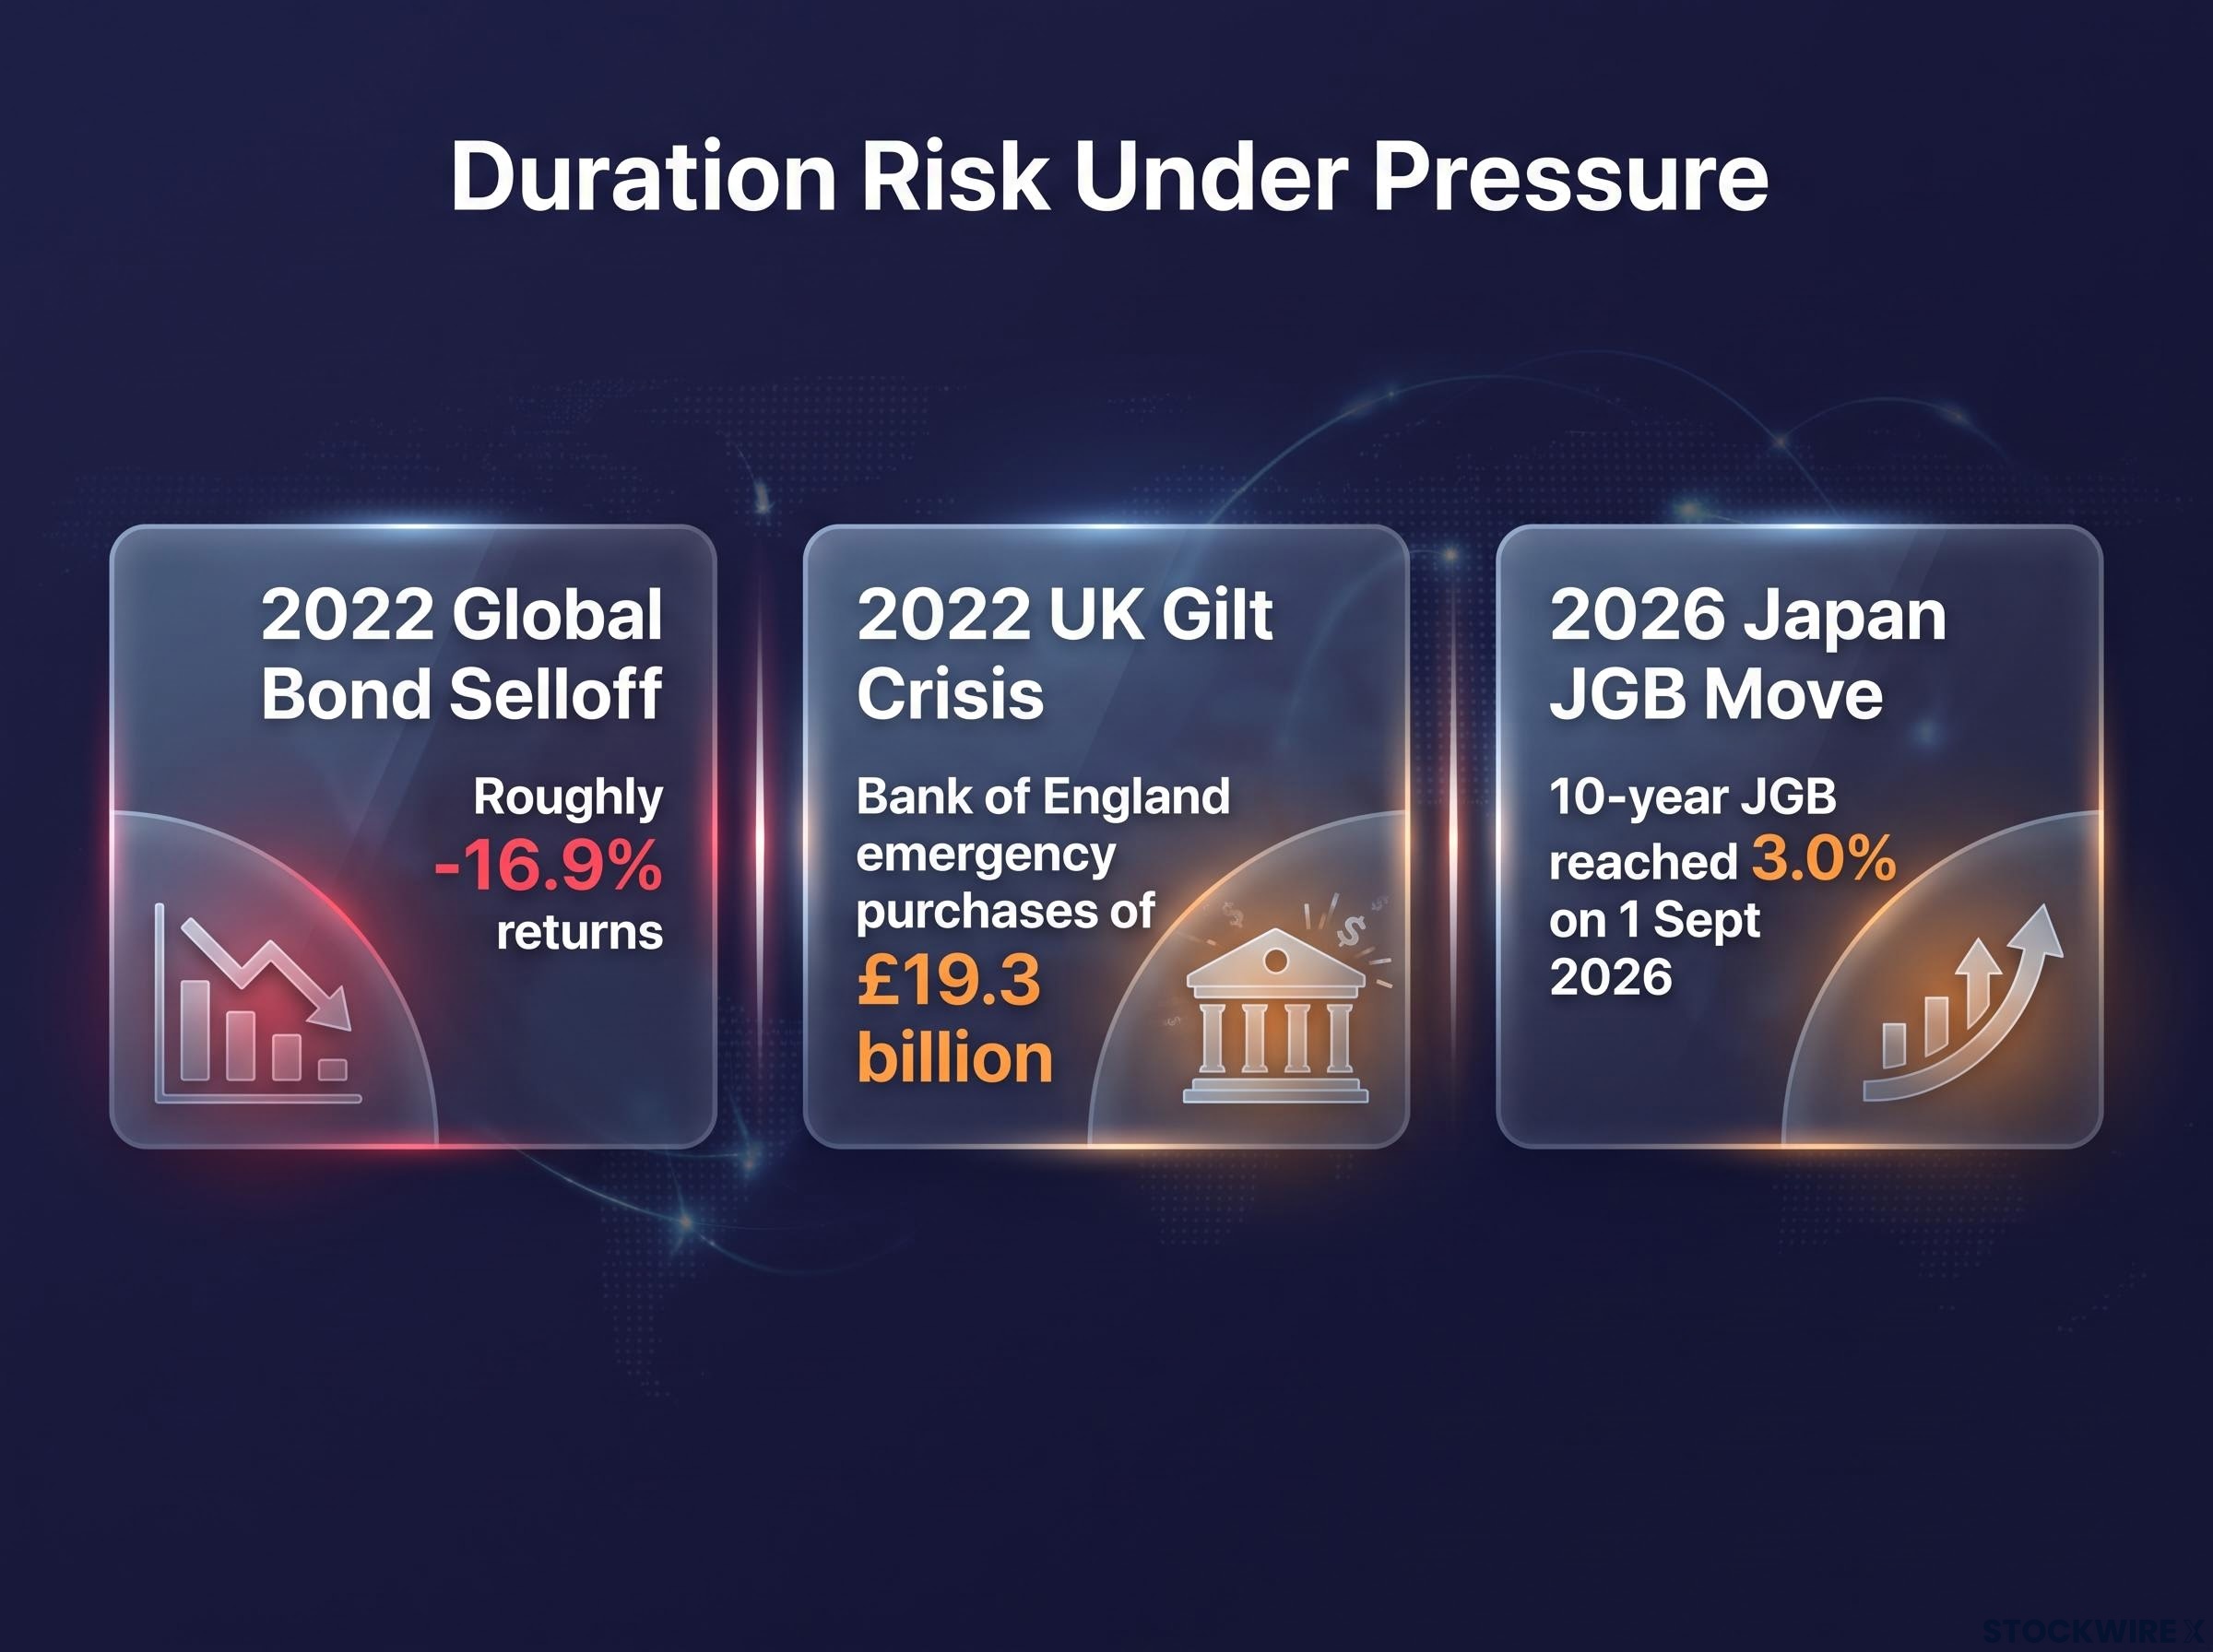
- 2022 global bond selloff: As central banks tightened aggressively, global bond indices recorded roughly negative 16.9% returns, the largest single-year drawdown in modern fixed-income history.
- 2022 UK gilt crisis: Leveraged pension strategies were forced to dump long-dated gilts after a yield spike, prompting the Bank of England to purchase £19.3 billion in gilts to stabilise the market.
- 2026 Japan JGB move: The 10-year JGB reached 3.0% on 1 September 2026, its highest since 1996, as yield-curve control unwinds.
The 2022 selloff is the baseline lesson. That negative 16.9% year demonstrated that duration risk had been systematically underpriced during the low-yield era. When yields sit near zero, the price sensitivity that duration measures feels theoretical. When yields normalise, it arrives all at once.
The UK gilt crisis showed what happens when that risk meets leverage. Liability-driven investment (LDI) strategies, which pension funds use to match long-term liabilities, held long-dated and index-linked gilts on borrowed money. When the “mini-budget” sent yields spiking, those funds faced collateral calls and were forced to sell the very bonds that were falling, accelerating the decline until the Bank of England intervened with £19.3 billion in emergency purchases.
The UK gilt crisis revealed a structural vulnerability specific to leveraged pension strategies: liability-driven investment funds held long-dated gilts on borrowed money, and when collateral calls arrived, they were forced to sell the very bonds that were falling, a feedback loop that required Bank of England emergency intervention to break.
The connecting observation matters more than either episode alone. The gilt crisis is not really a story about pension funds. It is a demonstration of what duration mismatch plus leverage produces under yield pressure, and any leveraged investor holding long-dated sovereigns faces the same structural vulnerability. Reporting since suggests the LDI sector has strengthened its liquidity buffers and governance, though that resilience has not been fully stress-tested at current yield levels.
Japan’s yield-curve unwind as the live global test case
Japan spent decades holding rates near zero and capping bond yields through yield-curve control, which made JGBs a cornerstone of global carry trades and a low-cost funding source for institutional portfolios worldwide.
The 10-year JGB at 3.0% on 1 September 2026 is not just a Japan story. It signals global repricing pressure, because yen-denominated investors reassessing domestic yields may pull capital back from foreign bond holdings, transmitting the move outward.
This is the same duration risk story you have already seen, playing out in real time rather than in a historical case file.
Shortening duration is not the same as abandoning bonds
The reflexive response to all of this is “sell all bonds.” The institutional response is more precise, and exiting sovereign debt entirely carries its own risks that are easy to underestimate when yields are climbing.
Start with what higher yields have restored. According to PIMCO, starting yields are now near two-decade highs, which brings back fixed income’s income function after years of near-zero payouts.
PIMCO frames current yields as approaching parity with equity earnings yields, meaning bonds now offer income competitive with equities for the first time in years. That makes a complete exit a timing risk, not just a positioning choice.
The diversification case reinforces the point. Vanguard’s analysis shows that bonds typically outperform cash in the one- and three-year periods after central-bank hiking cycles end, which means de-risking too far leaves you under-allocated if the cycle turns. BlackRock’s own positioning reflects this nuance: strategically underweight long-dated US Treasuries, but favouring shorter-maturity bonds and spread sectors rather than a full sovereign exit.
Whether high yields persist is genuinely contested. The structural higher-for-longer case, as BlackRock frames it, points to forces that keep yields elevated:
- Aging workforces reshaping savings and spending patterns.
- High public debt requiring larger issuance and higher term premia.
- De-globalisation raising costs and reducing disinflationary pressure.
- Supply-side constraints keeping inflation stickier than the pre-2010 era.
The cyclical counter-argument runs the other way. IMF research finds the long-run neutral rate (r-star), the interest rate that neither stimulates nor restrains the economy, has fallen since the 1980s and remains structurally low, which suggests today’s high yields may partly reflect post-pandemic imbalances rather than a permanent new normal.
The institutional consensus is not to exit but to restructure duration: shorten maturity, tilt toward spread sectors, and preserve optionality for when the cycle eventually turns. Your tactical move, in other words, is likely more surgical than wholesale. Three questions turn that into action:
A bond ladder spread across 1-10 year maturities is the most broadly recommended structural response to elevated yields, capturing higher income at each maturity rung while removing the need to time rate moves correctly at any single point along the curve.
- Review the duration of any government bond holdings you own, since that is where the mechanical price risk concentrates.
- Assess whether any of your bond positions are leveraged, because leverage plus long duration is the specific combination that broke in 2022.
- Identify the yield level at which income return begins to offset capital loss, so you know what the bond is actually earning you from here.
This article is for informational purposes only and should not be considered financial advice. Investors should conduct their own research and consult with financial professionals before making investment decisions.
What the yield reset means for how you hold bonds from here
Pull the threads together and one insight sits at the centre. The bond-versus-equity risk hierarchy has inverted at the long end of the curve in a high-yield environment, and that inversion is structural until either fiscal pressures ease or rate cycles turn.
That reframes the decision entirely. The question is not “bonds or equities.” It is “which bonds, which duration, and at what entry point,” which is precisely the barbell answer the institutional flow data already revealed.
Fiscal dynamics make this concrete. Term premia research indicates that a one-percentage-point increase in projected 4-year-ahead fiscal deficits is associated with roughly 26-31 basis points of higher 5- and 10-year yields, which is why government spending trajectories now sit at the heart of the bond outlook.
Three variables to watch before adjusting your bond allocation
Rather than a point-in-time call that dates quickly, watch the three inputs that will determine whether the higher-for-longer regime extends or begins to reverse:
- Fiscal deficit trajectory: Track projected primary deficits in major economies. A credible move toward narrower deficits would ease term premia and pull yields lower.
- Pace of quantitative tightening: Watch how quickly central banks let maturing bonds roll off their balance sheets. A slower pace removes a persistent source of upward yield pressure.
- Speed of disinflation: Monitor inflation against current market pricing. Faster-than-expected disinflation would open the door to rate cuts and reward the longer-duration positions that are painful today.
The takeaway is not whether to hold bonds. It is whether your current bond exposure is positioned for the yield environment that actually exists in September 2026, not the one that existed before 2022.
Investors wanting step-by-step implementation advice will find our dedicated guide to bond portfolio management in 2026, which covers how to calculate your current duration exposure, evaluate short-duration ETFs versus floating-rate notes, and apply the 1-5 year curve positioning that BlackRock, PIMCO, and Vanguard all favour.
Past performance does not guarantee future results. Financial projections are subject to market conditions and various risk factors, and forward-looking scenarios are speculative and subject to change.