
Here is an uncomfortable fact about the typical US bond portfolio: it is already short options, and the person who owns it has never placed a single options trade.
That exposure is not a theory or a niche corner of the market. It lives inside the mortgage-backed securities, callable corporate bonds, and structured credit that populate almost every standard core fixed income benchmark. And it interacts directly with interest rate volatility, which currently sits at 82.21 on the ICE BofA MOVE Index as of 11 September 2026, roughly 30 to 35 points below the early-2026 high and dramatically lower than the 180-200 range seen during the 2022-2023 stress episodes.
The gap between where implied rate volatility sits today and where it has been during past shocks is the setup for everything that follows. What follows unpacks the mechanics behind that hidden exposure, explains how rate options actually behave, and shows how a deliberately asymmetric position can be built on the other side of it.
Your bond portfolio is already short options, whether you know it or not
Sit with the idea for a second. You can own nothing but plain, familiar bonds and still be running a short-volatility bet the entire time.
The exposure enters through three specific channels, and none of them require you to touch an options screen.
- Mortgage-backed securities (MBS): Homeowners hold the right to refinance when rates fall. When they exercise it, you are on the wrong side of that trade, forced to reinvest at lower yields.
- Callable corporate bonds: The issuer keeps the right to redeem the bond early, usually when rates drop or spreads tighten. Economically, you own a straight bond while being short a call option on interest rates.
- Collateralised loan obligations (CLOs): This same short-optionality runs through structured credit, which carries call features and prepayment exposure, particularly in the equity tranche.
The MBS case is the clearest illustration of the problem. Agency MBS carry what is known as negative convexity, meaning your upside when yields fall is capped because prepayments force reinvestment at lower rates, while your losses when yields rise accelerate. You get the bad end of the move in both directions.
The Federal Reserve itself is not immune to this dynamic: negative convexity in MBS has locked the Fed’s own $1.93 trillion agency portfolio into an 8.8-year weighted average life, with low-coupon vintages potentially persisting 16-18 years before full runoff, a direct consequence of the same extension risk that punishes private MBS holders when rates rise.
A bond investor can be structurally short options, and pay for it during a volatility spike, without ever having placed an options trade in their life.
The practical meaning is direct. Your passive core fixed income allocation is not a neutral duration position. It is an active short-volatility bet you did not consciously make, and one you are likely not being paid to hold.
Three moments when embedded short-vol repriced
This pattern is not academic, and history has repriced it more than once.
The 1994 bond-market selloff exposed severe extension risk in MBS, where prepayments slowed and durations lengthened just as rates rose, deepening losses for holders. The 2013 taper tantrum did the same when Federal Reserve tapering signals sent yields spiking and convexity hedging amplified the move. The 2022 rate shock was the most recent reminder, pushing the MOVE Index above 180 for much of the year and delivering larger-than-expected losses to anyone holding these embedded options.
When big ASX news breaks, our subscribers know first
What the MOVE Index is telling you about the current entry point
Start with the raw number, then let the context do the work.
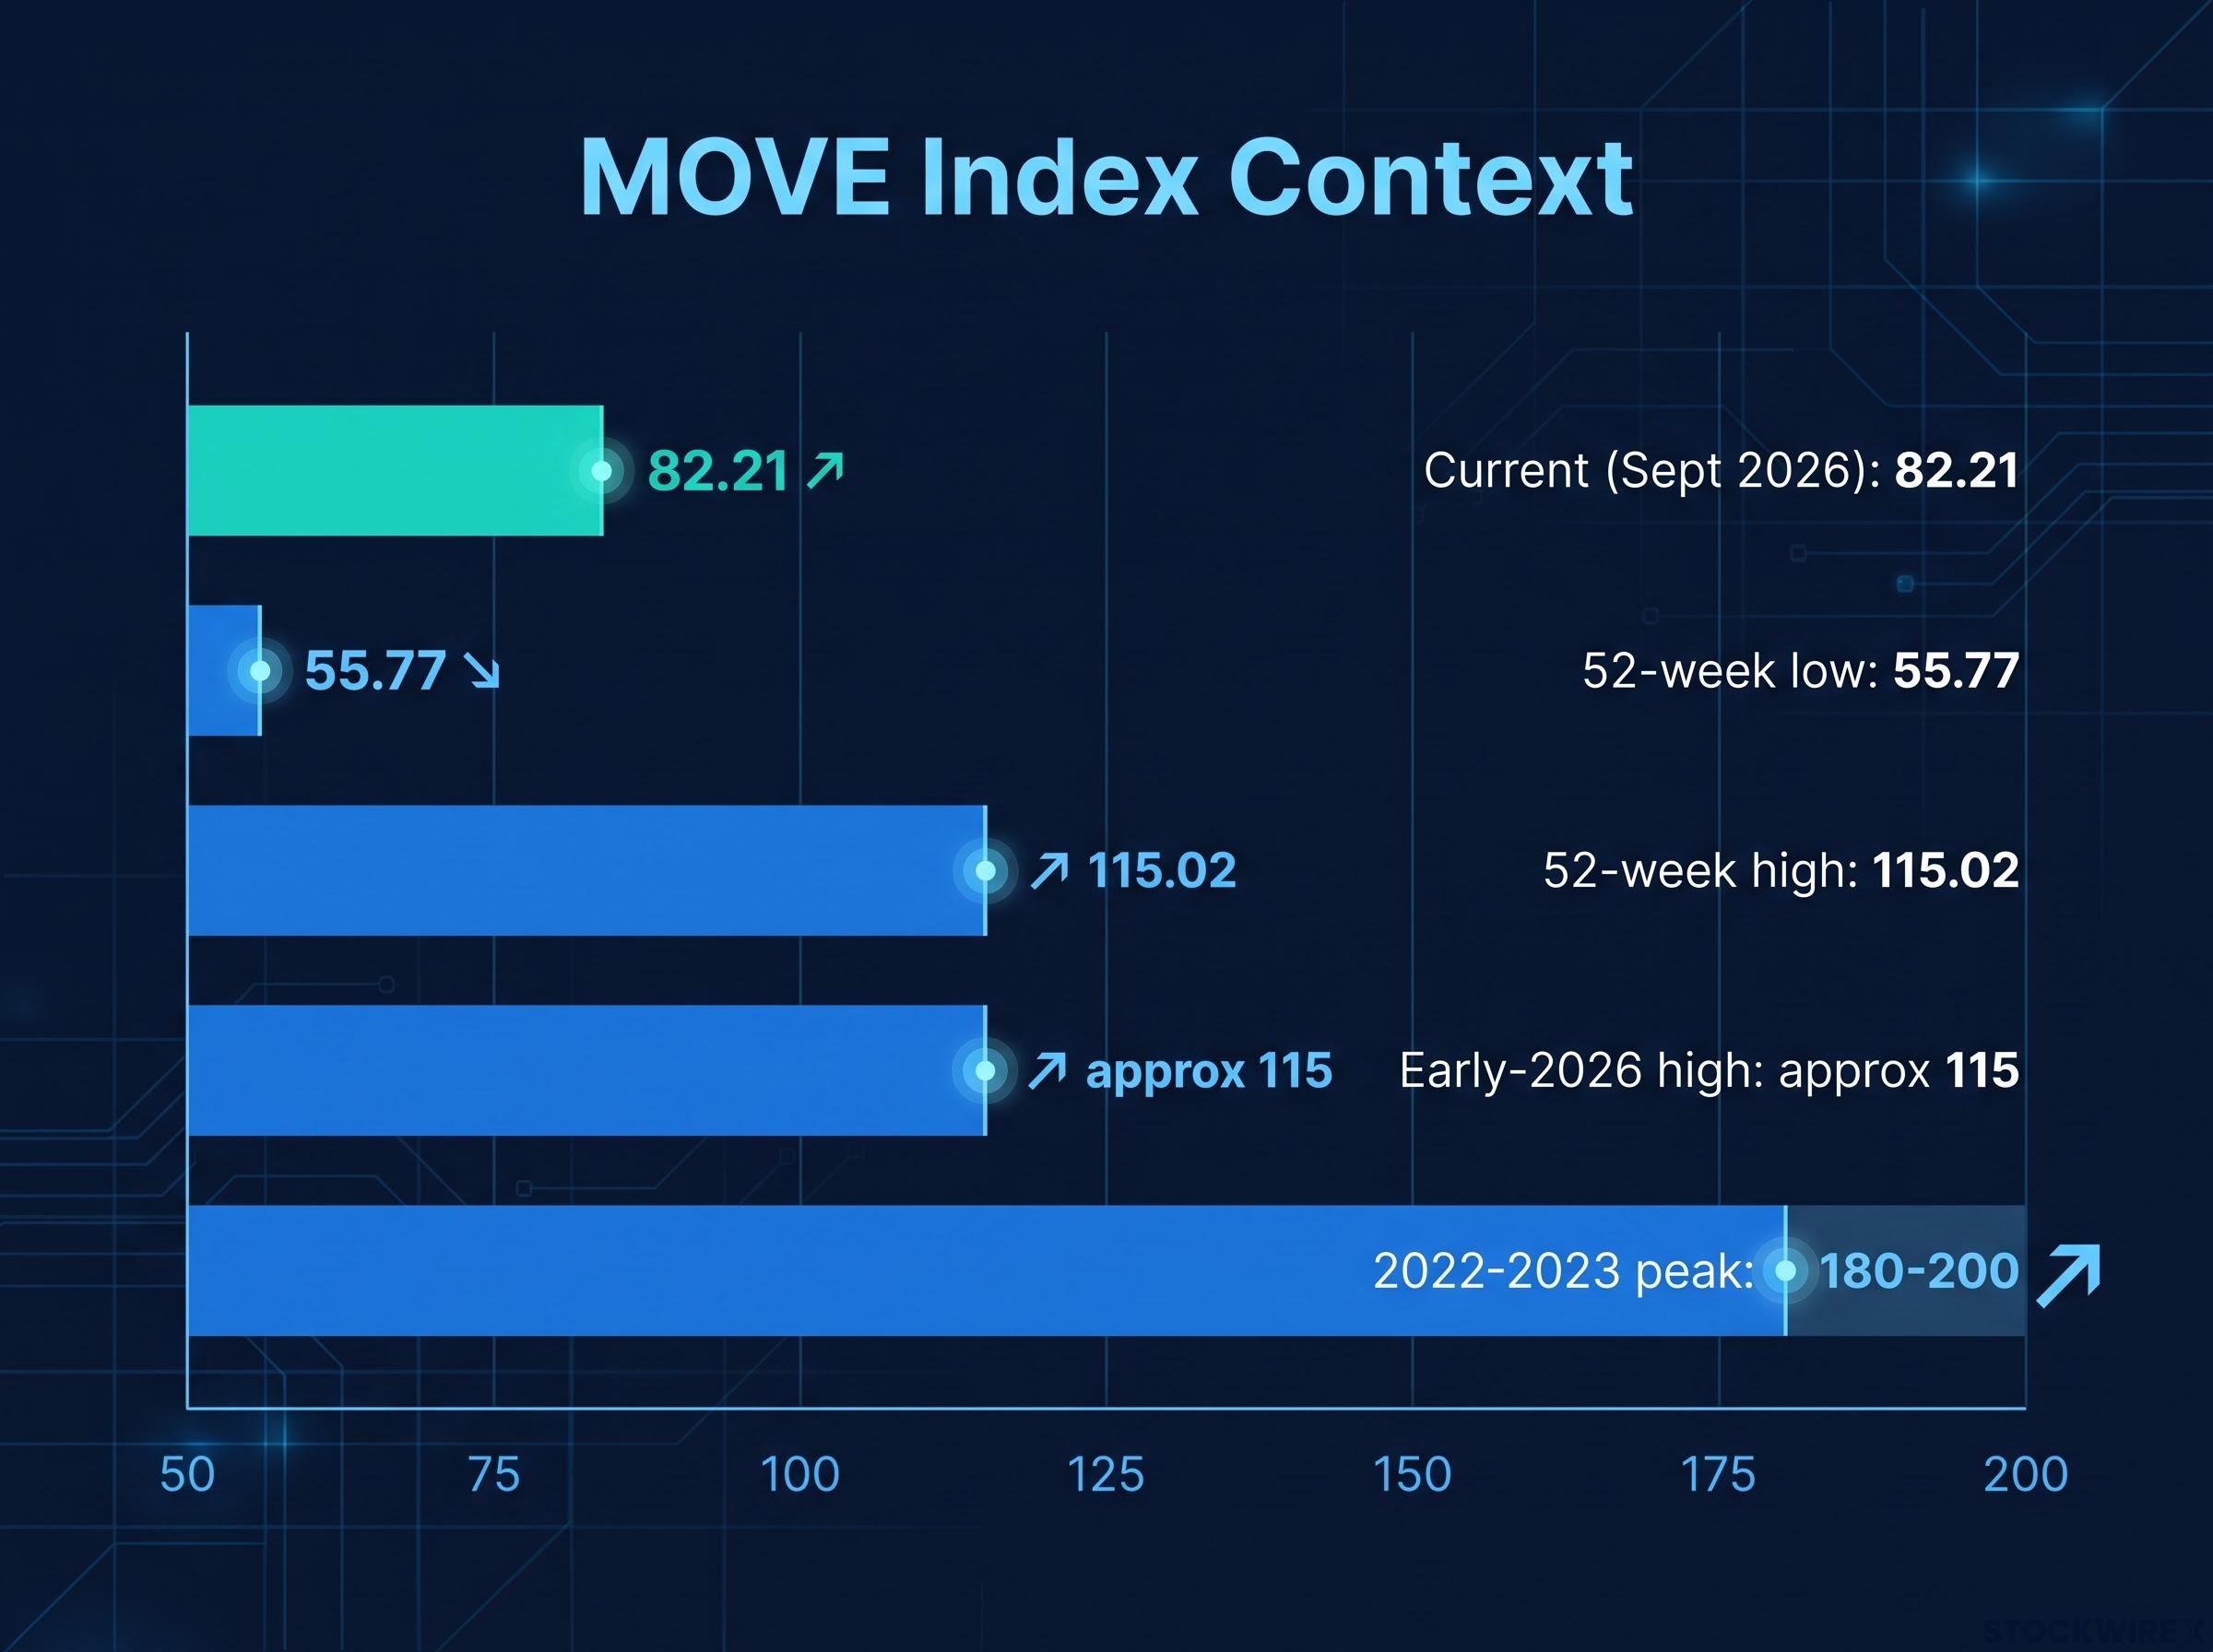
The MOVE Index measures the market’s expectation of Treasury yield volatility over the coming month, effectively the price of interest rate uncertainty. As of 11 September 2026, it reads 82.21, sitting near the middle of its 52-week range of 55.77 to 115.02.
On its own, that number means little. The comparison is where the significance lives.
| Reference point | Approximate date | MOVE level | Context |
|---|---|---|---|
| Current | September 2026 | 82.21 | Near middle of 52-week range |
| 52-week low | Past 12 months | 55.77 | Deepest recent compression |
| 52-week high | Past 12 months | 115.02 | Recent range top |
| Early-2026 high | Early 2026 | approx 115 | Pronounced volatility spike |
| 2022-2023 peak | 2022 to March 2023 | 180-200 | Rate shock and banking crisis |
Seen this way, the current reading looks compressed rather than simply calm. Several structural forces are pressing it down.
Central-bank policy visibility is the first. Once the Federal Reserve moved firmly into restrictive territory and signalled a “higher for longer” stance, the range of plausible near-term policy outcomes narrowed, reducing demand for front-end hedging. Systematic volatility-selling is the second, with structured products, insurance and pension overlays, and hedge fund short-vol programmes continuously injecting options supply into the market to harvest premium. Tight credit spreads are the third, encouraging still more vol-selling for yield.
Measured through the specific rate volatility instrument used by Quadratic Capital, implied volatility fell roughly 50% over three years, trading at approximately 3.5 basis points per day at the time of discussion.
A MOVE Index at 82 is therefore not just abstractly “low.” It is a historically compressed level held down by structural selling that can reverse quickly. For anyone weighing a long options position, that matters enormously, because options bought when implied volatility sits near multi-year lows are structurally cheaper than the same positions placed in the middle of a crisis.
The relationship between options premium and vega explains precisely why buying rate options at a MOVE reading of 82 rather than 180 is structurally advantageous: vega itself grows as volatility rises, so each additional point of implied volatility adds more dollar premium than the previous one, meaning options purchased near multi-year lows carry a compounding discount relative to crisis-period pricing.
How interest rate options actually work, and why they differ from equity options
Most investors carry an intuition about options built from equities. That intuition is a useful starting point, and then it needs dismantling.
An interest rate option gives you the right, but not the obligation, to benefit from a specific move in rates. The main instruments are swaptions (options on interest rate swaps), caps (which pay out when rates rise above a set level), and floors (which pay out when rates fall below one). What unites them is an asymmetric payoff: your loss is limited to the premium you pay, while your upside is open.
That asymmetry is the entire point of difference from a linear duration trade.
| Dimension | Linear duration trade (e.g. curve-steepener swap, Treasury futures) | Long rate options (e.g. swaption) |
|---|---|---|
| Payoff profile | Symmetric gains and losses | Asymmetric, capped downside |
| Cost structure | Lower transaction cost, positive carry possible | Recurring premium and carry cost |
| Downside risk | Open on the wrong side of the move | Limited to premium paid |
| Convexity | None (delta-one) | Positive convexity |
For context on the curve these options reference, the US 2s10s spread sits at +23 basis points as of 11 September 2026, with the 2-year yield at 3.95% and the 10-year at 4.18%, both slightly below the 4.25% policy rate.
Why rate volatility runs backward while equity volatility runs forward
Here is where the equity intuition breaks.
Equity volatility curves, such as VIX futures, are usually in contango, meaning near-term implied volatility sits below longer-dated volatility. That shape exists because there is persistent structural demand for long-dated downside protection against future recessions and bear markets, which lifts the far end of the curve.
Rate volatility does the opposite. Its term structure is backwardated, meaning longer-dated options carry lower implied volatility than near-term ones. Near-term rate options embed immediate event risk, the next Federal Open Market Committee meeting, the next inflation print, a geopolitical shock, while longer-dated options average those regimes out and lean on mean-reversion and an established central bank reaction function.
The implication for a buyer is genuinely useful. Because long-dated rate options can look cheap relative to short-dated volatility, you can potentially roll up the term structure, buying where volatility is cheaper and capturing the spread against where shorter-dated vol trades. That is the reverse of what equity options experience trains you to expect.
Building asymmetric yield curve exposure instead of taking a linear bet
Now move from concept to construction. What does a deliberately asymmetric position actually look like sitting in a portfolio?
Long rate options let you target a specific segment of the curve, such as the 2s10s or the 5s30s, and express a view on volatility itself rather than pure direction. The result is exposure that can pay off when yields move sharply in either direction, because you are positioned for the size of the move, not only its sign.
The clearest retail-accessible example of this thinking is the IVOL ETF, designed by Quadratic Capital in 2018 and listed in 2019. It combines Treasury Inflation-Protected Securities (TIPS) with long interest rate options inside an ETF structure, built to separate inflation protection from duration risk.
The foundational insight behind IVOL was that TIPS bundle inflation protection together with duration exposure, and before its 2019 launch there was no ETF-accessible way to reach the interest rate options market at all.
The payoff logic is where this differs structurally from adding duration. Options limit your downside to the premium paid while preserving upside from favourable yield moves or curve shifts, in contrast to the symmetric gains and losses of a linear duration trade.
The limitations are real and worth stating plainly.
Options overlays in fixed income portfolios have grown from a niche tactic into a segment holding roughly $280 billion in US assets as of mid-2026, but AQR research found that more than 80% of buffer funds underperformed simple equity-and-cash benchmarks across three major drawdowns, a reminder that layering options onto a portfolio introduces implied volatility risk that replaces, rather than eliminates, the duration risk it hedges.
- Premium and carry cost: You pay recurring premium to hold the position, whether or not the move arrives.
- Low-vol drag: In a suppressed-volatility regime, that carry becomes a persistent drag on returns.
- OTC liquidity barriers: Over-the-counter options markets can be difficult for smaller institutions to access efficiently.
- Accounting complexity: Corporate holders face genuine accounting and model-risk complications.
That carry drag is best understood through the pricing itself: with implied volatility near 3.5 basis points per day, premium became deeply compressed, which is exactly what long-vol carry looks like in a quiet market.
The most important interpretive point is this. If you already hold core bond allocations with embedded short-vol through MBS and callables, long rate options are not simply a speculative add-on. They can function as a structural hedge against the short optionality already sitting in your portfolio. The distinction between adding duration and adding convexity is material, because in a repricing, linear duration cannot replicate that payoff.
What makes this moment structurally different from linear duration plays
Pull the three threads together and the picture sharpens.
- You are structurally short volatility through the standard bonds already in your portfolio.
- Implied rate volatility is near multi-year lows, held down by systematic selling dynamics.
- The term structure is backwardated, making longer-dated options comparatively cheap to buy.
Each of these is a condition you can verify, not a recommendation to act. And together they describe an unusual asymmetry.
The current MOVE level of 82.21 reflects a relatively benign market consensus. History says nothing about how durable that consensus is. The 180-200 range of 2022-2023 shows how fast it can break, and the 2s10s curve itself has been anything but still, reaching roughly 73.7 to 74 basis points near a four-year high in early 2026 before flattening back to +23 basis points by September. That is a large, quick move inside a single year.
The debate between stability and complacency
Experts do not agree on what the calm means, and that disagreement is itself informative.
One camp argues that systematic volatility-selling provides liquidity, keeps pricing efficient, and reflects genuine macroeconomic stability underpinned by policy visibility and tight spreads. The other camp, populated by macro hedge fund managers and central bank researchers, warns that widespread short-vol positioning creates latent fragility, where the very programmes suppressing implied volatility can turn a shock into a disorderly spike.
The BIS triennial derivatives survey found that highly leveraged hedge fund positions in government bond futures and interest rate derivatives have grown sharply, with the report noting explicitly that these concentrated strategies carry the potential to amplify stress across fixed income markets.
You do not need to pick a winner. The unresolved nature of the debate is the argument for optionality rather than a directional duration bet.
The practical read is measured. Nothing here says a volatility spike is imminent or certain. It says the cost of being long volatility is near historic lows while the potential repricing of the embedded short-vol in your portfolio is near historic severity. That combination is what makes this an asymmetric moment in risk-reward terms.
Making an informed decision in a compressed-volatility environment
The whole arc reduces to three questions you can ask about your own portfolio.
- Do I hold MBS, callable bonds, or CLO exposure that carries embedded short optionality?
- Is my implied volatility cost currently near historical lows, making optionality relatively cheap to add?
- Am I expressing a curve view linearly when an options structure might offer a better risk-reward profile?
This is a portfolio construction question, not a speculative trade, and understanding the hidden short-vol in your existing allocation is the necessary first step. The structural drivers of low rate volatility, central bank visibility, systematic selling, and tight spreads, are regime-dependent and can shift without a clear leading indicator. Convexity is a property that tends to be far cheaper to own before the next repricing than after it.
For readers wanting a practical framework for the broader allocation decisions around these conditions, our full explainer on bond portfolio management covers how BlackRock, PIMCO, Vanguard, and J.P. Morgan Asset Management are positioning duration exposure across the 1-5 year curve segment in the current normalised rate environment.
This article is for informational purposes only and should not be considered financial advice. Investors should conduct their own research and consult with financial professionals before making investment decisions. Past performance does not guarantee future results, and any forward-looking statements are speculative and subject to change based on market developments.