How to Run a Scenario-Based Stock Valuation Analysis
14 mins ago

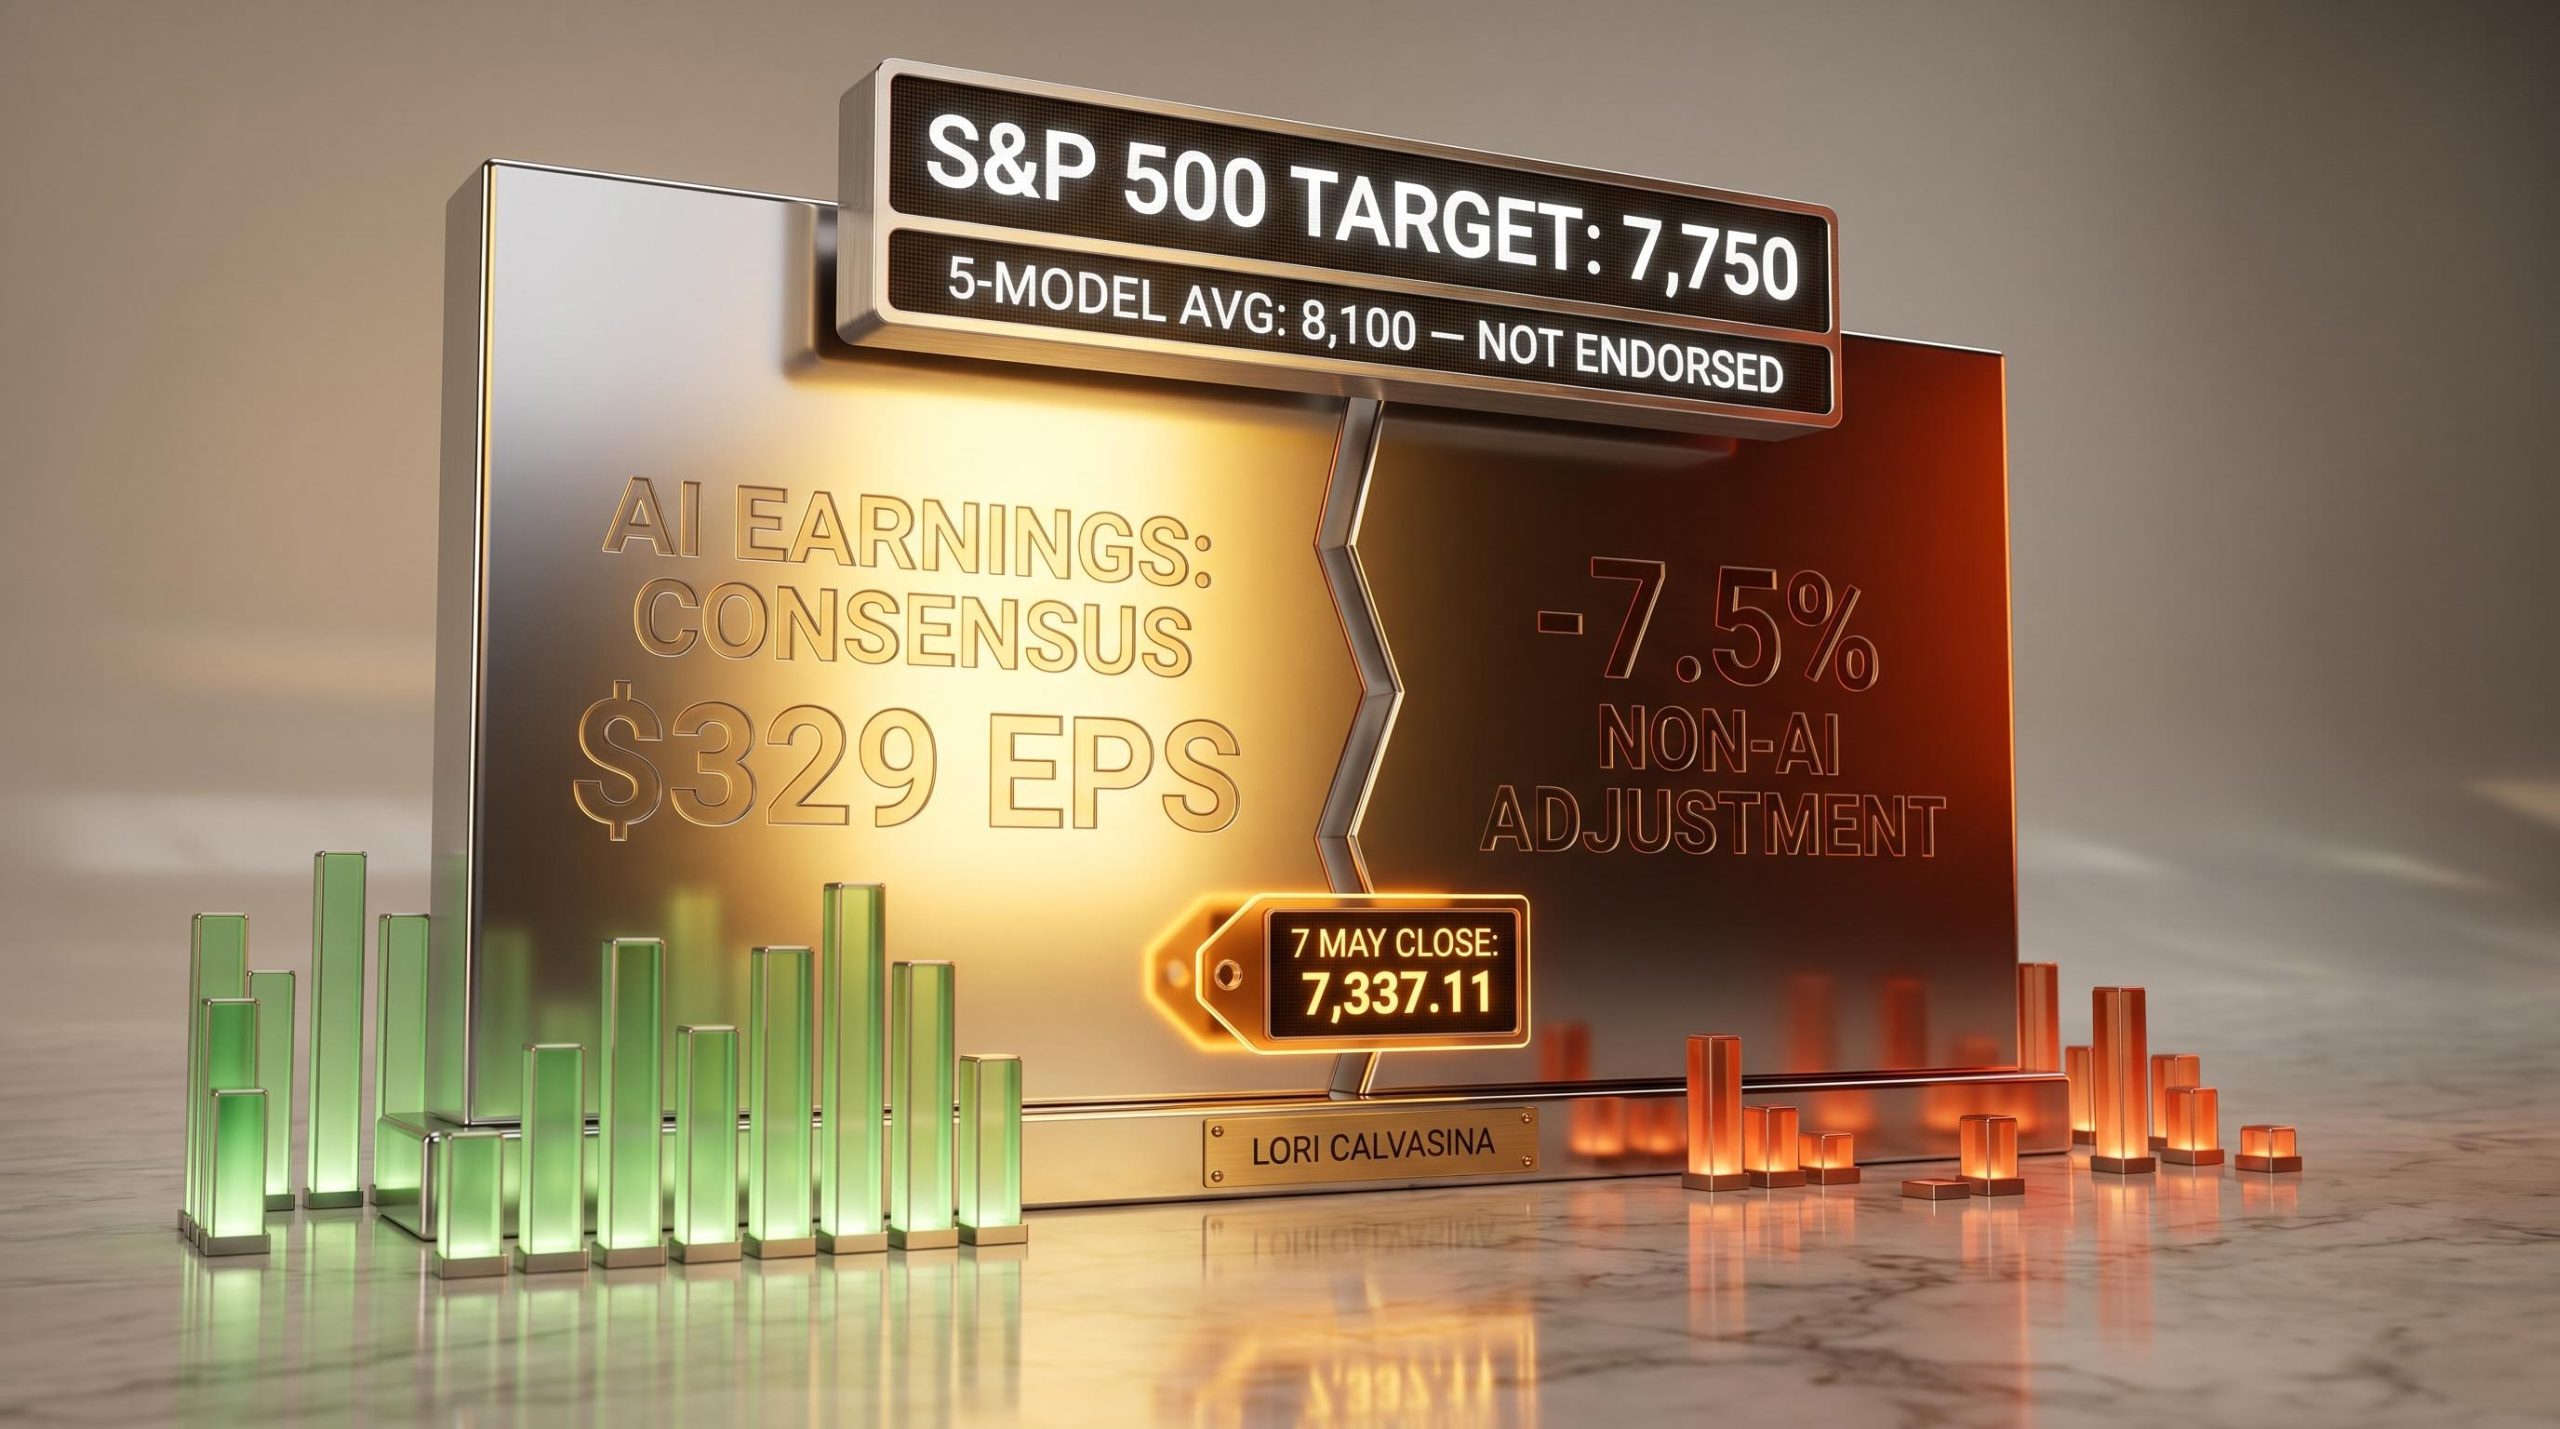
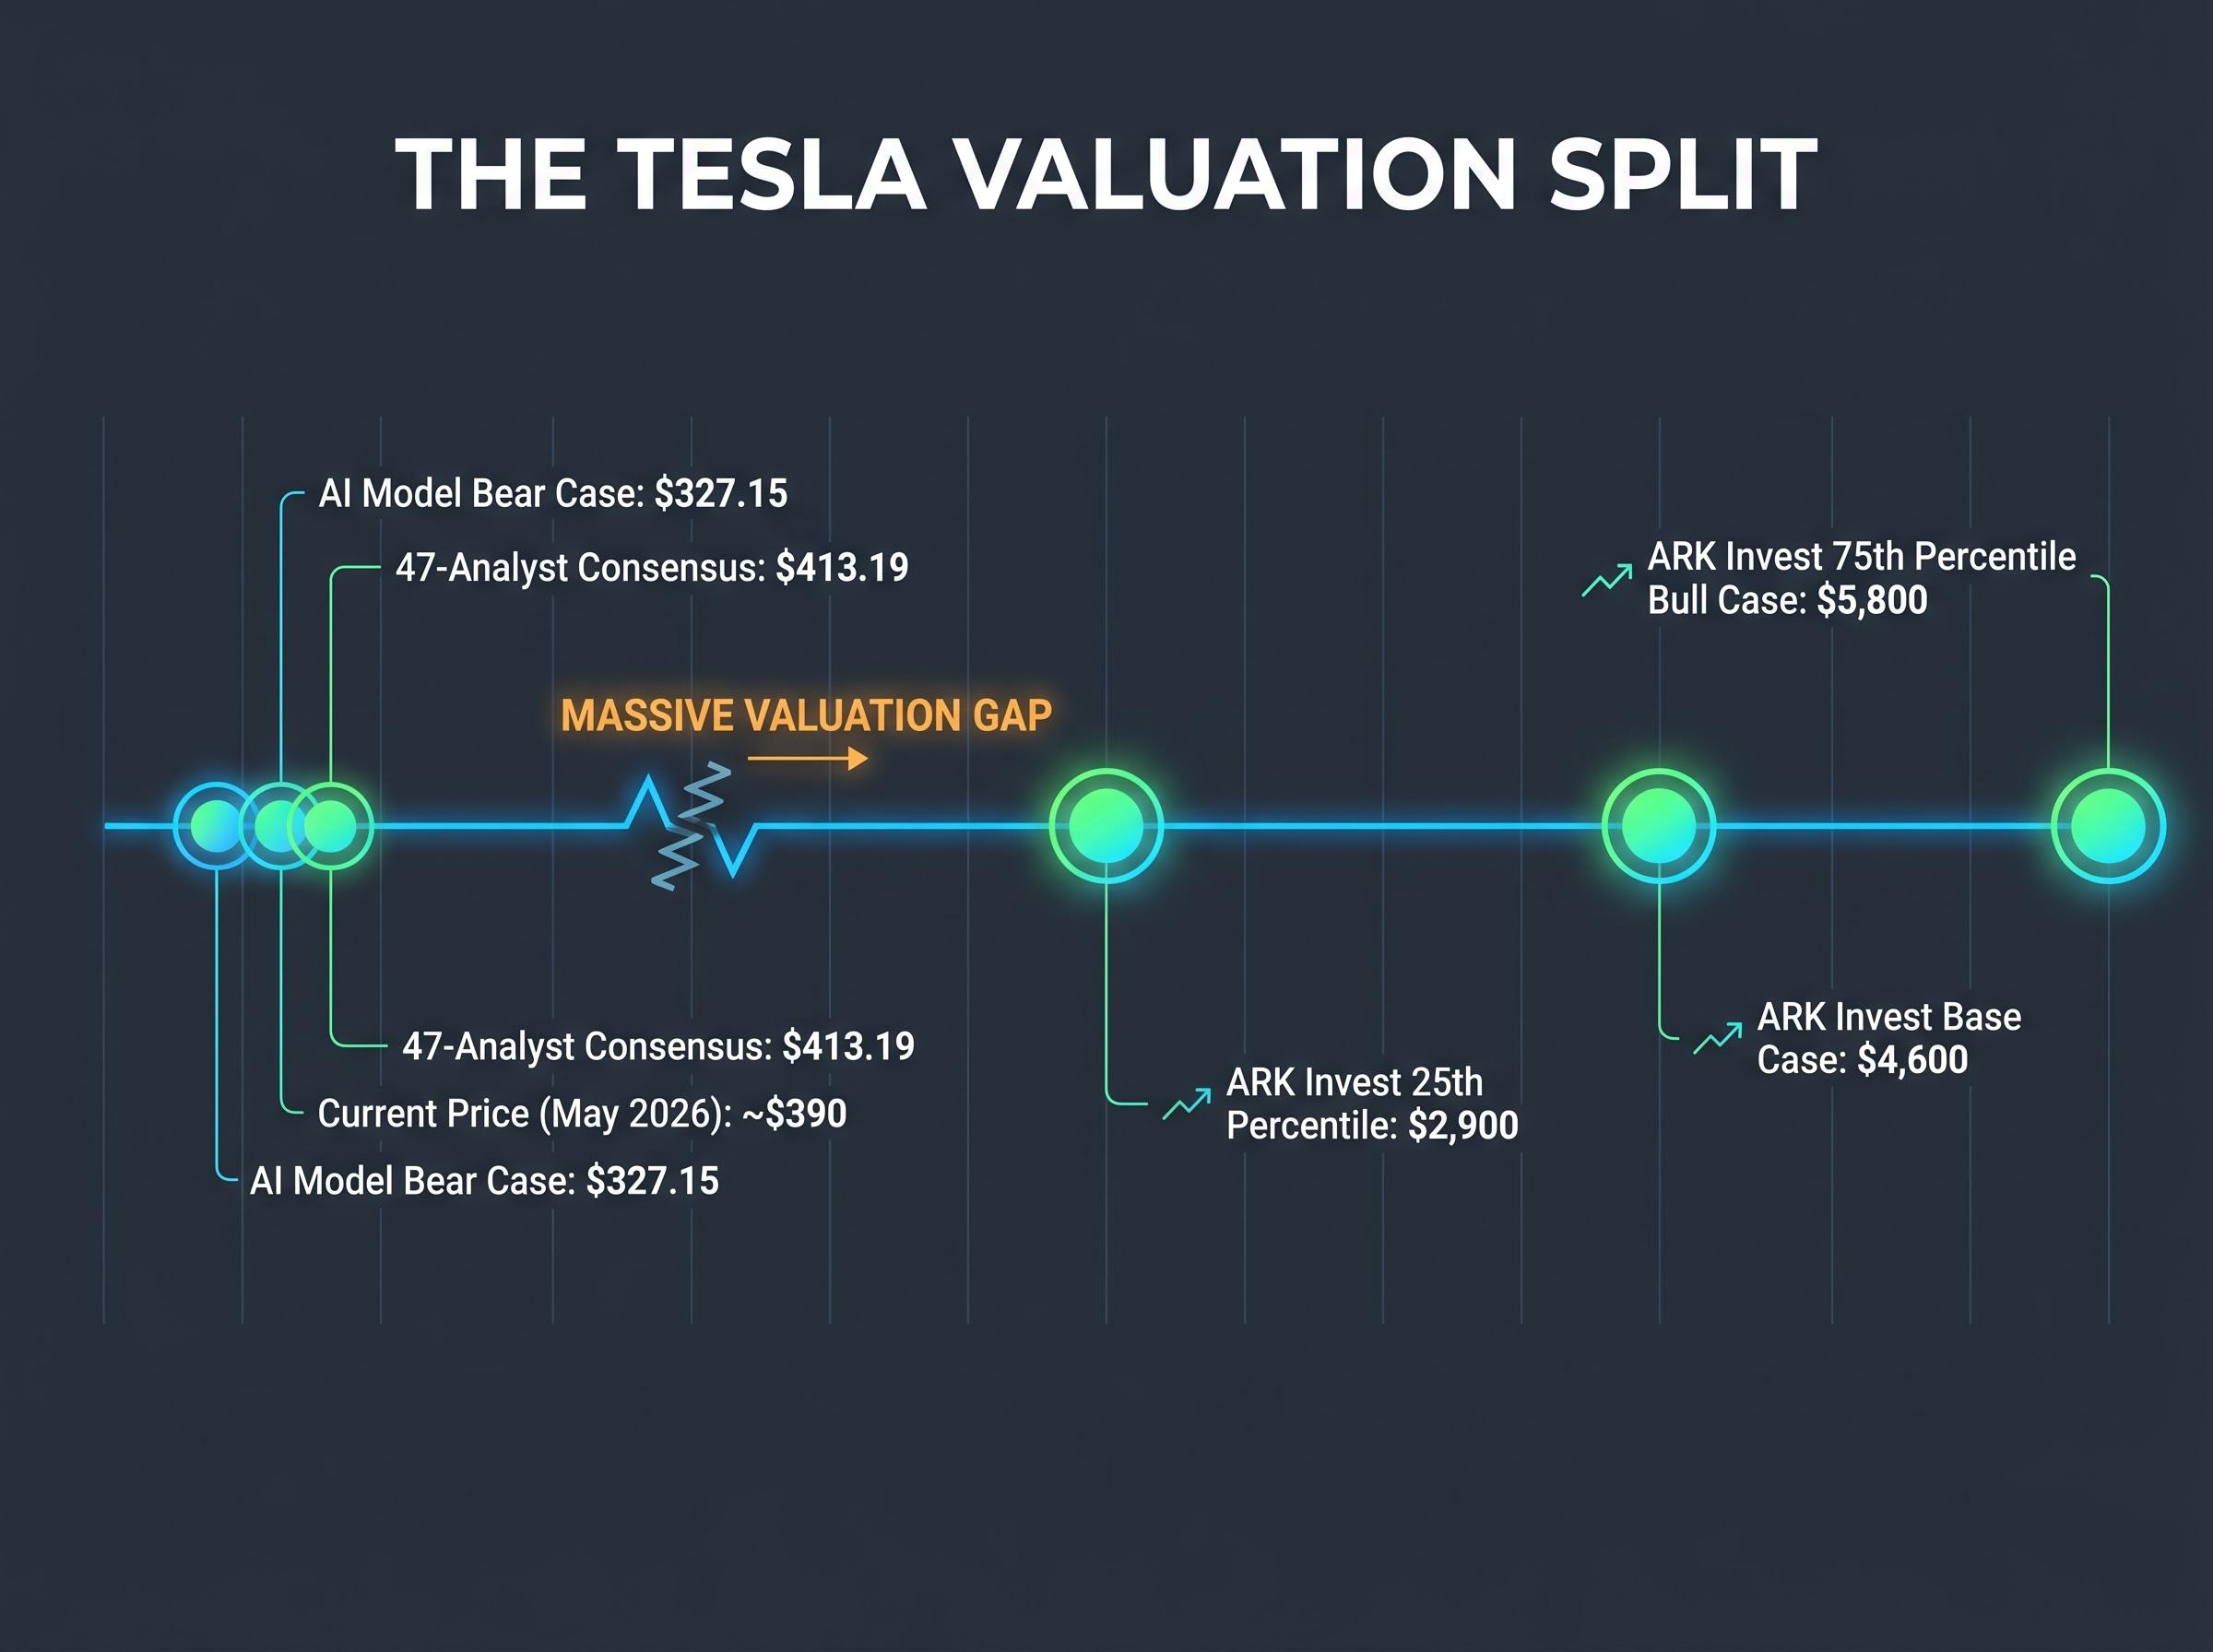
At roughly $390 per share in May 2026, Tesla carries a $1.36 trillion market capitalisation, yet a 47-analyst consensus pegs fair value at $413 while one AI model puts the bear case at $327 and ARK Invest’s base case sits at $4,600. Three estimates, three radically different answers, one stock. When a company is priced for a transformation it has not yet completed, standard valuation shortcuts break down. The spread of outcomes on Tesla is not a data problem; it is a structural feature of investing in transition-stage companies. Knowing how to reason through it is a foundational investing skill. This guide uses Tesla’s Q1 2026 numbers and published analyst frameworks as a live case study to teach a repeatable methodology for stock valuation analysis: how to build bull and bear scenarios, how to translate them into projected returns, and why the price paid at entry determines which scenario an investor needs to be right about.
Tesla reported Q1 2026 revenue of $22.4 billion, up 16% year-over-year and above analyst forecasts. Gross margins came in at 21.7%, substantially higher than the 17% consensus had projected. By most automotive benchmarks, those are strong results.
The problem is that automotive benchmarks may be the wrong lens entirely. On the 22 April 2026 earnings call, Elon Musk framed Tesla as an AI and robotics enterprise rather than a traditional carmaker, describing Optimus as potentially the largest product ever brought to market. If that framing is accurate, comparing Tesla’s price-to-earnings ratio against Ford or GM makes as much sense as valuing early Amazon against Borders Books.
This tension is not unique to Tesla. Any company mid-transition, from hardware to software, from services to platform, from manufacturing to autonomy, presents the same analytical challenge. Current financials describe one business; the market price may be discounting an entirely different one. The question for investors is not which view is correct today, but how to evaluate both views with discipline.
Peer group selection is the most consequential early decision in any high-multiple valuation, because comparing Tesla against Ford implies an 8-15x terminal multiple while comparing it against Nvidia or Alphabet implies 55-75x, and that single methodological choice produces wildly different fair value outputs before any other assumption is made.
Two views coexist using the same historical financials. The first sees a premium EV manufacturer facing margin pressure and rising competition, a strong company that is nonetheless overvalued at $390. The second sees an emergent AI and robotics platform that happens to currently generate most of its revenue from cars, a company that could be dramatically undervalued at the same price.
Both views arrive at opposite conclusions because they assign different probabilities to Tesla’s future business mix. The methodology that follows is designed to make those probability assignments explicit rather than assumed.
Every scenario-based valuation rests on three inputs. Understanding what each one represents, and why each is uncertain for a transition-stage company, is the foundational step before building any projections.
| Input Variable | What It Represents | Why It Is Uncertain for Tesla |
|---|---|---|
| Revenue Growth Rate | How quickly annual sales increase over the projection period | Depends on whether robotaxi and Optimus generate meaningful revenue, or growth stays tied to vehicle deliveries |
| Net Profit Margin | The percentage of revenue that becomes profit after all costs | Software and autonomy revenue carry far higher margins than hardware; business mix determines the margin outcome |
| Exit P/E Multiple | What investors will pay per dollar of earnings at the end of the projection window | An automaker trades at 8-15x earnings; a high-growth tech platform trades at 25-40x; Tesla’s future multiple depends on which category the market assigns |
These three inputs combine in a sequential logic:
The inputs are not arbitrary. They must be grounded in comparable companies, historical ranges, and specific execution assumptions. ARK Invest’s open-source model, for instance, uses Monte Carlo simulation with 75th and 25th percentile outputs to constrain its scenario inputs with probability discipline rather than subjective optimism. Tesla’s 2026 capex guidance exceeding $25 billion is itself a calibration input: it signals the scale of investment required for the transformation and frames why near-term margins are compressed relative to the long-term bull case.
The 47-analyst consensus target of $413.19 and the AI model bear target of $327.15 each imply different underlying assumptions about these same three variables. The framework that follows makes those assumptions visible.
The bear case is not a pessimistic fantasy. It is a scenario in which Tesla remains a strong EV company, with margins above Ford or GM, but generates no meaningful AI or robotics revenue within the projection window. The automotive business performs well. The stock is simply overpriced for what that business alone can deliver.
The bear case inputs:
| Scenario Input | Low Assumption | High Assumption | Midpoint |
|---|---|---|---|
| Revenue Growth Rate | 6% | 12% | 9% |
| Net Profit Margin | 8% | 14% | 11% |
| Exit P/E Multiple | 18x | 22x | 20x |
Each input tells a specific story. Revenue growth of 6-12% assumes Tesla continues growing vehicle deliveries at a moderate pace but does not capture new revenue streams from autonomy or robotics. Margins of 8-14% reflect a hardware-heavy business facing pricing pressure from BYD and other competitors, with gross and net margins declining from their prior peaks. An exit multiple of 18-22x is above what traditional automakers command but well below software or platform valuations.
Run those inputs through the three-step framework, and the results are consistent across every combination.
At approximately $375-$390 per share, every projected return outcome under bear case assumptions produces a negative result. The current price already embeds a meaningful AI and robotics premium that investors are paying for, regardless of their stated view.
This is the section’s central finding. BYD surpassing Tesla in EV volume, declining margins from peak levels, and intensifying competition all provide the empirical basis for why this scenario is not implausible. An investor buying at $390 is not making a neutral bet on a strong car company. That investor is making a specific bet that the AI and robotics transformation materialises. The bear case makes this visible.
The bull case numbers are large, and so is the operational checklist behind them.
| Input Variable | Bear Case Range | Bull Case Range |
|---|---|---|
| Revenue Growth Rate | 6-12% | 20-35% |
| Net Profit Margin | 8-14% | 20-30% |
| Exit P/E Multiple | 18-22x | 25-35x |
| Implied Annualised Return | Negative at ~$390 entry | ~11-35% over 10 years |
Revenue growth of 20-35% requires new revenue categories at scale, not just faster car sales. Margins of 20-30% are achievable only if software and autonomy revenue, which carry materially higher margins than vehicle manufacturing, become a significant share of the total. An exit multiple of 25-35x assumes the market re-rates Tesla as a technology platform rather than an automaker.
ARK Invest’s base case of $4,600 per share and bull case (75th percentile) of $5,800 reflect the upper end of these assumptions. Even the 25th percentile bear case from ARK’s Monte Carlo output comes in at $2,900, more than seven times the current price.
Each of those numbers maps back to a specific operational prerequisite that must be met:
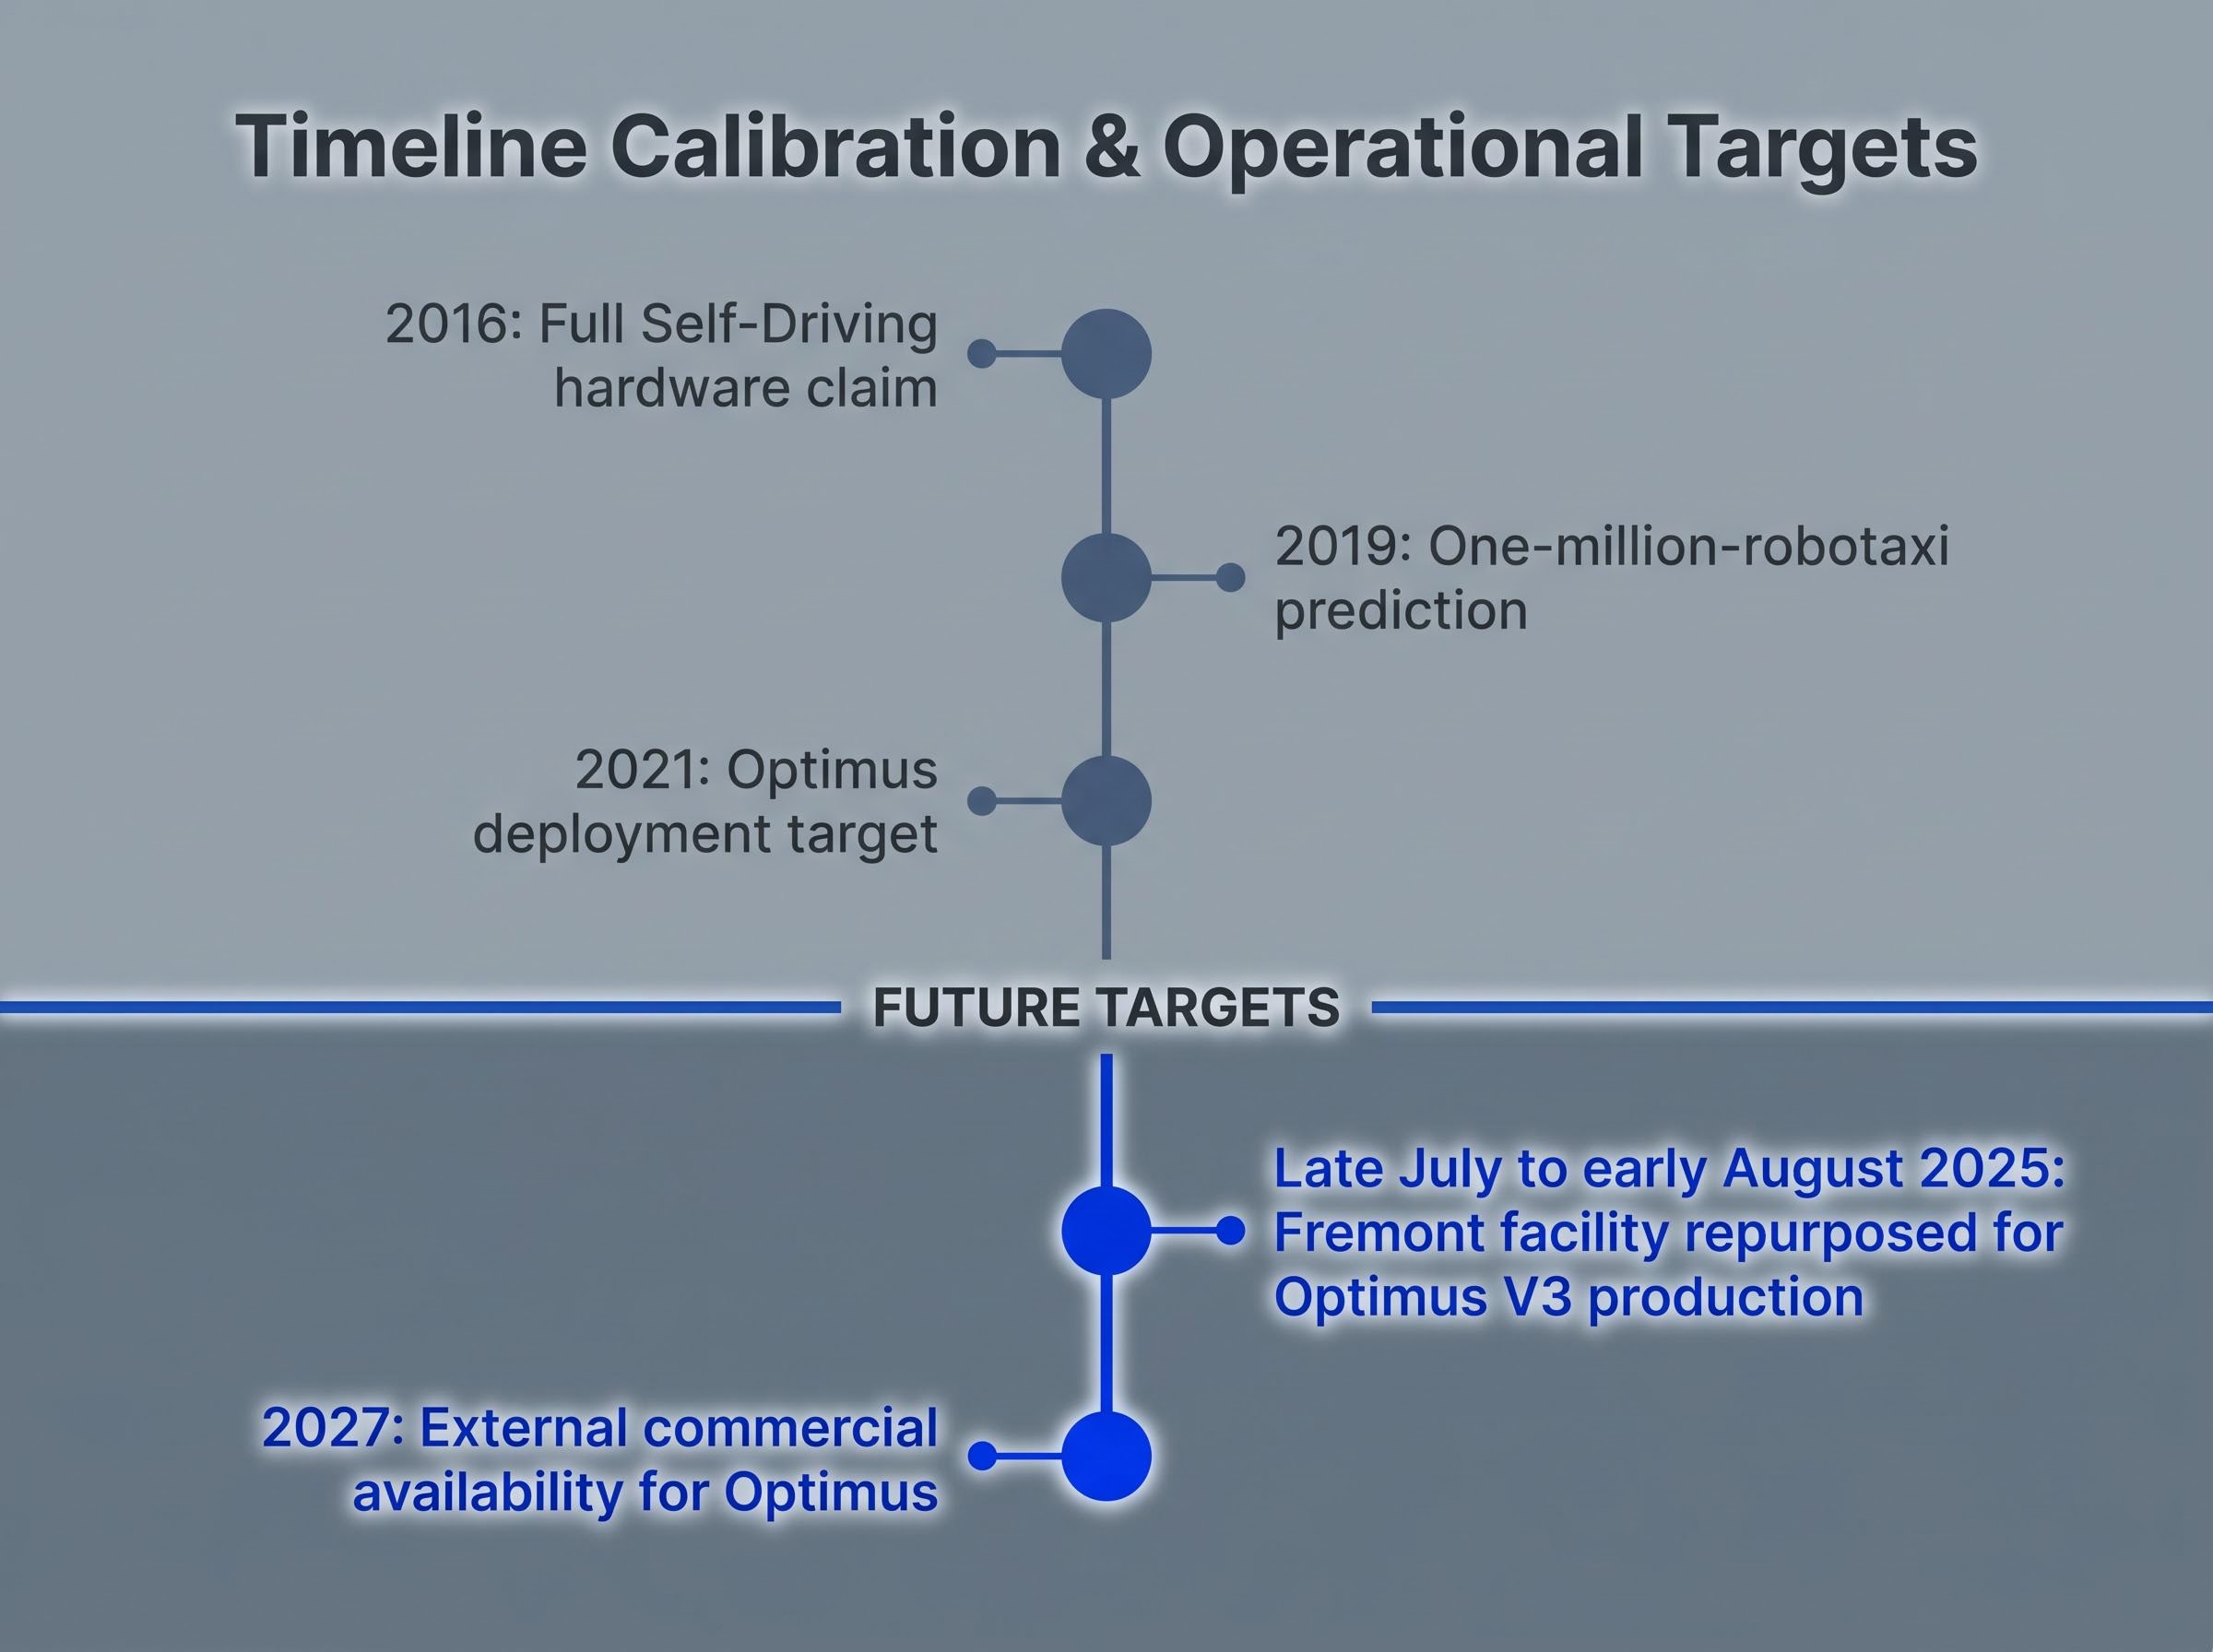
Musk’s timeline credibility is itself a calibration input. The pattern is instructive: the 2016 Full Self-Driving hardware claim, the 2019 one-million-robotaxi prediction, the 2021 Optimus deployment target. In each case, eventual delivery occurred, but persistent delays shifted timelines by years. This record does not invalidate the bull case. It does suggest that probability-weighting the full bull case at roughly 5-10% may be more realistic than assuming all milestones resolve on schedule.
The natural instinct after building two scenarios is to ask which one is right. The more productive question is different: what does each scenario require of the entry price?
Reverse-engineering a price target, working backward from the current share price to identify what growth rate, margin, and exit multiple it already assumes, is often more revealing than building a forward projection from scratch, because it shows an investor exactly which scenario the market has already priced in before any position is taken.
The same company at $100 per share versus $400 per share is not the same investment, even if the company’s future unfolds identically.
Tesla traded at approximately $100 per share a few years prior to the current analysis. It peaked near $450. An investor who entered at $100 can afford to be wrong about the full bull case and still generate acceptable returns if even partial execution occurs. An investor entering at $390 cannot. The gap between those two positions is not a difference of opinion about Tesla. It is a difference of margin of safety.
This is where probability weighting converts scenario analysis from an intellectual exercise into a practical decision-making tool. The process has three steps:
Prediction markets offer one accessible tool for calibrating these probabilities. As of early May 2026, prediction markets assigned a 92.5% probability of Tesla staying below $375 through 1 June 2026, a data point that reflects near-term sentiment and can inform scenario weights.
Forward analyst EPS estimates project earnings growing more than 5x from current levels, incorporating autonomy and AI contributions. The most likely outcome, according to the analyst community, is partial execution: neither full bull nor full bear, but something in between. The price paid at entry determines whether that middle outcome delivers an adequate return or a disappointing one.
The methodology applied to Tesla in this guide is not Tesla-specific. Any company priced for a transformation it has not yet completed presents the same analytical structure. The framework generalises into four steps:
This framework applies to hardware-to-software transitions, regulated industries awaiting approvals, and platform businesses whose unit economics could improve non-linearly with scale. The 47-analyst dispersion on Tesla (from $327 to $5,800) is not unusual for transition-stage companies. The dispersion itself is a signal that the market is genuinely uncertain, not that one analyst group is wrong.
ARK Invest’s open-source model on GitHub offers one publicly accessible example of a structured scenario framework that investors can study and adapt. Tesla’s capex guidance exceeding $25 billion in 2026 is the kind of near-term financial signal that a scenario framework must incorporate rather than dismiss, because it directly affects margin trajectories and return timelines.
ARK Invest’s open-source Tesla model uses Monte Carlo simulation to generate probability-weighted outputs across hundreds of scenario combinations, allowing investors to adjust key assumptions including robotaxi penetration rates and Optimus revenue contributions and observe how sensitively the valuation range responds to each variable.
Confirmation bias is the most common failure in scenario construction. It manifests as a “bear case” that still implies positive returns and a “bull case” that assumes every execution risk resolves favourably. Both versions flatter the investor’s pre-existing view rather than stress-testing it.
One concrete test: a genuine bear case should produce outcomes that make the current price look clearly expensive, not merely less attractive. If the bear case still implies modest upside, it is not a bear case. It is an optimistic base case wearing a different label.
The opening question was how three analysts could look at the same company and arrive at $327, $413, and $4,600. The answer, after working through the framework, is straightforward. The $327.15 AI model bear target assumes Tesla is an overpriced EV company. The $413.19 consensus assumes modest upside from partial execution. ARK Invest’s $4,600 base case (and $5,800 bull case) assumes the full AI and robotics transformation succeeds. Each is internally coherent. Each depends on unresolved execution questions.
The goal of scenario analysis is not to pick the right answer. It is to understand what each scenario requires and whether the current entry price compensates adequately for the probability that the less favourable scenario materialises.
Investors monitoring Tesla should watch specific operational milestones as the real-world evidence that updates which scenario is gaining ground:
Monitoring triggers, defined before purchase as the specific observable milestones that would cause an investor to revise scenario probabilities upward or downward, convert scenario analysis from a one-time exercise into a dynamic framework that updates as quarterly results, regulatory filings, and production data arrive.
A methodology updates as evidence arrives. A price target is static. Investors who leave this guide equipped to run their own scenarios, assign their own probabilities, and reassess as milestones are met or missed are better positioned than those relying on any single analyst’s conviction.
This article is for informational purposes only and should not be considered financial advice. Investors should conduct their own research and consult with financial professionals before making investment decisions. Past performance does not guarantee future results. Financial projections are subject to market conditions and various risk factors.
Scenario-based stock valuation analysis is a methodology that builds separate bear, base, and bull projections using three core inputs: revenue growth rate, net profit margin, and exit price-to-earnings multiple. Each scenario is then probability-weighted to calculate an expected return that can be compared against the entry price.
The three-step process involves projecting future revenue by applying a growth rate over a chosen time horizon, multiplying that revenue by an estimated net profit margin to derive future earnings, and then multiplying those earnings by an exit P/E multiple to produce a projected future market capitalisation.
The extreme spread reflects fundamentally different assumptions about whether Tesla will generate meaningful revenue from robotaxi, Optimus, and AI businesses within the projection window. Each price target is internally coherent but depends on unresolved execution questions about Tesla's transition from automaker to technology platform.
An investor who bought Tesla near $100 can generate acceptable returns even if only partial bull case execution occurs, while an investor entering at $390 requires a much higher degree of successful execution to justify the price paid. The entry price determines the margin of safety and defines which scenario must materialise for the investment to succeed.
Key monitoring triggers include California commercial autonomous vehicle permit filings, the shift of Optimus from prototype to paying commercial customers, expansion of the robotaxi programme beyond pilot cities to revenue-generating service, and deployment performance data from Tesla's AI5 custom silicon chip.