
How to Analyse Stocks Priced for Transformation, Using Tesla
7 mins ago

At roughly $430 per share and a forward price-to-earnings ratio of approximately 208x, Tesla is not being valued as a car company. It is being valued as a bet on a future that has not happened yet, and the spread between the bull and bear cases is wider than almost any stock of comparable size.
Tesla’s Q1 2026 earnings call, reported on 22 April 2026, crystallised a question that applies far beyond this single stock: how does an investor rationally value a company when the business it is today and the business it might become are separated by a chasm of unproven execution? The bull case projects annualised returns of 11-35% over a decade. The bear case projects negative returns from current prices. Both analyses use the same starting stock price.
This guide uses Tesla’s actual Q1 2026 valuation data, analyst models, and scenario assumptions to teach a transferable methodology: how to build bull and bear cases, how to stress-test entry price sensitivity, and how to decide whether the gap between scenarios represents acceptable risk or a warning to wait.
A forward P/E of 208x is not a quirk. It is a signal. The market is not pricing Tesla’s current earnings; it is pricing a business transformation that has yet to materialise. Mature automakers such as Ford and GM trade at 6-12x forward earnings. Tesla trades at roughly seventeen times the upper end of that range.
The gap becomes even more instructive when measured in dollars. At approximately $430 per share, Tesla’s market capitalisation sits near $1.4 trillion. In Q1 2026, the company reported revenue of $22.4 billion and a gross margin of 21.7%, figures that represent a profitable car business but not a $1.4 trillion one.
The analyst price target range runs from $189 (CoinCodex bear case) to $600 (Wedbush bull case), with a consensus of $406.65 across 26 analysts. That is a spread of more than $400 on a single stock, a gap that reflects genuine scenario uncertainty rather than analytical failure.
Analyst price target divergence of this magnitude is not a failure of professional analysis; it is a structurally accurate reflection of a situation where two internally consistent but mutually incompatible companies are being modelled simultaneously, one that succeeds at autonomy and one that does not.
The teaching principle embedded in this disparity is straightforward. When a stock’s price already embeds a future that has not occurred, backward-looking multiples cannot do the analytical work. Valuation methodology must shift from what a company earns today to what it must become to justify what investors pay right now.
The same tension between price and fundamental value plays out at the index level: broader US equity overvaluation, as measured by the Buffett Indicator sitting at 223.6% in May 2026, well above dot-com bubble peaks, means Tesla’s elevated multiple exists within a market where stretched valuations are widespread rather than exceptional.
That premium is what makes Tesla the right stock to learn this methodology on. The same framework applies to any high-multiple company where price anticipates transformation.
Sum-of-parts analysis is the primary professional tool for valuing a company undergoing a business model transition. The logic is simple: if a company does two very different things, valuing it as a single entity obscures whether investors are paying a reasonable price for each piece.
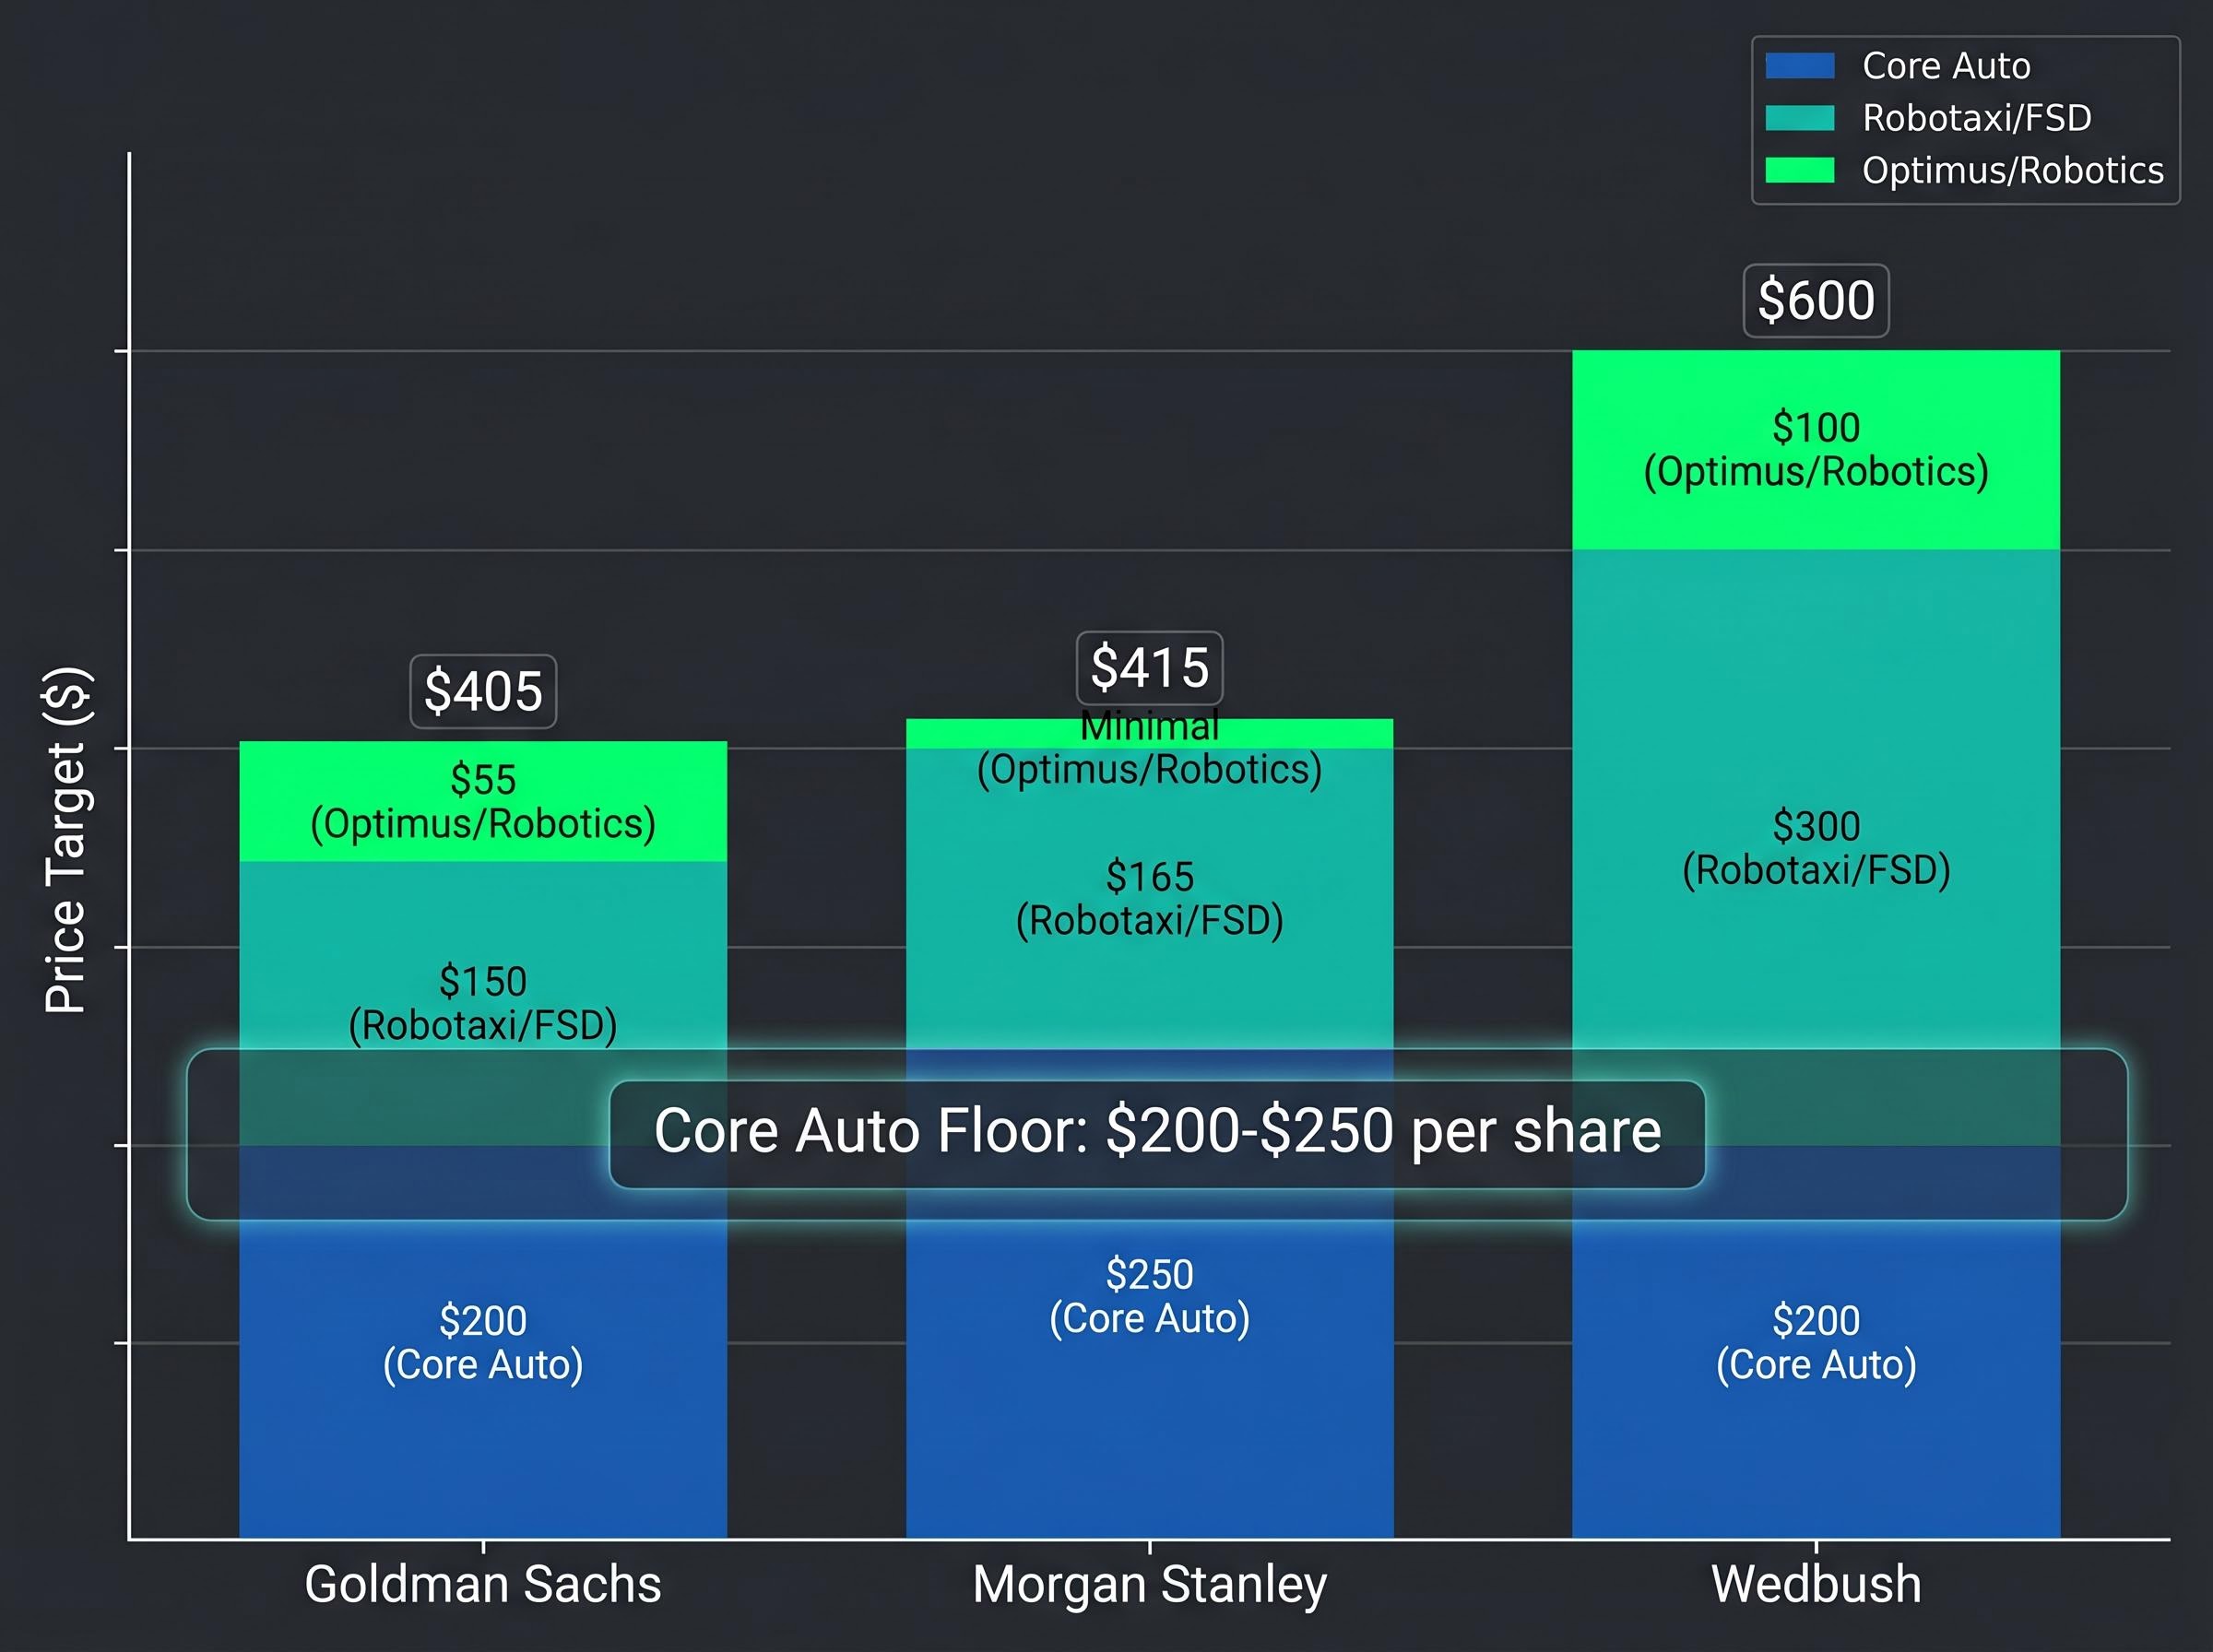
Applied to Tesla, every major bank starts the same way. Strip out the AI and robotics ambitions, and ask what the car business alone is worth. The answer, across Goldman Sachs, Morgan Stanley, and Wedbush, clusters between $200 and $250 per share. That range assumes above-average margins relative to Ford or GM, which is generous. It does not assume any robotaxi revenue, any Optimus revenue, or any FSD subscription upside.
That floor matters. It represents what Tesla is worth if none of the transformation narrative materialises.
The harder question is how to assign value to business lines that do not yet produce meaningful revenue. Traditional discounted cash flow (DCF) analysis struggles here because the inputs, adoption rates, pricing power, and deployment timelines, are speculative by definition. Goldman Sachs flags that Tesla’s $20 billion-plus 2026 capital expenditure programme (Tesla’s CFO guided above $25 billion) leads to negative free cash flow, a fundamental pressure point for any DCF model relying on near-term cash generation.
Morgan Stanley addresses this problem by employing a Black-Scholes variant, essentially pricing Tesla’s autonomy potential as a real option on its automotive platform. This approach assigns probabilistic value to unproven business lines without requiring certainty about outcomes.
The NYU Stern real options valuation framework formalises this approach by treating uncertain future business lines as financial options on an underlying asset, assigning probabilistic value without requiring certainty about adoption rates or deployment timelines, which is precisely why investment banks reach for it when conventional DCF analysis breaks down.
The methodological tension is real. Bulls use Monte Carlo simulations that weight high-upside total addressable market scenarios heavily. Bears apply hardware multiples to AI ambitions and see echoes of dot-com era overvaluation in the numbers.
| Firm | Core Auto | Robotaxi/FSD | Optimus/Robotics | Total Target |
|---|---|---|---|---|
| Goldman Sachs | $200/share | $150/share | $55/share | $405 |
| Morgan Stanley | $250/share | $165/share | Minimal | $415 |
| Wedbush | $200/share | $300/share | $100/share | $600 |
The table reveals the disagreement’s source. All three firms agree within a narrow band on what the car business is worth. The divergence comes entirely from how they price what does not exist yet. That insight, that uncertainty lives in the speculative layer, not the operating business, is what sum-of-parts analysis is designed to isolate.
Any scenario model for a high-multiple stock rests on three variables. Changing any one of them moves the output significantly. Changing all three simultaneously in the same direction produces not a modest error but a valuation that looks nothing like its opposite case. Tesla’s bull and bear assumptions illustrate exactly how this compounding works.
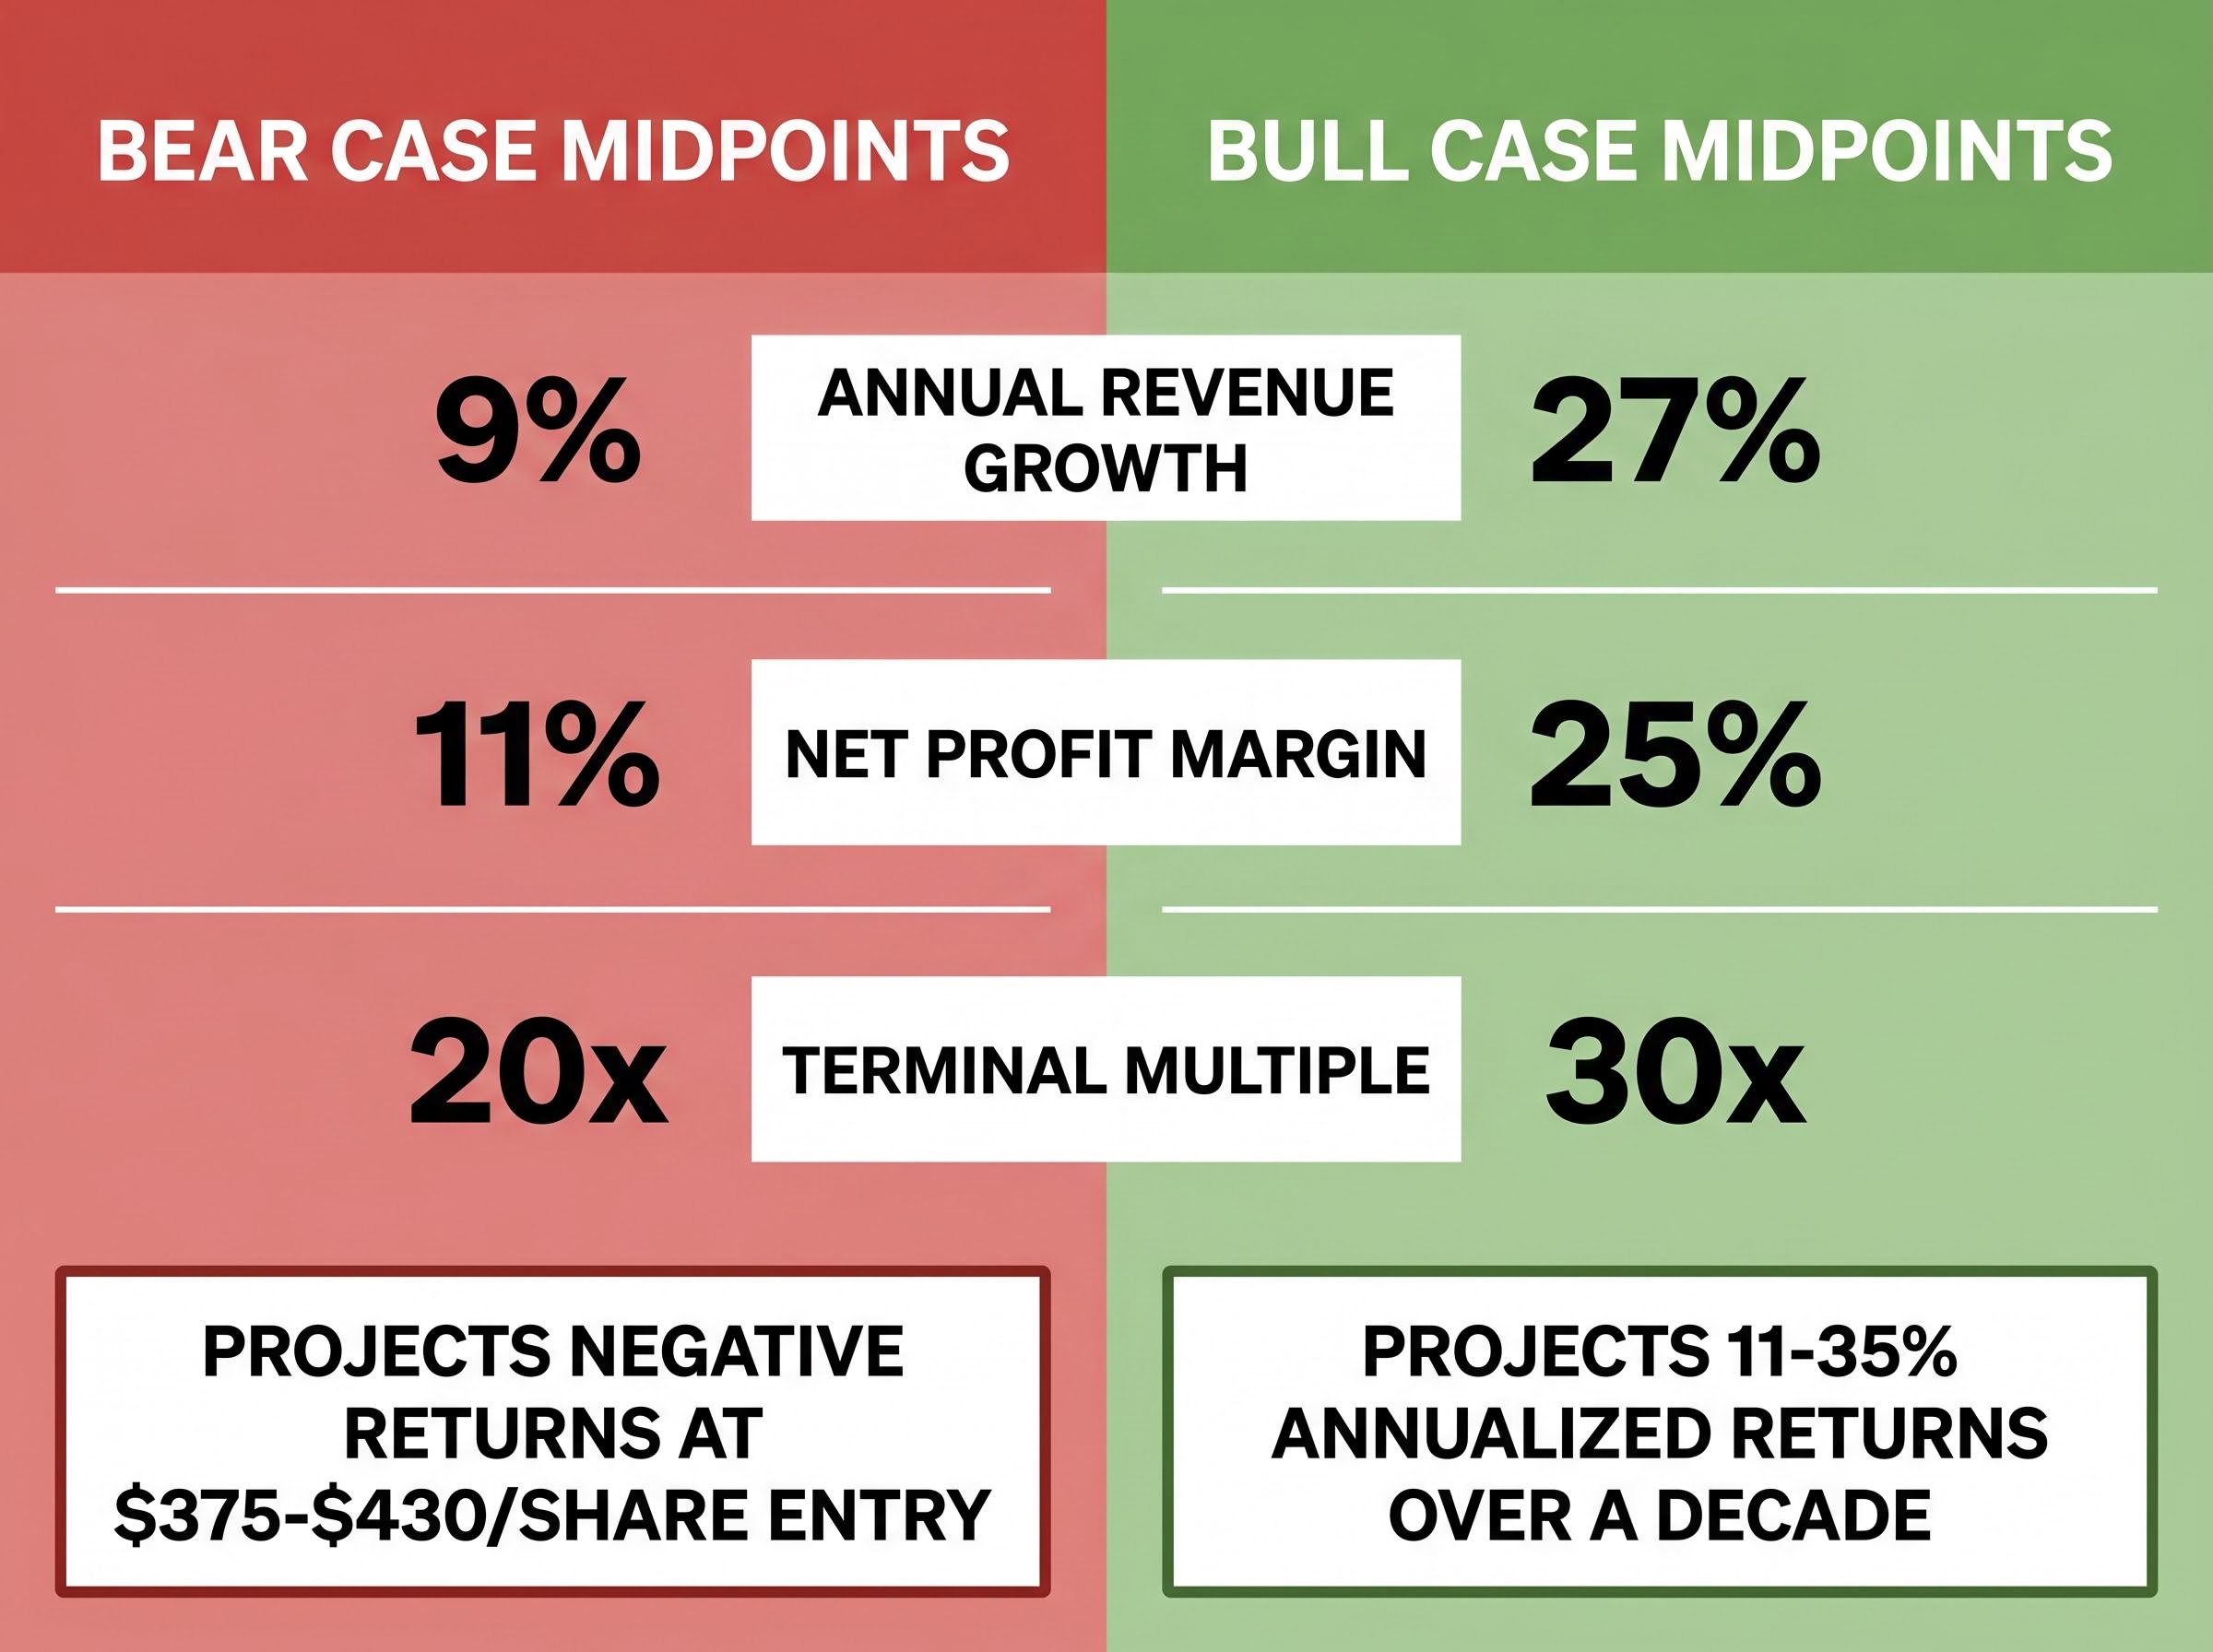
| Variable | Bear Case Range | Bear Midpoint | Bull Case Range | Bull Midpoint |
|---|---|---|---|---|
| Revenue Growth (Annual) | 6-12% | 9% | 20-35% | 27% |
| Net Profit Margin | 8-14% | 11% | 20-30% | 25% |
| Terminal Multiple | 18-22x | 20x | 25-35x | 30x |
The bull case, using all three midpoint assumptions, projects annualised returns of 11-35% over the next decade. The bear case, using its midpoints, projects negative returns at an entry price of approximately $375-$430 per share. Forward analyst EPS estimates reflect this divergence; they grow more than 5x from current levels, a trajectory that embeds substantial AI and autonomy assumptions into the earnings path.
Probability calibration across scenarios matters more than the revenue growth assumptions within any single scenario: shifting a robotaxi outcome from a 30% to a 10% probability weight moves the blended intrinsic value estimate further than adjusting annual growth rates by several percentage points within that scenario.
The framework’s value lies in its portability. For any high-multiple stock, the same three questions apply: what growth rate does this price require, what margin structure must emerge, and what multiple will the market assign when the projection period ends?
Entry price does not change what a company will become. It changes everything about what it returns to the investor. This distinction is easy to acknowledge in theory and remarkably easy to ignore in practice, particularly when conviction about a company’s future runs high.
Tesla’s own price history makes the point concrete. The stock was available at approximately $100 per share a few years before the current analysis. At that price, the bear case still produced acceptable returns. At $430, the bear case produces negative returns. The company’s prospects did not change between those two prices. What changed was how much of the upside the buyer had already paid for.
The asymmetry at today’s price is uncomfortable when stated plainly.
The bull case projects annualised returns of 11-35%. However, source analysis estimates the probability of the full bull scenario materialising at 5-10%. That leaves a 90-95% probability of achieving the bear or middle scenario, both of which project flat to negative returns at approximately $430 per share.
The bull thesis requires not just that Tesla succeeds but that it succeeds on a specific timeline, and Elon Musk’s track record on timelines introduces a measurable risk:
These are not narrative judgments. They are data points relevant to any probability-weighted valuation that depends on management’s stated timelines converting into operational results. The consensus price target of $406.65 implies modest downside from current levels at the mean, reinforcing that even the average professional view does not see the current price as offering a margin of safety.
The core auto floor of $200-$250 per share, agreed upon by Goldman Sachs, Morgan Stanley, and Wedbush, implies that 42-54% of Tesla’s current $430 price rests on unproven AI and robotics execution. A company can be genuinely exceptional and still be priced in a way that offers poor expected returns to a buyer at today’s level.
This distinction sharpens when examined against the competitive environment. Waymo (owned by Alphabet) served approximately 500,000 paid rides per week as of March 2026, demonstrating that Tesla does not have a monopoly on autonomous vehicle deployment. In the humanoid robot space, Figure AI reportedly raised $1.5 billion in a Series C round on 6 May 2026 and is considered ahead of Tesla’s Optimus on regulatory approvals and commercial deployment timelines.
The analyst response to Q1 2026 illustrates the point from a different angle. Stifel raised its target to $508. Two firms reduced targets. One held steady. Informed professionals, working from the same data, land in genuinely different places because they assign different probabilities to the same set of unproven outcomes. The disagreement is not a flaw; it is an accurate reflection of the uncertainty.
The distribution of outcomes is also not binary. The most likely path, according to the consensus analytical view, is partial execution: some robotaxi revenue, some Optimus progress, but not the full bull case. That middle scenario is precisely where entry price discipline matters most, because partial success at a $430 entry may still produce mediocre returns.
Before buying any high-multiple stock, three diagnostic questions structure the decision:
This process is not Tesla-specific. It applies to any stock where the price anticipates a transformation that has not yet been proven at scale.
At approximately $430 and a forward P/E near 208x, the current price requires a specific set of execution milestones, not as aspirations but as minimum conditions for the valuation to hold.
According to Barron’s (7 May 2026), Tesla’s valuation largely hinges on whether robotaxi operations can demonstrate EBITDA exceeding $5 billion in 2026, a threshold that would validate the market’s pricing of the transformation thesis.
The uncertainty remains genuine. As of early May 2026, the outcome is unresolved. What is resolved is the framework. Investors who have worked through this methodology now have a repeatable process: decompose the valuation into its component pieces, build explicit bull and bear scenarios on three core variables, stress-test the entry price against each scenario’s probability, and re-evaluate as each proof point arrives.
The Tesla case is the worked example. The methodology travels to every future high-multiple valuation decision.
For investors who want to apply this methodology to their own portfolio holdings, our dedicated guide to the six-step valuation framework covers ratio calculation, peer benchmarking, DCF scenario building, assumption stress-testing, and probability weighting in sequence, with worked examples drawn from Tesla’s live Q1 2026 data at each stage.
This article is for informational purposes only and should not be considered financial advice. Investors should conduct their own research and consult with financial professionals before making investment decisions. Past performance does not guarantee future results. Financial projections are subject to market conditions and various risk factors.
Sum-of-parts valuation breaks a company into its distinct business segments and values each one separately, which is especially useful when a company is undergoing a business model transition. Applied to Tesla, analysts strip out AI and robotics ambitions to find the core auto business is worth roughly $200-$250 per share, isolating exactly how much of the stock price depends on unproven future segments.
When conventional discounted cash flow analysis breaks down due to speculative inputs, analysts use real options pricing, treating uncertain future business lines as financial options on an underlying asset and assigning probabilistic value without requiring certainty about adoption rates or timelines. Morgan Stanley, for example, applies a Black-Scholes variant to price Tesla's autonomy potential.
Entry price does not change what a company will become, but it determines what returns an investor actually receives, because buying at a higher price means more of the future upside is already paid for. Tesla illustrates this directly: at $100 per share the bear case still produced acceptable returns, while at $430 the bear case projects negative returns despite the same underlying business prospects.
The three variables are revenue growth rate, net profit margin trajectory, and terminal valuation multiple at the end of the projection period. For Tesla, the bull case uses a 27% revenue growth midpoint, 25% net margins, and a 30x terminal multiple, while the bear case uses 9% growth, 11% margins, and a 20x multiple, producing dramatically different return outcomes from the same starting price.
At a forward P/E of approximately 208x, Tesla's valuation requires robotaxi EBITDA exceeding $5 billion in 2026, Optimus commercial deployment at meaningful scale, and FSD attach rates well above Goldman Sachs's 10% base case assumption. As of early May 2026, none of these thresholds had been confirmed, leaving the valuation dependent on future execution.


