How to Run a Scenario-Based Stock Valuation Analysis
23 mins ago

Tesla trades at roughly 200x forward earnings. Toyota trades at 8x. That gap is not a mistake or a market anomaly. It is a prediction, embedded in price, about a future that has not happened yet. The investor who ignores what a stock price is already assuming is taking a risk they cannot see.
Tesla’s Q1 2026 earnings and the analyst debate that followed offer a real-time window into one of the most consequential questions in stock valuation analysis: how does an investor value a company whose current price reflects a transformation that remains speculative? The bull case projects 20-35% annual revenue growth and software-like margins. The bear case projects the company grows at 6-12% and stays an automaker. At a share price of $411.27, the market has already placed its bet. The investor buying today is either agreeing with that bet or unknowingly accepting the downside.
This guide uses Tesla’s current valuation as a live case study to teach a broadly applicable method for thinking through bull and bear case scenarios, understanding what a stock price is already pricing in, and recognising why entry price is one of the most consequential decisions any investor makes.
A stock price does not measure what a company is worth today. It captures what the market collectively believes the company will generate in future cash flows, discounted back to the present. When a company trades at a high multiple, the market is not saying the business is excellent right now. It is saying the business will be dramatically more profitable later.
The principle that a stock price reflects the present value of future cash flows traces directly to John Burr Williams’ 1938 framework, which formalised the idea that income yield, not resale price, is the true foundation of investment value and that paying too much for any stream of future earnings is mathematically destructive to long-run returns.
Tesla at $411.27, with a market capitalisation of approximately $1.31 trillion, sits at roughly 200x its 2026 consensus earnings per share of $2.05. Toyota, a profitable automaker generating substantial cash flows today, trades at approximately 8x forward earnings.
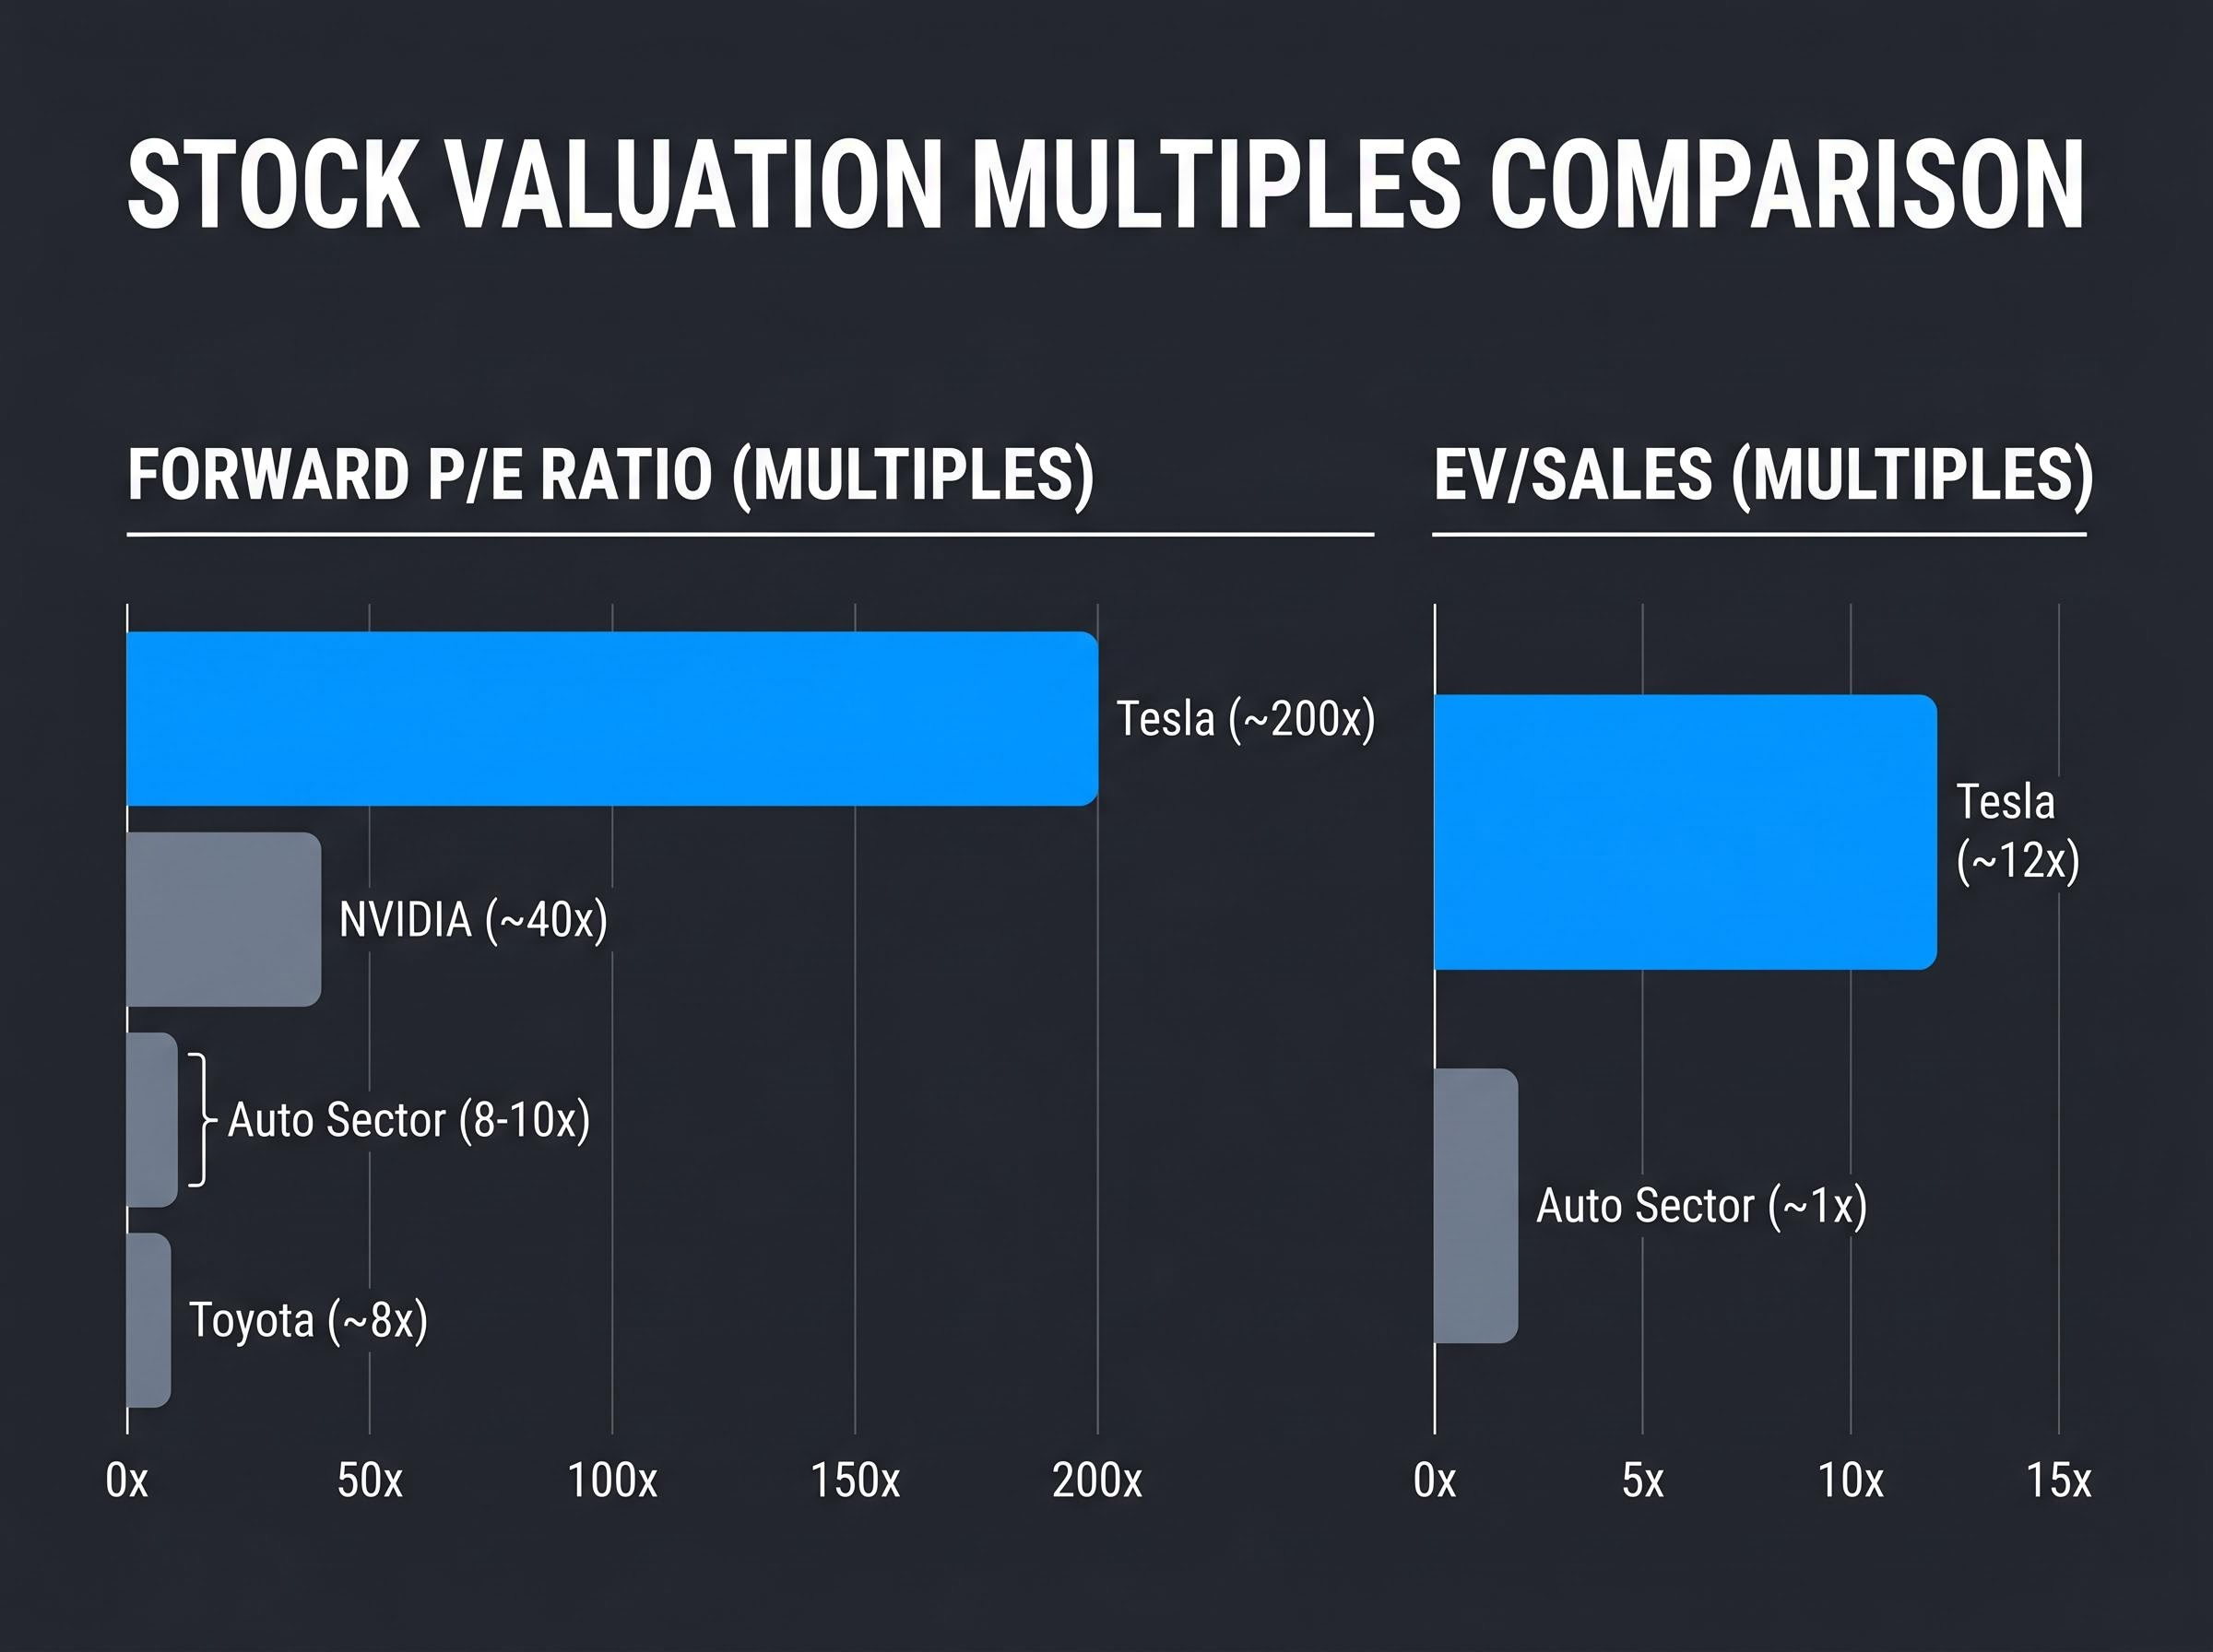
Tesla at ~200x forward earnings versus Toyota at ~8x: both are automakers, but the market is pricing two completely different futures. The gap is not a judgement of quality. It is a disagreement about what each company becomes.
That spread does not mean one company is overvalued and the other is fairly priced. It means two entirely different futures are being described by two different price tags. Agreeing or disagreeing with either valuation requires first understanding what each price already assumes.
NBER research on P/E ratios and long-run returns, including foundational work by Campbell and Shiller, demonstrates that starting valuation multiples are among the strongest predictors of subsequent investor returns over a 10-year horizon, which is precisely why the entry price debate around Tesla carries more weight than typical stock selection discussions.
A price-to-earnings (P/E) ratio divides a company’s share price by its earnings per share. It is shorthand for how much an investor is willing to pay today for each dollar of current earnings. A 200x P/E means the buyer is paying $200 for every $1 the company earns right now. That is rational only if future earnings grow dramatically enough to justify the premium.
Enterprise value to sales (EV/Sales) performs a similar function but measures how the market values each dollar of revenue rather than profit. Neither metric is a quality score. Both are expressions of expectation.
Any forward-looking valuation model rests on three interconnected inputs. Change one, and the output shifts substantially. Change all three, and the range of outcomes becomes enormous. Understanding these levers is the first step toward interrogating any price target.
The three inputs are:
These three levers compound over a 10-year horizon. Modest differences in assumptions produce dramatically different endpoints. A company growing revenue at 27% annually with 25% margins and a 30x exit multiple occupies a different financial universe from one growing at 9% with 11% margins and a 20x exit multiple, even if both start from the same revenue base today.
| Input | Bull Case | Bear Case | Implied Story |
|---|---|---|---|
| Revenue Growth (Annual) | 20-35% (midpoint ~27%) | 6-12% (midpoint ~9%) | Bull: AI and robotics revenue arrives at scale. Bear: Tesla remains an automaker. |
| Net Profit Margin | 20-30% | 8-14% | Bull: Software-like margins emerge. Bear: Margins stay above legacy auto but remain hardware-like. |
| Exit Multiple | 25-35x | 18-22x | Bull: Market still prices growth at exit. Bear: Mature-company multiple applied. |
Even the bear case margins of 8-14% sit above Ford and GM, reflecting Tesla’s structural cost advantages. The disagreement is not about whether Tesla is a better automaker. It is about whether Tesla stops being an automaker at all.
The numbers make the argument more clearly than any narrative can. Apply the bull and bear inputs from the previous section to Tesla’s current share price, and the range of projected outcomes is not a gentle spread. It is a chasm.
| Scenario | Assumed Inputs | Estimated 10-Year Annualised Return |
|---|---|---|
| Bull Case | Revenue growth ~27%, margins 20-30%, exit multiple 25-35x | Approximately 11-35% |
| Bear Case | Revenue growth ~9%, margins 8-14%, exit multiple 18-22x | All projected outcomes negative at the ~$375-$411 price range |
The bear case does not require Tesla to collapse. It requires only that the AI and robotics transformation does not materialise at the scale and timeline currently priced in. If Tesla grows at 9% annually with healthy but hardware-level margins, the stock is still overvalued at $411.
A probability-weighted scenario framework assigns explicit likelihoods to each outcome rather than treating bull and bear cases as equally plausible, a step that converts the exercise from a range of possible returns into an expected return calculation that investors can compare directly against a risk-free alternative.
Consensus analyst EPS estimates reinforce the tension. Over the past 90 days, 2026 consensus EPS has declined approximately 3% and 2027 estimates have fallen roughly 13%, according to Yahoo Finance data. That slippage is modest, not dramatic, but the direction matters when the starting multiple is 200x.
An investor who purchased Tesla at approximately $100 a few years ago and an investor buying at $411 today may own the same company. If Tesla executes identically for both, their returns will be entirely different. The company’s future does not change based on when you buy. Your return does.
Entry price is not a timing trick. It is the single variable that determines whether a correct thesis about a company translates into a profitable investment.
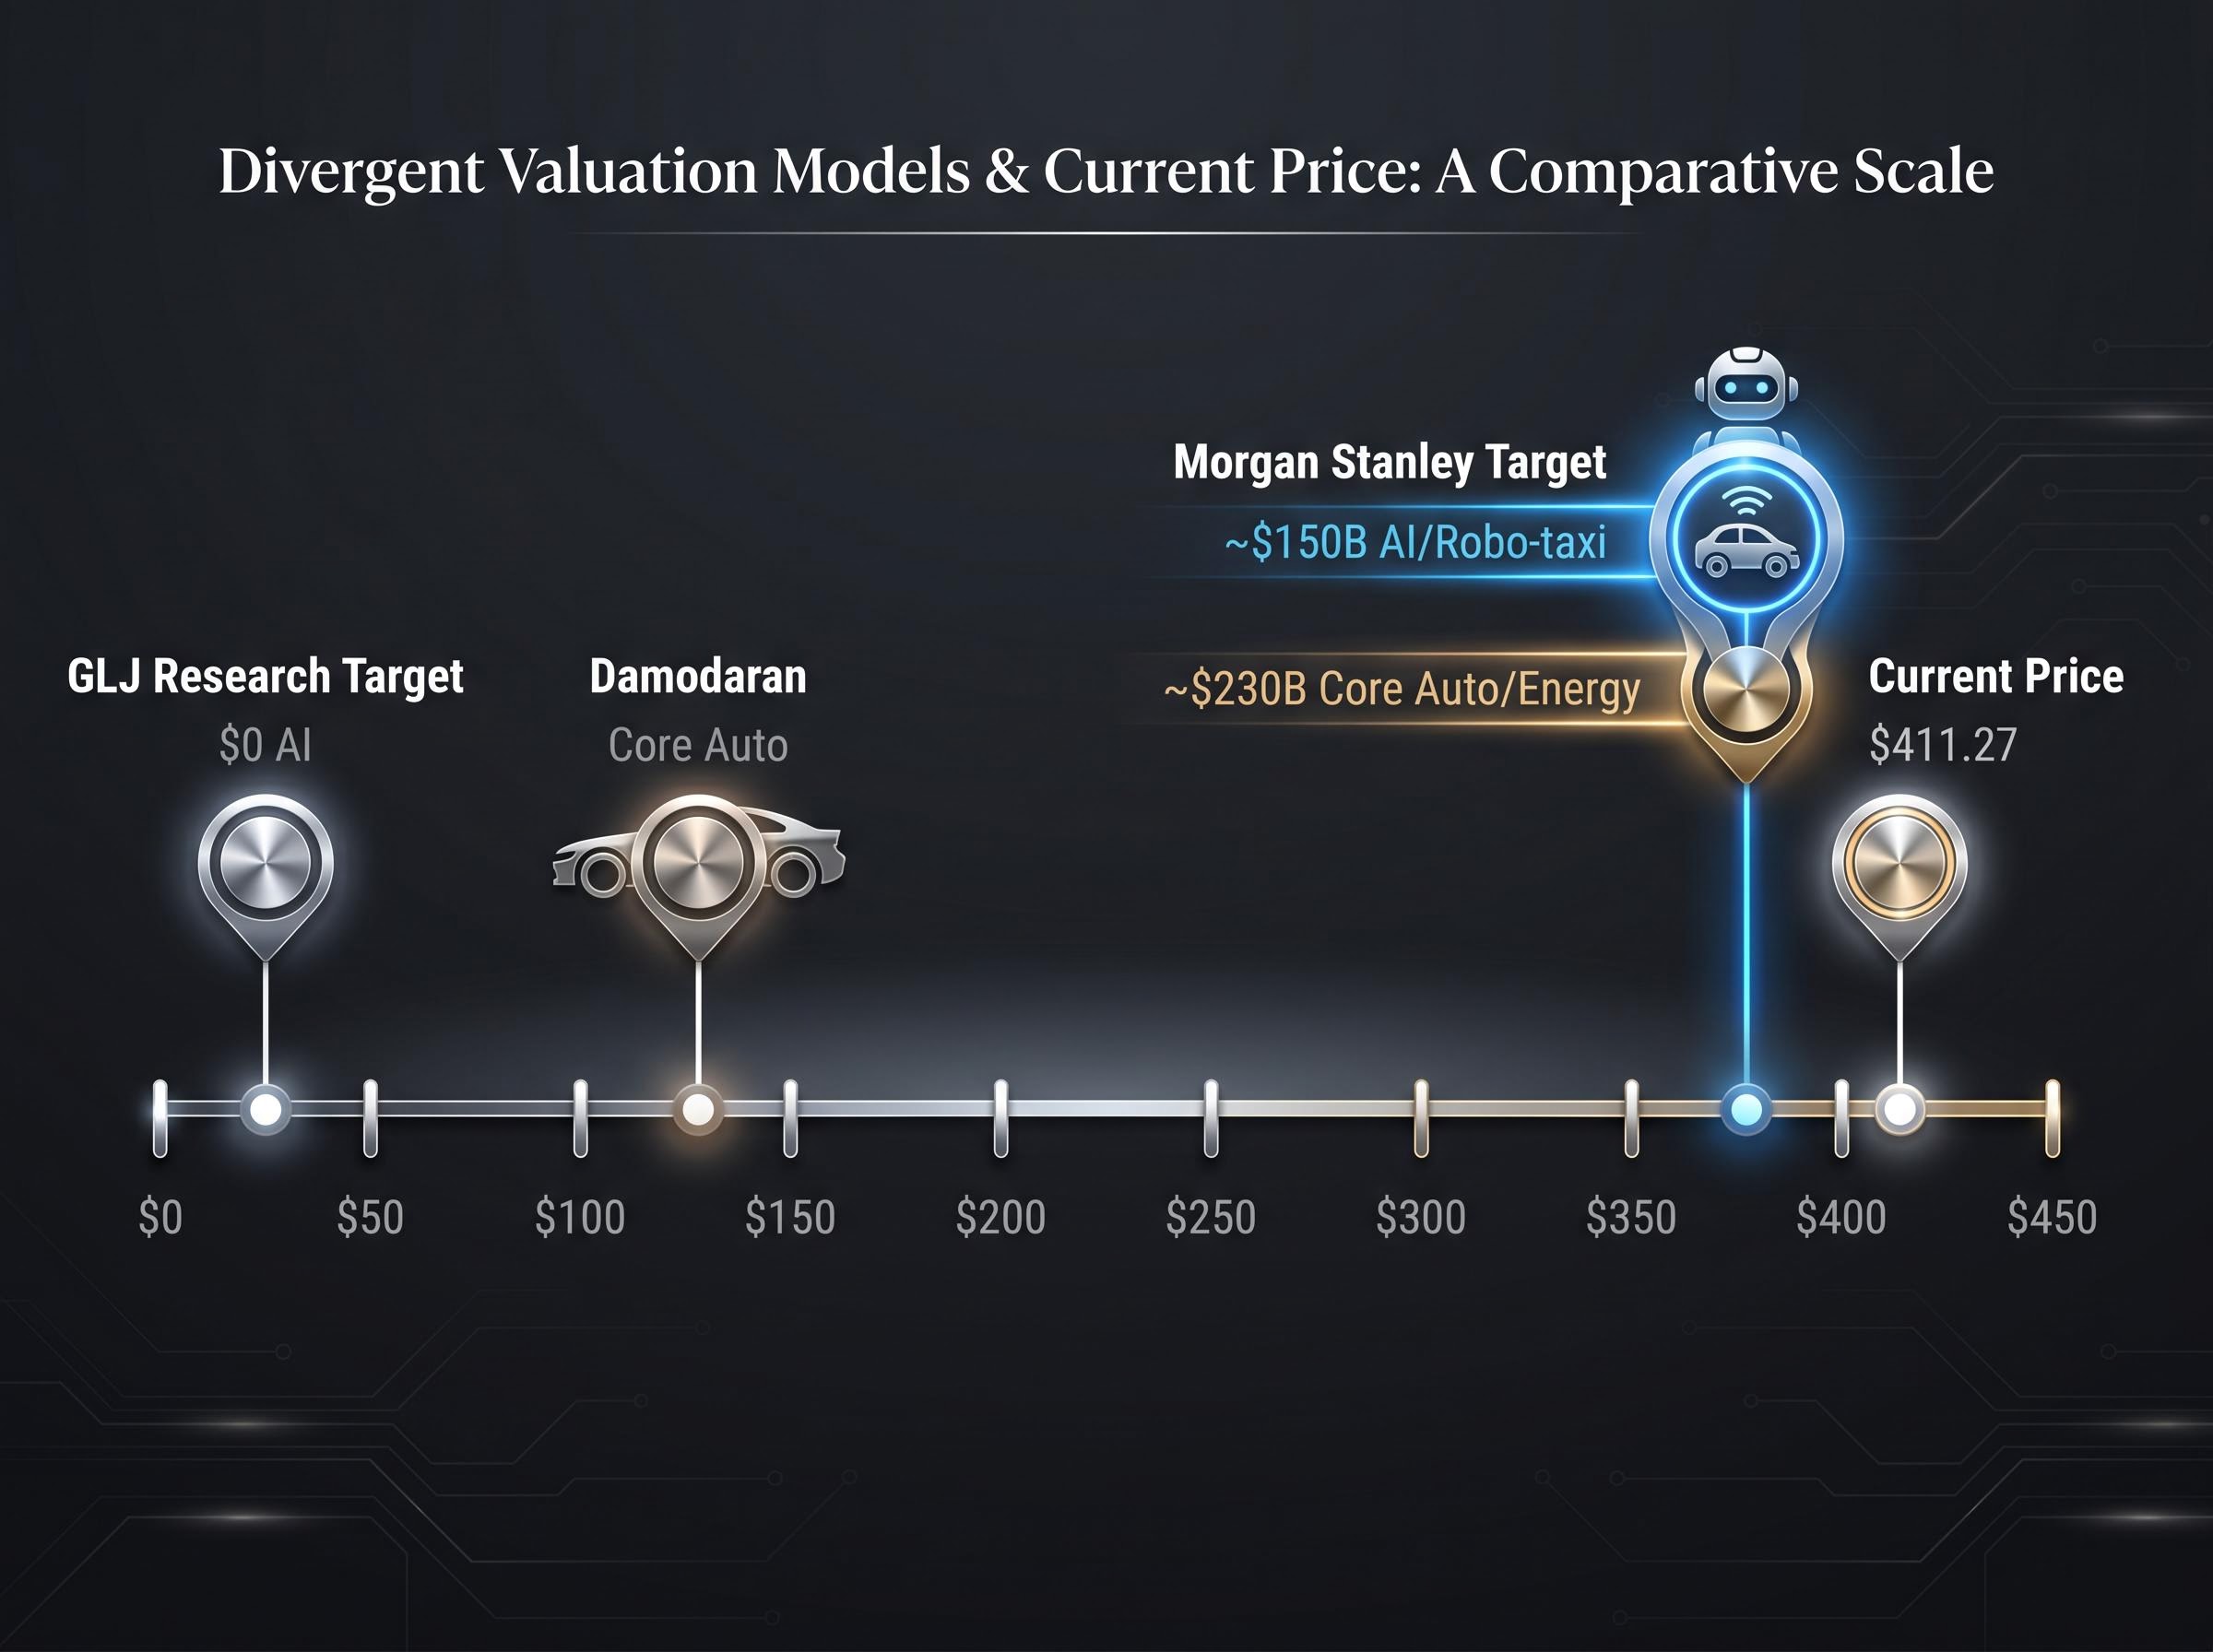
At $411.27, the investor is not buying a car company. The market capitalisation of $1.31 trillion embeds specific claims about revenue streams that do not yet exist at commercial scale. Disaggregating those claims is one of the most useful exercises an investor can perform on any high-multiple stock.
Morgan Stanley’s Adam Jonas, in a post-earnings note around 23 April 2026, reportedly attributed approximately $150 billion in enterprise value to robo-taxi and AI segments and roughly $230 billion to core auto and energy, arriving at a $380 price target. That framework assigns nearly 40% of the company’s value to products without proven commercial revenue in 2026.
At the opposite end, GLJ Research’s Gordon Johnson assigns $0 to AI and robotics segments, applies an 8x P/E to core automotive earnings, and targets $25 per share.
Aswath Damodaran, the New York University finance professor whose valuation models are widely referenced, has estimated Tesla’s core auto intrinsic value at approximately $130 per share.
The intrinsic value floor for Tesla’s core automotive and energy business, estimated by GuruFocus at approximately $283.94 per share, defines the downside case more precisely than any bear scenario model: it represents what the company is worth if the AI and robotics premium is assigned zero probability and only current-generation fundamentals are discounted forward.
Damodaran has characterised the AI premium embedded in Tesla’s price as reflecting growth assumptions that are difficult to justify from first principles.
The disagreement is not about whether Optimus and the Cyber Cab are interesting products. It is about whether revenue from those products arrives in a timeframe that justifies a premium paid today.
Three developments are currently testing the bull-case timeline:
A two-year delay to monetisation does not merely postpone revenue. It compounds through the discount rate, reducing the present value of those future cash flows and directly pressuring the multiple the market can rationally assign today. Tesla’s projected 2026 capital expenditure exceeds $25 billion, and the company’s current free cash flow trajectory is negative, meaning the AI bet is being funded from the balance sheet while the payoff recedes.
Four valuation methods appear repeatedly in Tesla coverage. Each answers a different question, and each produces a different number for the same company. That is not a flaw in the tools. It is the point.
| Method | What It Measures | Tesla-Specific Figure | Primary Limitation |
|---|---|---|---|
| P/E Ratio | Price per dollar of earnings | ~200x forward (vs. auto sector 8-10x, NVIDIA ~40x) | Distorted when earnings are suppressed by heavy investment |
| EV/Sales | Enterprise value per dollar of revenue | ~12x (vs. auto sector ~1x) | Requires margin assumptions to translate revenue into profit |
| Discounted Cash Flow (DCF) | Present value of projected future free cash flows | Bull and bear models produce among the widest gaps of any large-cap stock | Highly sensitive to terminal growth rate and discount rate assumptions |
| Sum-of-the-Parts (SOTP) | Separate valuations of each business segment, aggregated | Morgan Stanley: ~$150B AI + ~$230B core. GLJ: $0 AI + core only. | Segment boundaries are subjective; AI revenue is not yet separable |
Professional analysts often disagree not because they are looking at different data but because they are feeding different assumptions into the same tools. RBC’s Tom Narayan and GLJ Research’s Gordon Johnson both have access to Tesla’s public filings. They arrive at targets of $446 and $25 respectively because they disagree on which future materialises.
When a company invests heavily and suppresses near-term earnings, trailing P/E inflates to levels that obscure rather than illuminate. Tesla’s EPS has declined more than 90% from its peak before recovering in forward estimates, making any backward-looking earnings multiple misleading.
Forward P/E is more relevant, but it depends entirely on which earnings estimate you accept. Bulls cluster around $3.00+ for 2026 EPS; bears estimate closer to $1.50. At $411, that produces a forward P/E range of approximately 137x to 274x. The “multiple” is only as reliable as the denominator.
Tesla is one company. The method applies everywhere. Before buying any stock trading at a premium to its current fundamentals, four questions deserve answers:
Margin of safety discipline, applied systematically before any position is opened, is the mechanism that converts the gap between intrinsic value and current price from an abstract observation into a concrete rule: only buy when the current price gives you enough buffer that even a partially wrong thesis does not permanently impair capital.
The company’s future does not change based on when you buy. Your return does. Entry price is not a secondary consideration. At certain valuation levels, it matters more than stock selection itself.
Consider Elon Musk’s track record on the timelines currently embedded in Tesla’s price. In 2016, he claimed all Tesla vehicles had hardware for full autonomy. In 2019, he projected one million robo-taxis by 2020. In 2021, he indicated Optimus would be deployment-ready by 2022. Each timeline slipped materially. This does not invalidate the vision, but it directly affects the present value of cash flows priced into today’s share.
Analyst consensus currently holds at 19 Buy, 17 Hold, 5 Sell across 41 analysts, with an average price target of $398.42 versus the current $411.27, according to MarketBeat data as of 8 May 2026. The average analyst view prices in modest downside, not upside, at current levels. Forward estimates project EPS growing more than 5x from current levels, meaning even the consensus already embeds substantial execution on AI and autonomy.
Most companies in transition do not fully realise the bull case or fully collapse into the bear case. Positioning for a partial-execution outcome, where some speculative revenue arrives but later and smaller than projected, is often the most intellectually honest approach.
At $411 per share, the investor is not buying what Tesla is. They are buying a probability-weighted bet on what Tesla might become. The price paid determines whether that bet is reasonable.
The uncertainty is genuine. The analyst community is split. Timeline risks are documented. Competitive pressures from Waymo and regulatory friction from the California DMV are real. And yet, the bull case is not obviously wrong if execution accelerates. That is what makes the valuation question interesting rather than settled.
The applicable lesson extends beyond any single ticker. Identify one stock you currently hold or are considering. Work through the four questions above. Reverse-engineer what the price assumes. Map the bull and bear scenarios. Calculate the gap between the core business value and the current price. The answer will not tell you whether to buy or sell. It will tell you what you are betting on, and whether you knew you were making that bet.
This article is for informational purposes only and should not be considered financial advice. Investors should conduct their own research and consult with financial professionals before making investment decisions. Past performance does not guarantee future results. Financial projections are subject to market conditions and various risk factors.
Stock valuation analysis is the process of determining what a company is worth based on its expected future cash flows, growth rates, and profit margins. It matters because a stock price reflects the market's prediction about the future, and paying too much for even a great company can produce poor returns.
A 200x P/E ratio means investors are paying $200 for every $1 the company currently earns, which is only rational if future earnings grow dramatically enough to justify that premium. For Tesla, the multiple reflects the market pricing in speculative revenue from AI, robotics, and autonomous vehicles that does not yet exist at commercial scale.
You can reverse-engineer a stock price by identifying the revenue growth rate, net profit margins, and exit valuation multiple that would be required to justify the current share price over a defined horizon, such as 10 years. If those assumptions require near-perfect execution, the margin of safety is thin and the downside risk is substantial.
The three core inputs are the annual revenue growth rate, the net profit margin, and the exit valuation multiple applied at the end of the projection period. Small differences in each input compound significantly over a 10-year horizon, producing dramatically different return outcomes from the same starting price.
Two investors can own the same company with identical future execution and still experience completely different returns depending on the price they paid. Entry price is the single variable that determines whether a correct thesis about a company's future translates into a profitable investment.