Why AI Infrastructure, Not Chips, Is Where Durable Value Sits
24 mins ago

At roughly $392 per share in early May 2026, Tesla trades at approximately 359 times trailing earnings. That multiple is not a typo. It is a precise statement about what kind of company the market believes Tesla will become, and it makes stock valuation analysis both more difficult and more instructive than almost any other case available right now.
Tesla’s Q1 2026 earnings beat analyst expectations across revenue, earnings per share, and gross margin. By conventional measures, the quarter was strong. Yet the analyst price target range runs from $119 to $600, the widest dispersion on record for a large-cap name. That gap is not noise. It is a signal that Tesla’s current price cannot be explained by existing financial results alone. It can only be explained by the scenarios investors believe are plausible for the next decade.
This article uses Tesla’s Q1 2026 numbers as a live teaching case to walk through how to construct bull and bear case scenarios, translate assumptions into projected return outcomes, and understand why the price paid at entry is one of the most consequential variables in any investment. The methodology applies to any company in transition, not just Tesla.
A strong quarter should narrow the debate about what a company is worth. Tesla’s Q1 2026 beat did the opposite. It gave both bulls and bears fresh ammunition, and the analyst price target range widened rather than compressed.
The reason is structural. Traditional valuation anchors, price-to-earnings, price-to-sales, enterprise value to EBITDA, are designed to measure what a business earns today and assign a multiple to that earnings stream. They work when the company’s current financials approximate its future earnings profile. They break down completely when the market is pricing in a future business model that looks nothing like the current one.
Traditional valuation models such as the dividend discount model are built around a company’s current income stream, which is precisely why they produce paradoxical results when applied to a business like Tesla, where the market is pricing a future earnings profile that bears little resemblance to today’s financials.
Tesla’s trailing GAAP EPS of $1.09 against a stock price of roughly $392 produces that 359x trailing P/E. That multiple is not an endorsement of current earnings. It is a market-implied bet on a future earnings profile, one that includes autonomous vehicle revenue, humanoid robotics at commercial scale, and operating margins several times the current 4.2%.
Two concepts give investors vocabulary for what they are observing. The first is “multiple expansion risk”: the danger that a stock priced for perfection has no room for the multiple to grow, meaning all upside must come from earnings delivery. The second is “narrative premium”: the portion of a stock’s price attributable to a story about the future rather than to current financial results.
$119 to $600. That is not uncertainty. It is a binary-outcome bet expressed in price, per data compiled by Intellectia.ai.
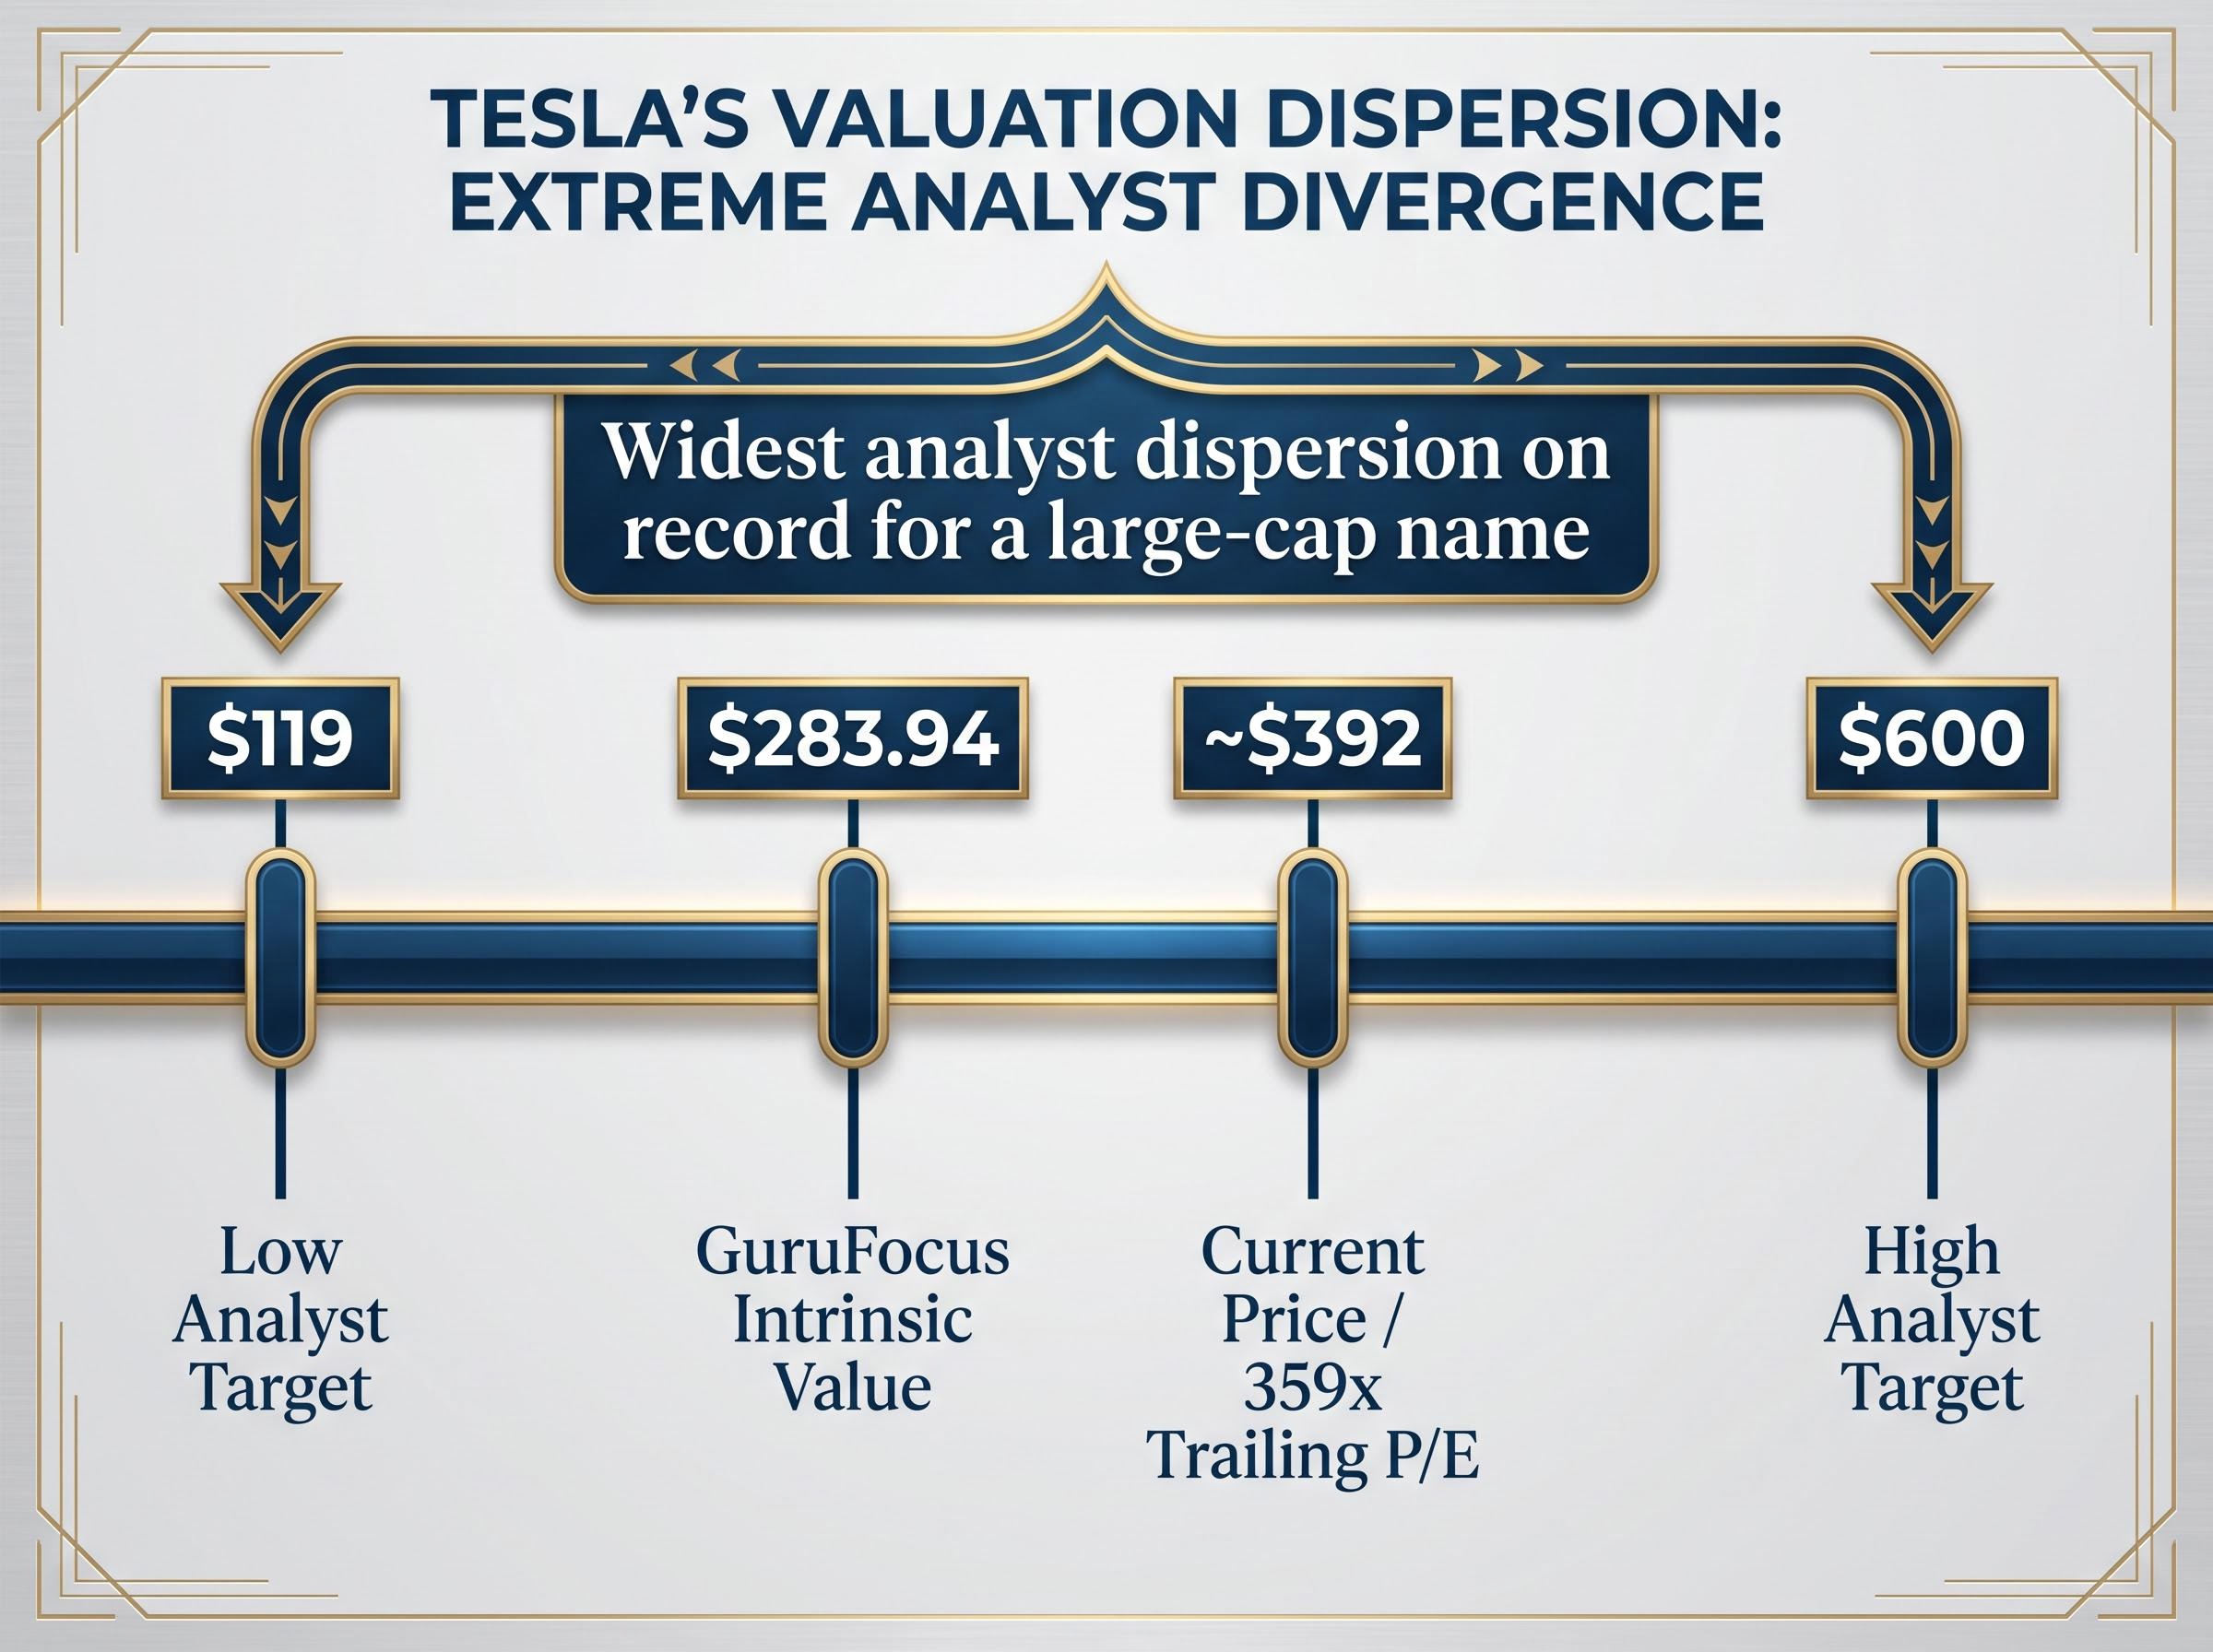
GuruFocus estimates Tesla’s intrinsic value at $283.94, against a market price of $398.73. That implies roughly 40% overvaluation on a fundamentals basis.
The distinction between what traditional models measure and what narrative-premium stocks price in is worth isolating:
Before evaluating any high-multiple stock, investors need a mental model for why the multiple exists. Tesla provides that model in real time.
Before scenario analysis can begin, the factual baseline needs to be clear. Here is what Tesla actually delivered in Q1 2026.
| Metric | Q1 2025 | Q1 2026 | Change | vs. Consensus |
|---|---|---|---|---|
| Revenue | $19.355B | $22.387B | +16% YoY | Beat ($21.417B est.) |
| Non-GAAP EPS | $0.27 | $0.41 | +52% YoY | Beat ($0.37-$0.40 est.) |
| GAAP Gross Margin | 16.3% | 21.1% | +480 bps | Beat |
| Operating Margin | Lower YoY base | 4.2% | Improved | In line |
| Deliveries | 336,681 units | 358,023 units | +6% YoY | Mixed |
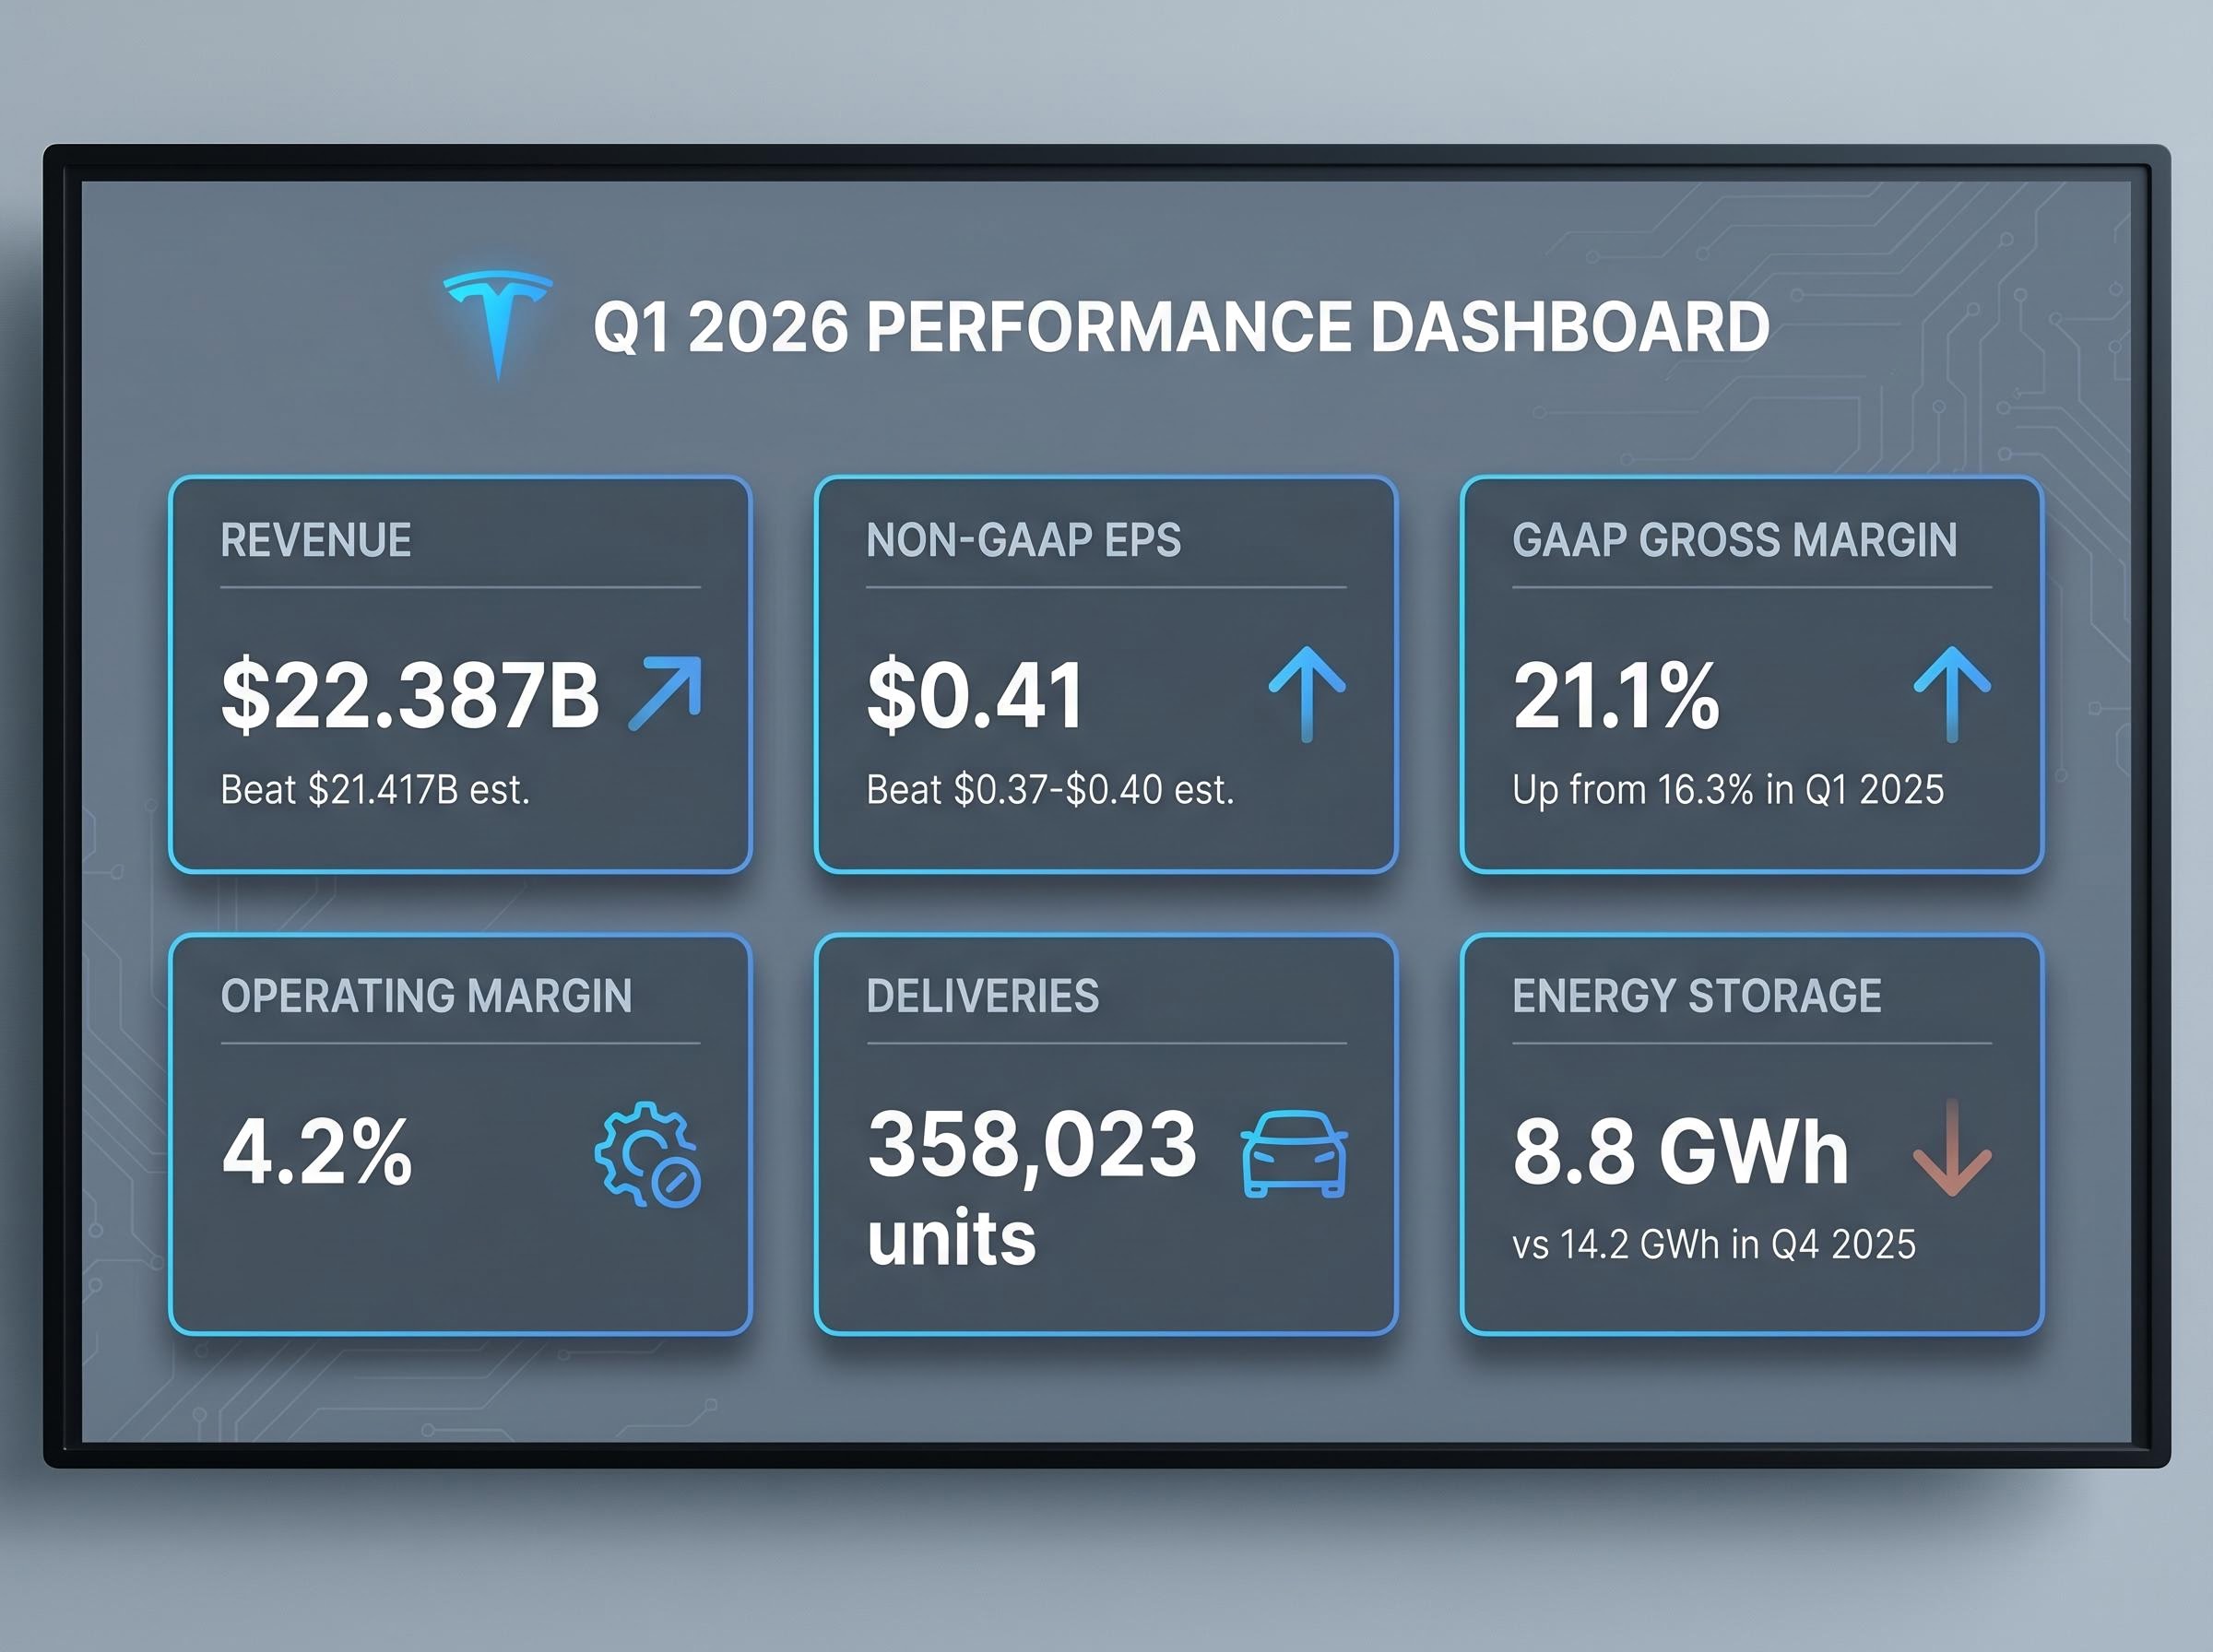
The headline numbers paint a clear picture of a beat quarter. Revenue of $22.387 billion exceeded consensus by nearly $1 billion. Non-GAAP EPS of $0.41 represented 52% year-over-year growth. Gross margin recovered to 21.1% from 16.3%, a 480 basis point expansion that suggested pricing discipline rather than aggressive discounting.
Then the contradicting signals arrive. Deliveries grew 6% year over year, but the gap between production and deliveries exceeded 50,000 units, described by Investing.com as the largest in Tesla’s history. That raises questions about near-term demand absorption even amid headline growth.
8.8 GWh in Q1 2026 versus 14.2 GWh in Q4 2025: a 38% quarterly drop in what investors had considered a diversification anchor.
The energy storage decline complicates the bull case for business line diversification. A beat quarter, in other words, does not resolve the valuation debate. It frames the starting conditions for the scenario exercise that follows.
Most retail investors reach for a single analyst price target when evaluating a stock. Scenario analysis asks a more useful question: what has to be true for this price to be correct?
Scenario analysis is not a forecasting exercise. It is a structured method for identifying which assumptions are load-bearing in a valuation. The discipline forces the investor to name the variables, assign ranges to each, and calculate the outcomes that different combinations produce.
Three inputs drive every forward scenario:
Small changes in any single variable compound into dramatically different outcomes over a decade, especially when the starting multiple is elevated.
Sum-of-the-parts methodology offers an alternative lens for high-optionality companies like Tesla, assigning separate valuation multiples to the automotive business, the energy segment, and the pre-revenue robotaxi and robotics platforms before aggregating them into a single implied share price.
| Assumption | Bull Case Range | Bear Case Range |
|---|---|---|
| Revenue Growth Rate | 20%-35% (midpoint ~27%) | 6%-12% (midpoint ~9%) |
| Net Profit Margin | 20%-30% | 8%-14% |
| Exit Valuation Multiple | 25x-35x | 18x-22x |
| Projected Annualised Return (10yr) | ~11%-35% | Negative at ~$375 entry |
The bull case requires revenue growth above 20% annually, net margins expanding to 20%-30%, and the market still assigning a premium multiple a decade from now. Under those conditions, annualised returns could range from roughly 11% to 35% over ten years.
The bear case tells a different story. At 6%-12% revenue growth and 8%-14% net margins with a compressed exit multiple, all projected return outcomes turn negative at an entry price of approximately $375.
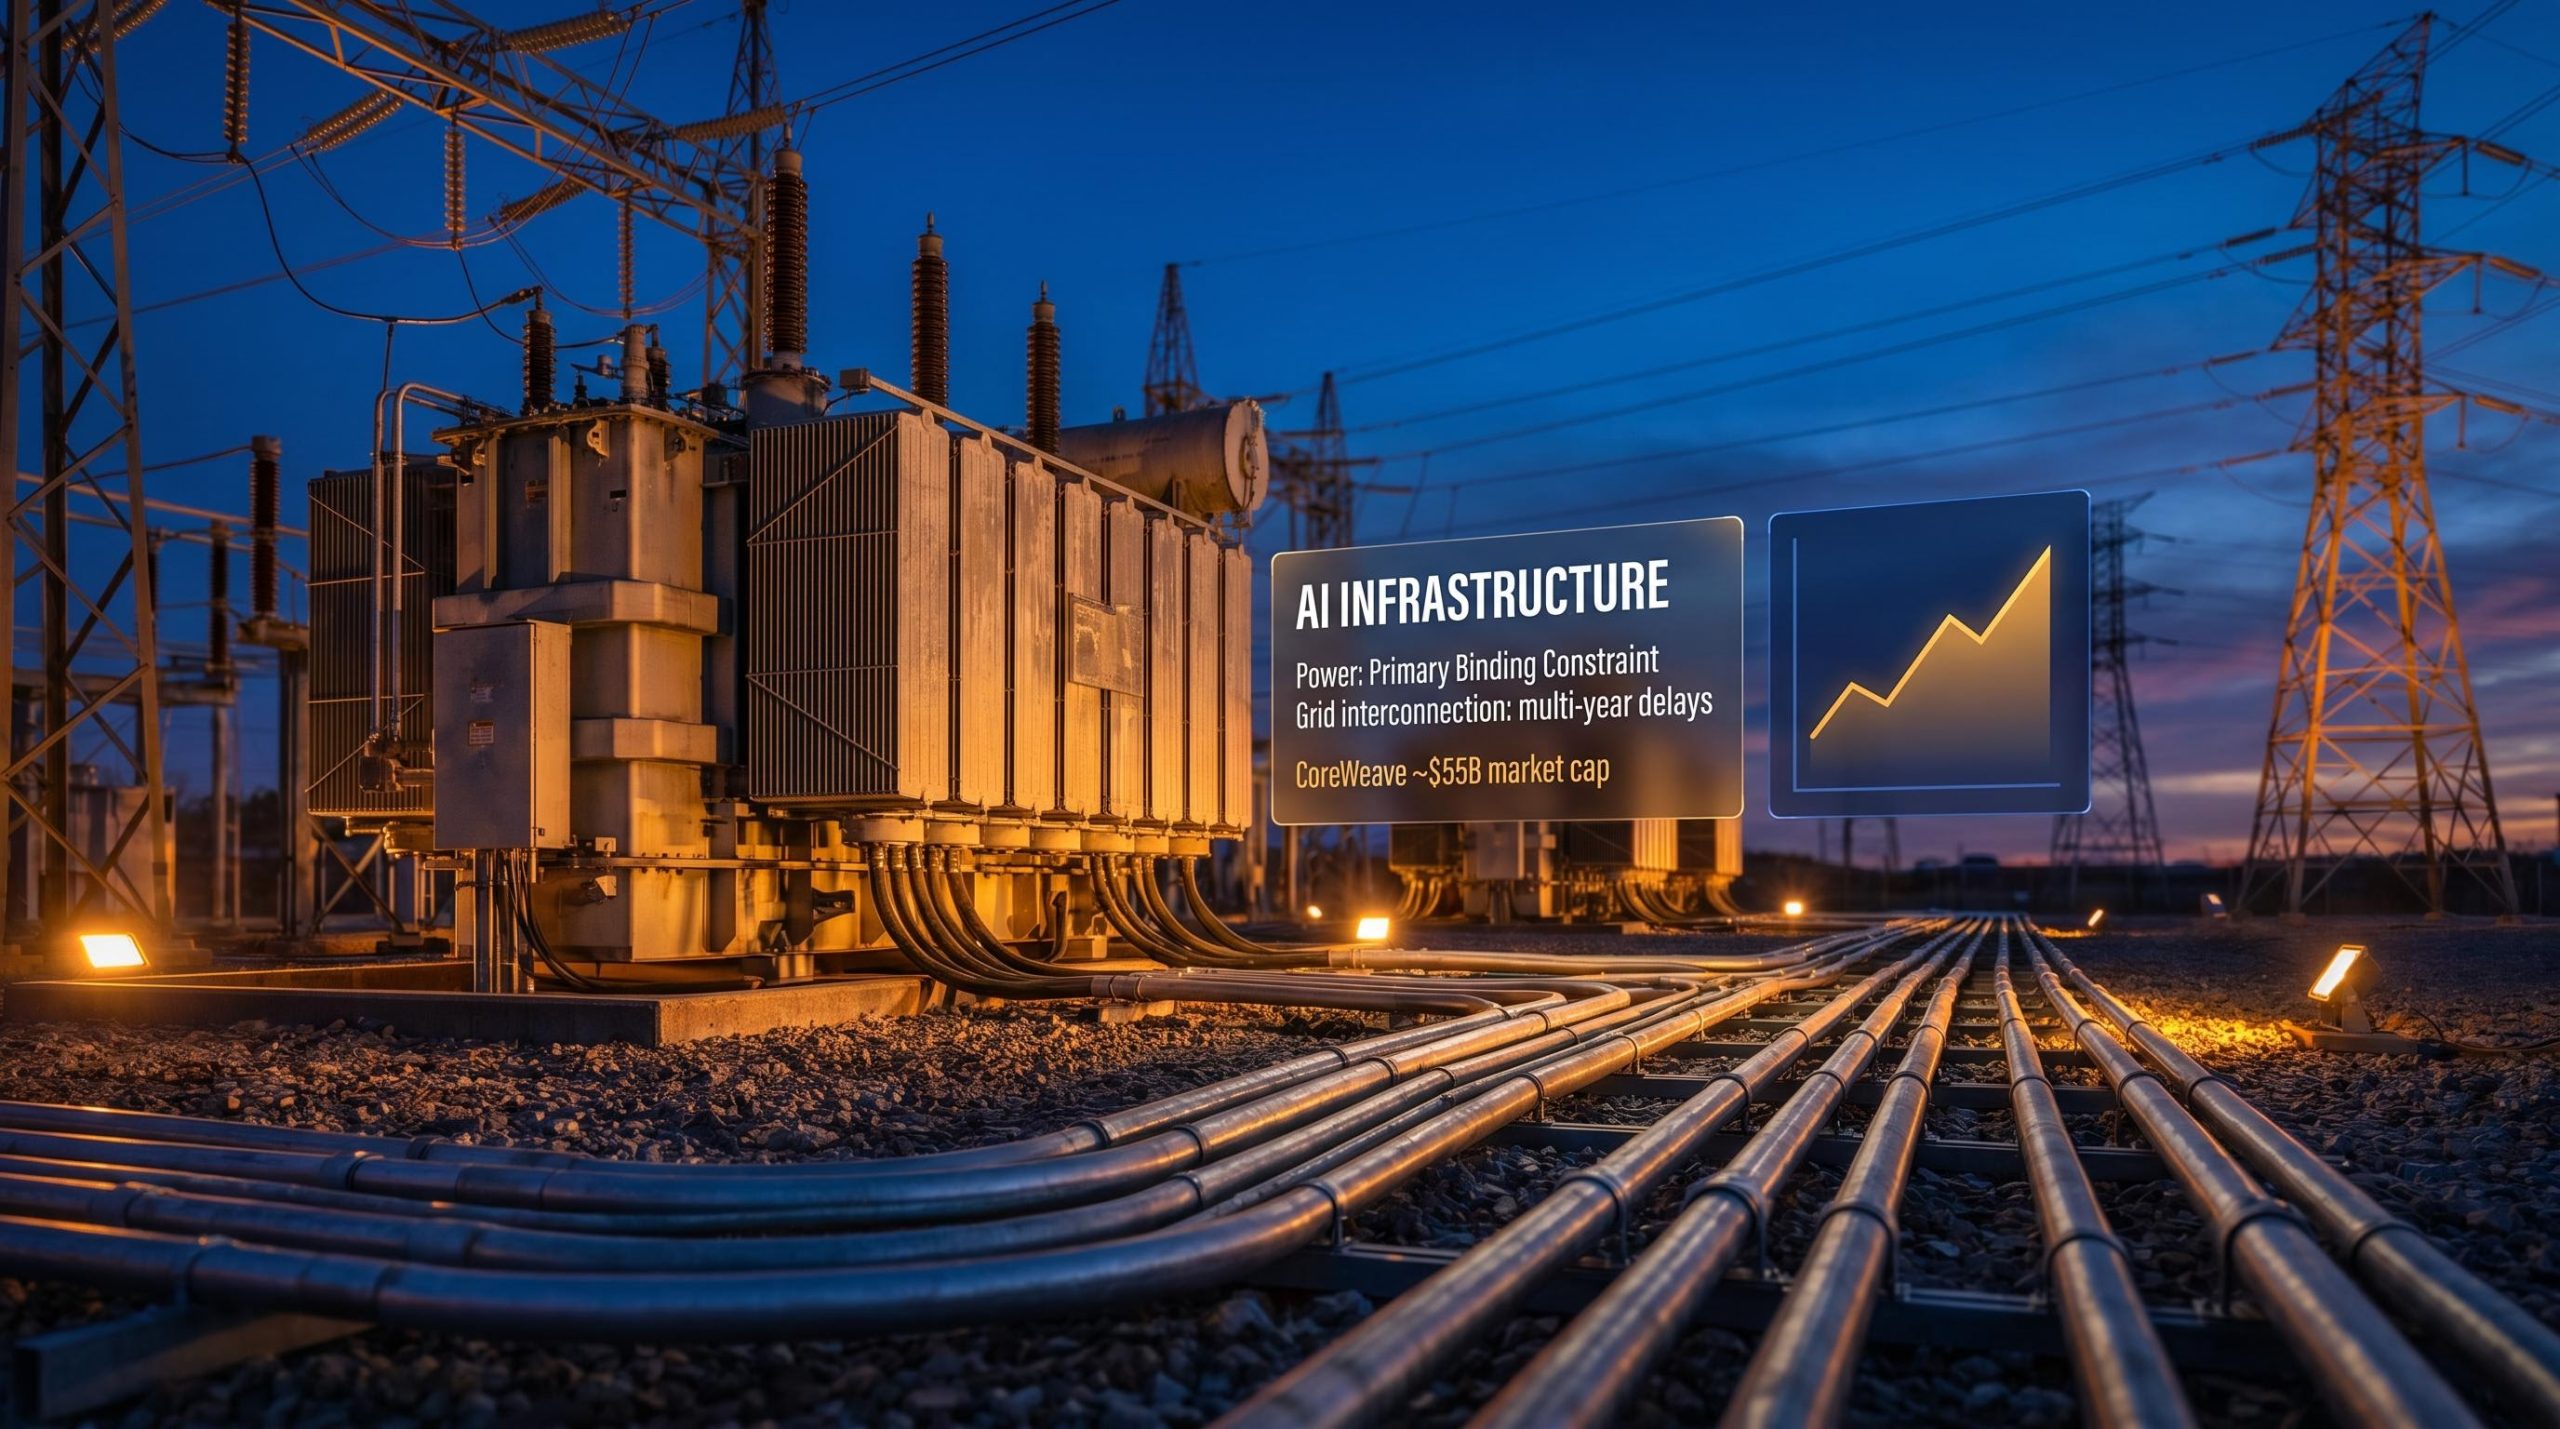
Historical analogues offer context. Nvidia in 2023-2024 saw a bull case AI thesis resolve upward, producing exceptional returns for investors who held through the uncertainty. Meta in 2022-2023 experienced the opposite trajectory initially, with narrative-driven capex concerns creating a significant drawdown before the business execution resolved the debate.
At 359x trailing P/E, even the bull case requires exceptional execution just to generate moderate returns. The maths of compounding works differently at an elevated starting multiple.
Consider two investors buying the same underlying business with identical future outcomes. One enters at roughly $100 per share (a price Tesla traded at a few years prior). The other enters at $392. The company delivers the same revenue growth, the same margins, the same eventual earnings. The investor who entered at $100 compounds from a much lower base and captures far more of the upside. The investor who entered at $392 paid for much of the growth in advance.
The starting multiple is a silent variable that determines how much of a company’s future belongs to the investor and how much was already priced into the ticket.
Buying Tesla at $392 is not buying a car company. It is explicitly endorsing a set of propositions about autonomous vehicles, robotics, and margin transformation. Three specific strategic theses must partially or fully materialise to justify the current multiple:
The California regulatory gap between Tesla and Waymo is more significant than the headline robotaxi narrative suggests: Tesla holds only a manufacturer testing permit requiring a safety driver, while Waymo operates under commercial deployment authorisation, a distinction that affects the timeline assumptions underpinning every bull case revenue projection.
The gap between what the company has publicly confirmed and what the price implies is where the risk lives. Q1 2026 capital expenditure of $2.493 billion signals the investment intensity, though no explicit full-year capex guidance has been confirmed in official earnings materials.
“The vision has consistently arrived. The schedule has consistently slipped.”
That pattern bears examination. In 2016, Elon Musk stated that all production vehicles had full self-driving hardware. In 2019, he projected one million robotaxis by end of 2020. In 2021, he projected Optimus would be deployment-ready by 2022. Each of these timelines slipped materially. The strategic direction has proven durable; the delivery schedule has not.
Waymo operates established Level 4 autonomous vehicle services with years of real-world safety and performance data. In humanoid robotics, Figure AI and Boston Dynamics are pursuing commercial pathways that could limit Tesla’s first-mover assumptions. These competitive dynamics do not invalidate the bull case, but they function as a risk multiplier on the scenario assumptions already outlined.
Identical future business outcomes produce different investor returns depending on entry price. This is one of the most underappreciated dynamics in equity investing.
Tesla traded at approximately $100 per share a few years before this analysis. It trades at roughly $392 today, having pulled back from a prior peak near $450. An investor who entered at $100 and holds through the same future scenario as an investor who enters at $392 will compound returns from a base roughly four times lower. The company’s future does not change. The investor’s return profile changes entirely.
Margin of safety is the concept that captures this dynamic. It refers to the gap between a conservative estimate of value and the price actually paid. That gap functions as a buffer if the base case does not materialise. GuruFocus estimates Tesla’s intrinsic value at $283.94, implying roughly 40% overvaluation at $398.73. That gap represents one quantitative proxy for the margin of safety deficit at the current price.
NYU Stern terminal value estimation frameworks, developed by Aswath Damodaran, demonstrate why the exit valuation multiple is often the single most consequential variable in any discounted cash flow model, particularly for high-growth companies where small changes to the assumed terminal growth rate compound into dramatically different intrinsic value outputs.
The bear case outcome reinforces the point. At an entry price of approximately $375, all projected return outcomes were negative under the scenario framework. The bull case annualised return range of 11%-35% is only achievable at current prices if the full AI and robotics thesis materialises, an outcome the source analysis estimated at 5%-10% probability.
A three-step process applies to any high-multiple stock:
“Entry price does not change what a company will become. It determines how much of that future you already paid for.”
The methodology built through this case study follows a five-step sequence:
Tesla’s $119 to $600 analyst target range is the market’s own implicit acknowledgement that this is a scenario-distribution problem, not a point-estimate problem. Investing.com has framed Q1 2026 as a “credibility test”: the beat establishes the baseline, and the next two to three quarters of execution data will begin resolving which scenario distribution is correct.
The case remains live and unresolved. That is precisely what makes it instructive. Investors watching Q2 and Q3 2026 execution milestones, particularly robotaxi expansion beyond Texas, Optimus manufacturing progress, and margin trajectory, will see the scenario framework tested in real time.
Retrospective examples confirm the stakes. Nvidia’s 2023-2024 trajectory saw the AI infrastructure bull case resolve upward, producing outsized returns. Meta’s 2022-2023 experience saw narrative-driven uncertainty create a significant drawdown before business execution answered the bear case concerns. In each instance, the investor’s outcome depended on which scenario materialised and what price was paid before the resolution arrived.
The analytical skill is transferable to any stock in transition: AI infrastructure companies, early-stage biotech platforms, or any business where the current price reflects a projected identity rather than a current one.
For investors who want to convert the overvaluation awareness built through this scenario framework into a concrete action plan, our comprehensive walkthrough of market correction positioning covers how to build a pre-researched watchlist with pre-calculated buy prices, monitor Berkshire’s quarterly 13F filings as a deployment signal, and determine when holding cash is mathematically defensible relative to prevailing equity yields.
A company being genuinely exceptional does not automatically make its stock a sound investment at any price. Tesla may prove to be the most important industrial company of the next decade. The scenario analysis does not dispute that possibility. It asks a different question entirely: does the current entry price leave room for that possibility to reward the investor, or has the future already been priced in?
The diagnostic question this entire framework builds toward is straightforward. What probability of the bull case does this price require, and is that probability realistic?
At $392, the answer requires a high degree of conviction in autonomous vehicle commercialisation, humanoid robotics revenue, and sustained margin expansion on a timeline that has historically slipped. Investors who hold that conviction with clear-eyed awareness of the execution risks are making an informed bet. Investors who hold the stock without having named those assumptions are making a different kind of bet entirely.
The coming quarters will begin to resolve the debate. Tesla’s Q2 and Q3 2026 milestones offer a live feedback loop on the very assumptions this analysis has identified. Revisiting those results through the scenario framework built here, rather than through headline price movement alone, is where the analytical edge lies.
This article is for informational purposes only and should not be considered financial advice. Investors should conduct their own research and consult with financial professionals before making investment decisions. Past performance does not guarantee future results. Financial projections are subject to market conditions and various risk factors.
Stock valuation analysis is the process of estimating a company's intrinsic worth by examining financial metrics, growth assumptions, and future earnings potential. For high-multiple stocks like Tesla, traditional models break down because the price reflects projected future business lines rather than current earnings.
A narrative premium is the portion of a stock's price attributable to a story about the future rather than to current financial results. Tesla's price of roughly $392, against a GuruFocus intrinsic value estimate of $283.94, illustrates how large that premium can be when markets price in unproven business lines like autonomous vehicles and humanoid robotics.
Scenario analysis assigns ranges to three key inputs: revenue growth rate, net profit margin, and exit valuation multiple. For Tesla, the bull case assumes 20%-35% revenue growth and 20%-30% margins, producing potential annualised returns of 11%-35% over ten years, while the bear case assumptions produce negative returns at an entry price near $375.
Entry price determines how much of a company's future growth an investor has already paid for. Two investors holding Tesla through identical future outcomes will earn very different returns depending on whether they bought at $100 or $392, because the higher entry price means more future growth was priced in at purchase.
Investors should monitor robotaxi expansion beyond Texas cities into regulated markets like California, progress on Optimus humanoid robot manufacturing, and whether operating margins expand materially beyond the Q1 2026 level of 4.2%, as these are the load-bearing assumptions underpinning every bull case valuation projection.