How Covered Call ETF Distributions Are Taxed in Canada
16 hrs ago

Most ASX investors comparing Washington H Soul Pattinson (ASX:SOL) and Netwealth Group (ASX:NWL) start by asking which one has better numbers. That is the wrong question, because each company’s numbers are designed to do entirely different things.
SOL has appreciated 18.6% in 2025, while NWL is trading 43.5% below its 52-week high. The surface-level divergence makes the comparison tempting. But SOL is a century-old diversified holding company optimised for income and capital preservation, while NWL is a technology-enabled wealth platform built for scalability and growth compounding. Applying the same scorecard to both produces noise, not insight.
This analysis uses the SOL and NWL pairing as a live case study to show investors how to match analytical metrics to business model type, what the current numbers actually reveal about each company, and how to frame an investment decision when two stocks occupy fundamentally different roles in a portfolio.
A single scorecard applied uniformly across fundamentally different businesses does not produce a fair comparison. It produces false signals. A metric that flags weakness in one model type may indicate structural strength in another.
SOL has been listed on the ASX for more than 120 years. Its proposition centres on capital preservation, growing dividends across cycles, and balance sheet durability. NWL, founded in 1999, operates as an asset-light, technology-driven adviser platform built for scalability and high-return reinvestment over a long runway.
The divergence becomes visible immediately when a single metric is applied to both. SOL’s return on equity (ROE) in FY24 was 5.6%. NWL’s was 62.3%. The same calculation, the same label, two outputs that are not comparable without understanding what each business is designed to deliver.
Before choosing which metrics to track, the structural question comes first: what is this business built to do, and for whom?
Investors who apply identical scorecards to every stock will systematically undervalue some companies and overpay for others. Recognising that distinction is the prerequisite for every number that follows.
The divergence between SOL and NWL illustrates a broader truth about fundamental analysis metrics: each one answers a different question, and reading them in isolation rather than as a system is where most analytical errors originate.
Balance sheet strength is the primary lens for SOL, and not merely as a financial metric. A holding company that carries excessive debt risks being forced to sell good assets at distressed prices during downturns. SOL’s debt-to-equity ratio stood at 8.5% for FY24 (company-reported), with a more recent figure of approximately 9.6%. Both indicate a capital structure designed to hold positions through cycles rather than trade to meet short-term obligations.
The dividend yield, taken alone, appears modest. SOL’s five-year average annual dividend yield sits at approximately 2.4%. In isolation, that number would not turn heads.
In context, it tells a different story entirely.
SOL has never missed a dividend since listing in 1903. The company has increased its dividend every year since 2000, a streak maintained through FY2025 and into 2026, spanning multiple market cycles, recessions, and global disruptions.
That unbroken record reframes the yield as a measure of quality and sustainability rather than headline size. Investors in SOL are typically not chasing the highest yield on the market; they are trading yield magnitude for compounding reliability.
The FY24 ROE of 5.6% falls below the commonly cited 10% benchmark for mature businesses, and this is a genuine analytical signal rather than a figure to dismiss. Whether the lower ROE reflects temporary portfolio composition effects or structural features of the underlying holdings warrants further investigation. For a holding company, growth in net asset value per share and total shareholder return over long periods are useful supplements to any single year’s reported ROE.
SOL’s 18.6% share price appreciation in 2025 suggests the market continues to value the compound effect of that conservative approach.
| Metric | Value | Interpretive context |
|---|---|---|
| Debt-to-equity | 8.5% (FY24) / ~9.6% (more recent) | Very conservative; lowers financial risk and enables holding through downturns |
| Avg. annual dividend yield (5yr) | 2.4% | Modest headline yield, backed by unbroken century-long dividend record |
| Return on equity (FY24) | 5.6% | Below 10% benchmark; warrants deeper portfolio composition analysis |
| Share price appreciation (2025) | 18.6% | Strong calendar-year performance |
| Dividend increase streak | Every year since 2000 | Maintained through FY2025 and into 2026 |
Read together, SOL’s numbers describe a holding company built to compound across decades, not quarters.
Investors wanting to understand why SOL’s conservative, multi-decade approach produces durable results will find our full explainer on long-term compounding principles covers the mathematics behind why the second decade of a compounding position generates nearly double the dollar gains of the first, and why uninterrupted time in market is the single most powerful variable in wealth accumulation.
A single-year profit margin or price-to-earnings ratio for a growth platform can actively mislead. A company reinvesting heavily in technology, distribution, and capability will often compress short-term margins to maximise long-term value. For NWL, multi-year revenue and profit trends are the primary analytical tools.
Start with the revenue line. NWL’s revenue grew at a compound annual rate of 20.8% over the three years to FY24, reaching $255 million. That trajectory extended into FY25, with platform revenue of $316.4 million (total income of $324.4 million). This is sustained compounding, not a one-off spike.
The next question is whether that growth translated into rising profit. It did. Net profit grew from $54 million to $83 million over the three years to FY24, approximately 54% cumulative growth. FY25 net profit reached $116.5 million. Revenue and profit both trending upward confirms the business is scaling efficiently.
Platform metrics reinforce the trend. Funds under administration (FUA), the total value of client assets managed on the platform, exceeded $88 billion in 2024 and surpassed $125 billion by early 2026. Account holders grew from more than 140,000 in 2024 to the 162,000-172,000 range by early 2026.
ASIC Regulatory Guide 148 sets out the compliance obligations for platforms operating as managed investment schemes and nominee custody services in Australia, establishing the licensing and operational standards that govern how wealth platforms like NWL structure client asset administration and reporting.
NWL’s FY24 ROE of 62.3% reflects the economics of an asset-light software platform, not an accounting anomaly. More recent periods show ROE in the 38-58% range, still exceptionally high by market standards but moderating as the business scales. The central valuation question is whether that ROE can remain elevated as competition responds.
| Metric | FY24 figure | FY25 / more recent figure |
|---|---|---|
| Revenue | $255 million | $316.4 million (FY25) |
| Net profit | $83 million | $116.5 million (FY25) |
| Funds under administration | $88 billion+ | $125 billion+ (early 2026) |
| Account holders | 140,000+ | 162,000-172,000 (early 2026) |
| Return on equity | 62.3% | 38-58% range (more recent) |
Three analytical questions apply to any growth platform, and investors should ask each before forming a view:
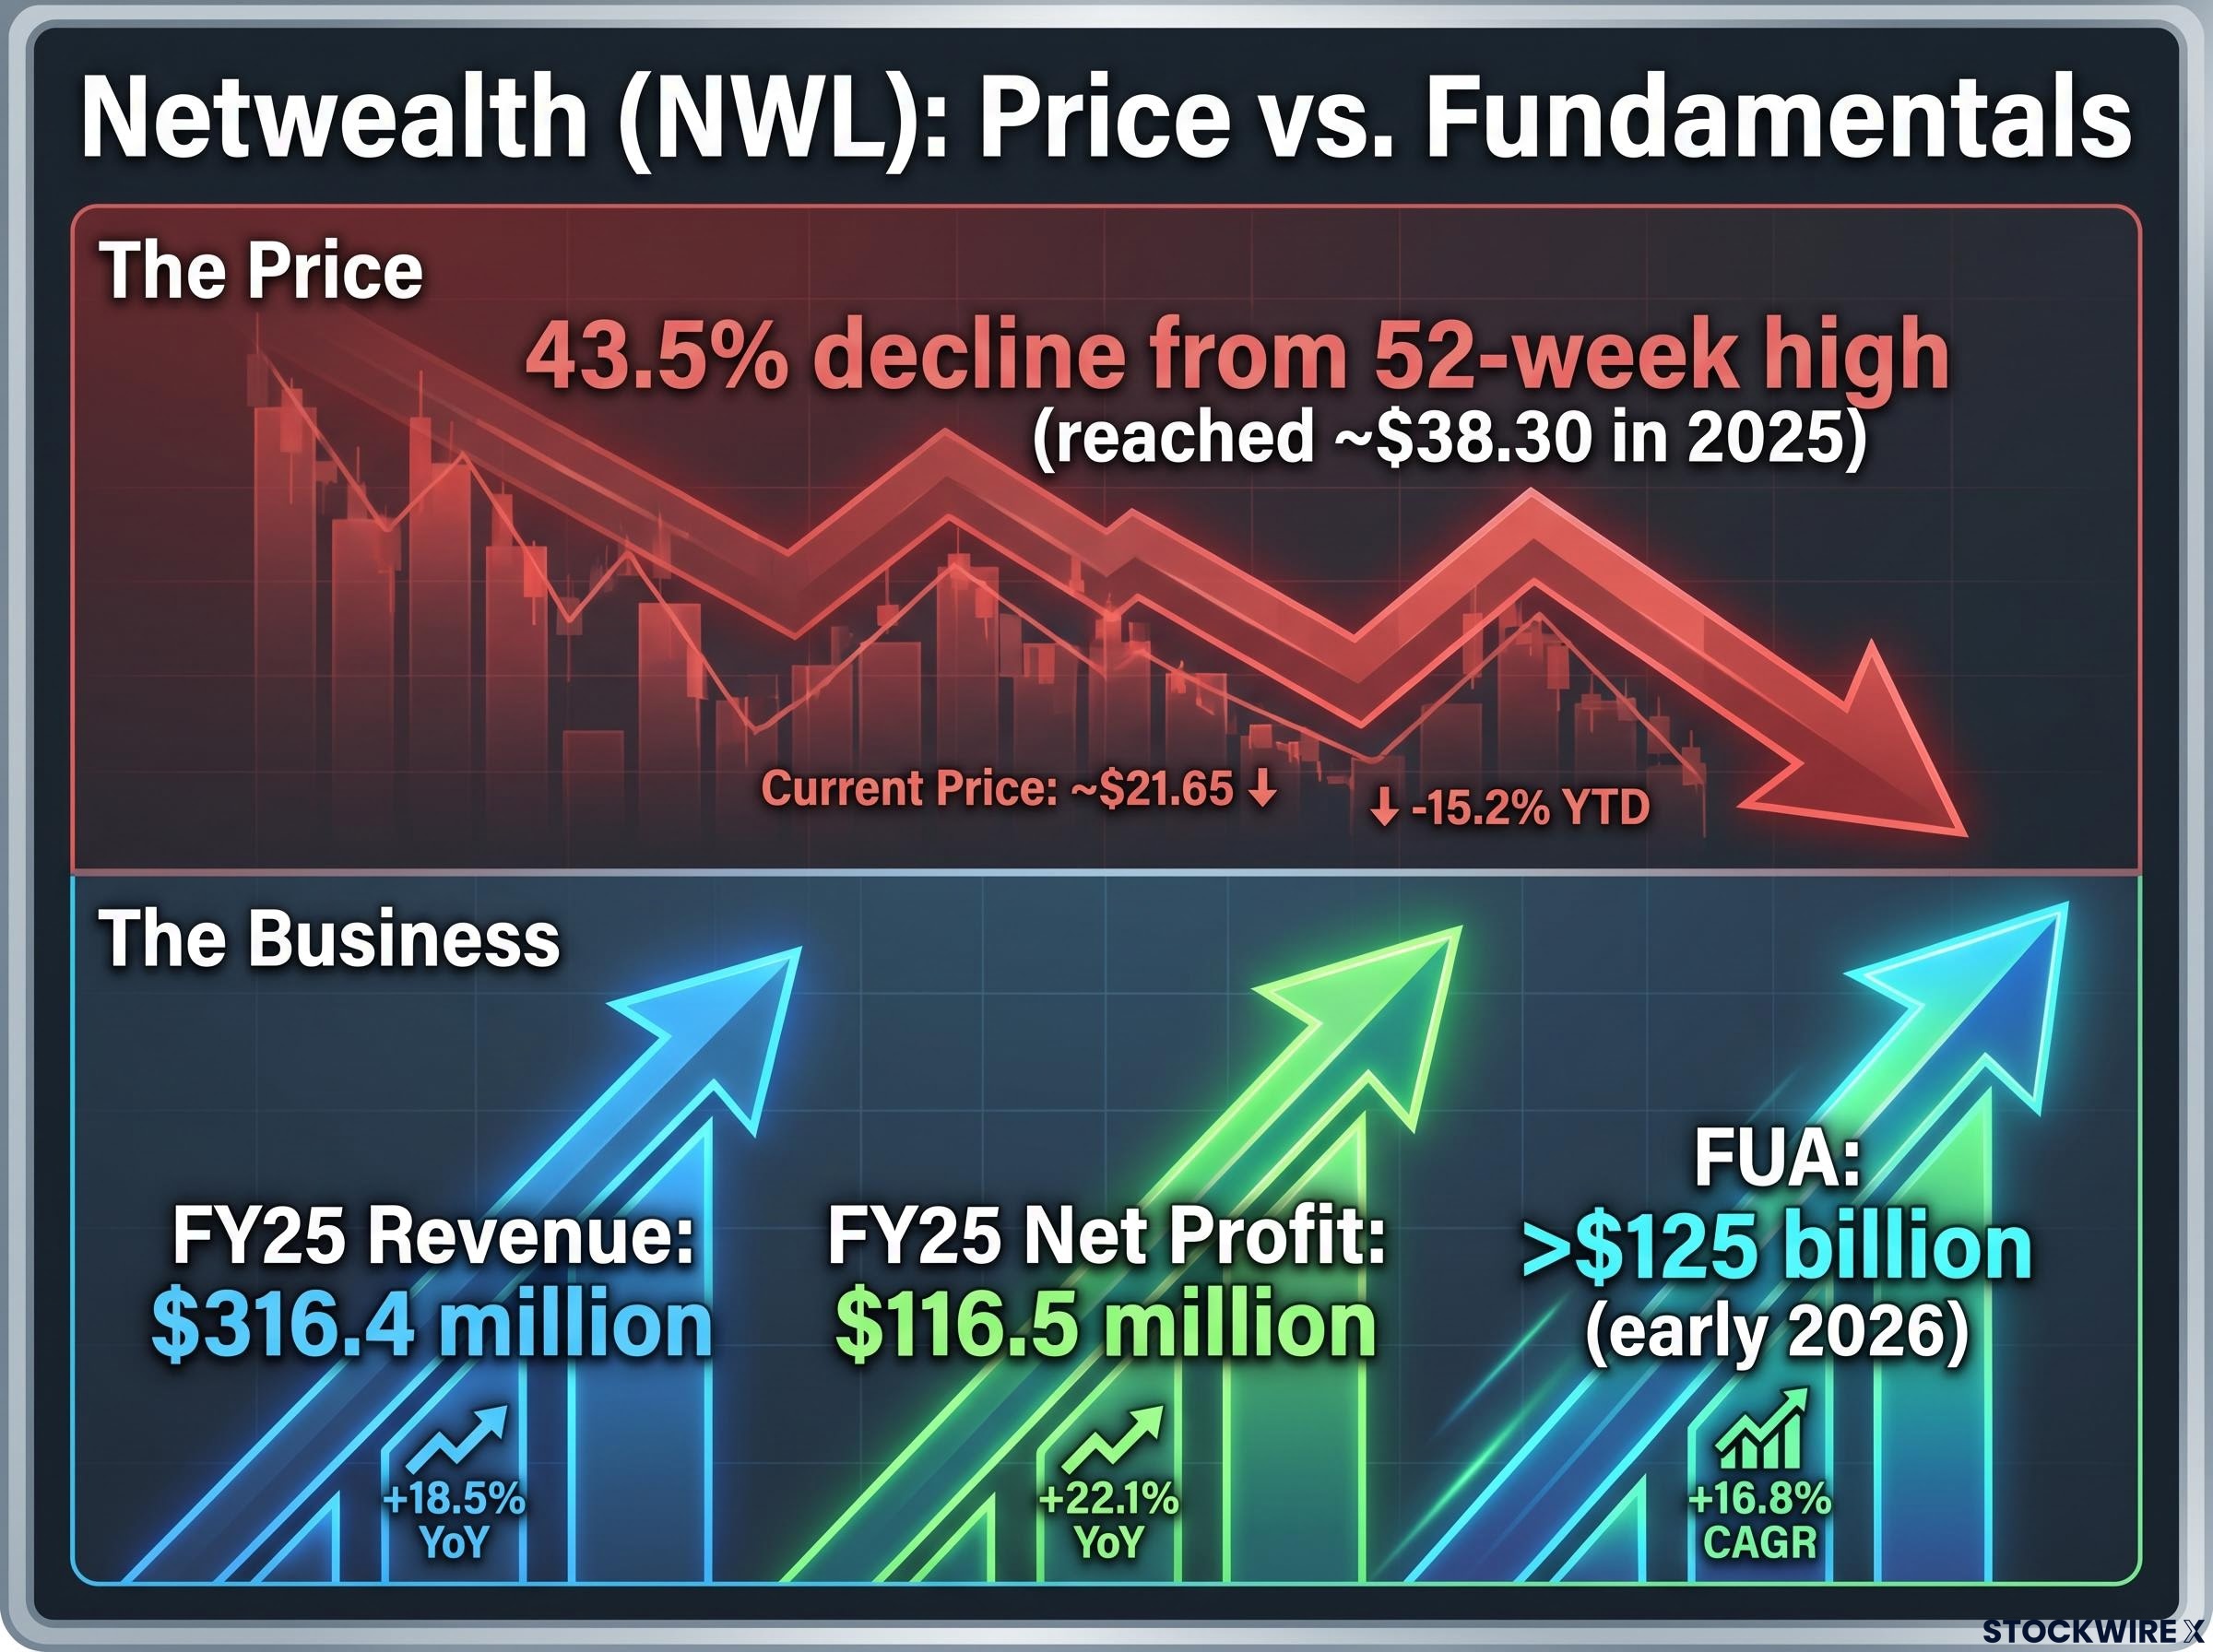
A 43.5% decline from a 52-week high (reached at approximately $38.30 in 2025) looks alarming in a headline. Price movement alone, however, does not indicate whether an investment thesis is broken or a stock has simply been re-rated.
Three common drivers explain large drawdowns in growth stocks:
Growth stock valuation mechanics explain a significant portion of NWL’s drawdown: when interest rates or discount-rate assumptions shift, the market reprices future cash flows downward even when the underlying business continues growing, which is precisely the dynamic that can separate price action from fundamental performance.
The analytical task is separating which of these is driving the price action.
NWL’s FY25 results provide a post-drawdown fundamental check. Revenue of $316.4 million, net profit of $116.5 million, and FUA exceeding $125 billion all indicate the underlying business continued to perform strongly after the share price fell.
The contrast is striking: NWL’s share price declined 43.5% from its 52-week high, while FY25 revenue grew to $316.4 million, net profit reached $116.5 million, and FUA exceeded $125 billion. The price moved in one direction; the business moved in another.
Strong recent fundamentals narrow the list of explanations. They point toward multiple compression or sentiment-driven rotation rather than a broken thesis. But they do not resolve the valuation question. Investors still need to assess what growth rate is priced into the current share price, and whether the market’s revised expectations are reasonable or overcorrected.
That distinction, between a valuation reset and genuine impairment, is what separates reactive from considered investing.
The productive framing for this comparison is not which stock wins, but which stock’s characteristics match a specific investor’s goals.
SOL and NWL solve different problems. SOL provides income reliability, balance sheet conservatism, and long-term capital preservation across cycles. Its conservative debt (8.5-9.6%), unbroken dividend history spanning more than a century, and 18.6% share price appreciation in 2025 describe a business built for investors who prioritise yield quality over yield magnitude and stability over growth optionality.
The SOL and NWL pairing maps almost directly onto the debate around dividend investing versus total return approaches: SOL investors optimise for sustainable income and yield quality, while NWL investors accept lower current yield in exchange for capital appreciation compounding at a higher rate.
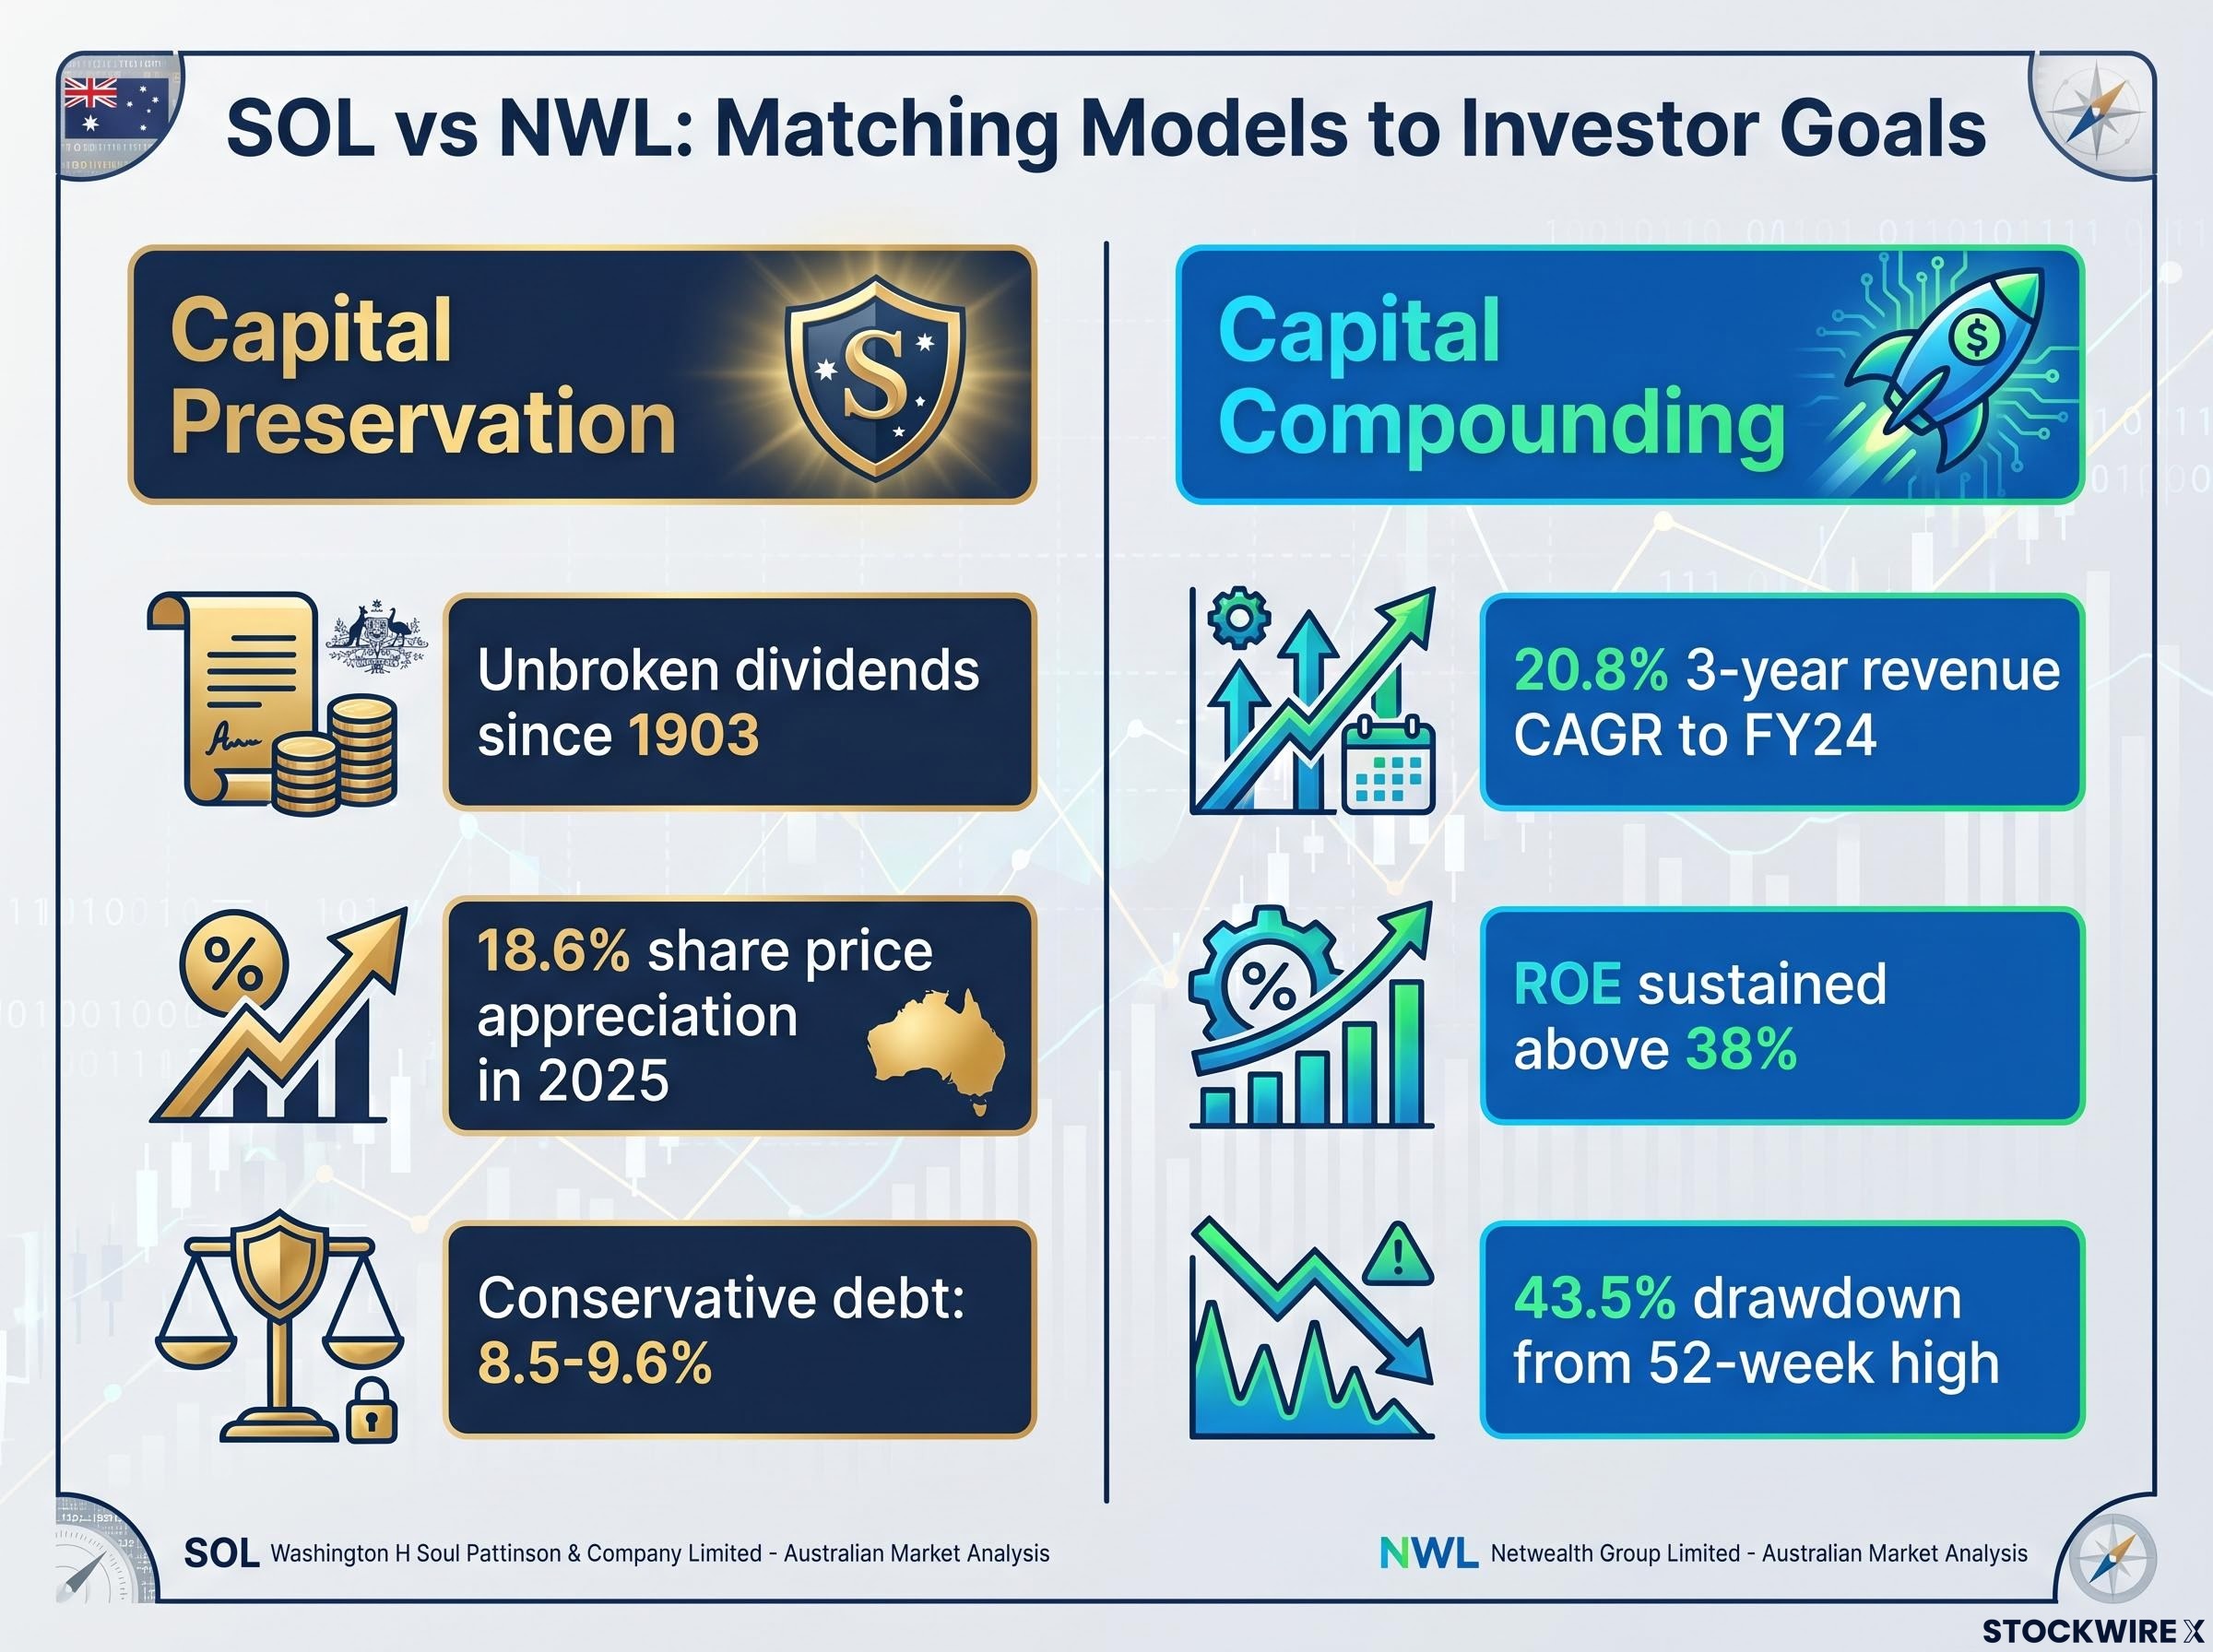
NWL provides exposure to a high-return, scalable platform with a long reinvestment runway. Its 20.8% three-year revenue CAGR to FY24, ROE sustained above 38% in more recent periods, and the open analytical question on valuation post-drawdown describe a business built for investors with a longer time horizon and higher tolerance for price volatility.
Both stocks can coexist in a diversified portfolio, serving different functions simultaneously.
| Dimension | SOL | NWL |
|---|---|---|
| Primary objective | Income reliability, capital preservation | Capital compounding, growth exposure |
| Key risk | Below-benchmark ROE; portfolio concentration | Multiple compression; valuation uncertainty |
| Income profile | Unbroken dividends since 1903; annual increases since 2000 | Lower yield; value created through capital appreciation |
| Analytical priority metric | Balance sheet strength, dividend sustainability | Multi-year revenue/profit trends, ROE durability |
| Suited investor profile | Income-focused, conservative, long-term holders | Growth-oriented, higher volatility tolerance, longer horizon |
Neither SOL nor NWL is the objectively correct choice. The productive question is which characteristics match a specific investor’s goals, time horizon, and income requirements.
The most durable investor skill is not knowing which stock to pick today. It is knowing which metrics to apply to which type of business, and why.
The SOL and NWL pairing illustrates a principle that extends across the ASX. Banks versus fintechs, resource majors versus explorers, REITs versus property developers: each pairing requires model-specific analytical frameworks. Applying a single scorecard across all of them will systematically produce misleading signals.
Before applying any metric, one question changes the entire scorecard: what is this business designed to deliver, and to whom?
Investors seeking deeper context on individual companies should review SOL’s and NWL’s most recent investor presentations and annual reports alongside this framework. Those making portfolio decisions should consider whether their current holdings are being evaluated with model-appropriate metrics.
This article is for informational purposes only and should not be considered financial advice. Investors should conduct their own research and consult with financial professionals before making investment decisions. Past performance does not guarantee future results.
Washington H Soul Pattinson (SOL) is a century-old diversified holding company focused on income reliability and capital preservation, while Netwealth Group (NWL) is a technology-enabled wealth platform built for scalability and growth compounding, making them structurally different businesses suited to different investor objectives.
NWL's drawdown is most consistent with multiple compression or sentiment-driven rotation rather than a broken thesis, given that FY25 results showed revenue of $316.4 million, net profit of $116.5 million, and funds under administration exceeding $125 billion, all moving in the opposite direction to the share price.
The two ROE figures are not directly comparable because the businesses are designed differently: SOL's conservative structure prioritises capital preservation and unbroken dividend income across cycles, while NWL's asset-light platform model generates high returns on a small equity base, so each figure must be read within its own business model context.
For a holding company like SOL, the most relevant metrics are balance sheet strength (debt-to-equity of 8.5-9.6%), dividend sustainability (unbroken since 1903, annual increases since 2000), and long-term net asset value growth per share, rather than short-term ROE or earnings multiples.
For a scalable platform like NWL, the most informative metrics are multi-year revenue and profit trends (NWL posted a 20.8% three-year revenue CAGR to FY24), funds under administration growth (from $88 billion in 2024 to over $125 billion by early 2026), and whether high ROE is structural and durable rather than a single snapshot figure.