When inflation picks up, the instinct is to reach for gold, commodities, or real assets. Software stocks rarely make the list. Rising rates punish long-duration growth companies, the logic goes, so the last place you want to be is in high-multiple SaaS names. That logic misses something important: the way enterprise software companies collect cash.
The period from 2025 through 2026 tested this assumption in real time. Persistent monetary accommodation, expanding fiscal deficits, and a policy environment that kept conditions loose created an urgent question for retail investors: which assets actually protect purchasing power when the money supply keeps growing? A case for large-cap enterprise SaaS as a reliable hedge against inflationary conditions was put forward roughly six months before late August 2025, built on the mechanics of deferred revenue and negative working capital. The question now is whether those mechanics held.
Here is what the accounting structure actually looks like, how two specific companies validated it through government contract wins and cash flow growth, and what the technical and options evidence from 2025 and 2026 tells you about where the trade stands today.
Why software companies collect cash before they spend it
Working capital is the gap between a company’s current assets (cash, receivables) and its current liabilities (payables, deferred revenue). For most businesses, you want that number to be positive. A manufacturer needs cash on hand to buy raw materials before selling the finished product. A retailer needs to stock inventory before customers walk through the door.
Enterprise SaaS companies operate in reverse. When a company like Salesforce invoices a customer for an annual subscription, cash arrives on day one. The full payment lands in the bank account immediately. But because the service is delivered over twelve months, accounting rules require the company to record that payment as deferred revenue, a liability on the balance sheet, and recognise it as earned revenue only as the service is provided over time. Deferred revenue, in other words, is money from customers sitting on the balance sheet as a liability that is not really owed; it is future revenue that has already been paid for.
The distinction between free cash flow vs EPS becomes especially significant for SaaS companies, where deferred revenue mechanics mean earnings can lag the actual cash generation by months, understating how much real purchasing power the business is accumulating.
The result is negative working capital. Current liabilities exceed current assets because of the large deferred revenue balance. That sounds like a problem. It is not.
Three structural characteristics produce this dynamic:
- Upfront billing: Customers pay for annual or multi-year subscriptions before receiving the full service.
- Deferred revenue recognition: Cash is collected immediately but recognised as revenue gradually over the contract term.
- Low variable cost of delivery: Serving an additional customer on an existing software platform costs very little beyond what is already spent.
The effect is functionally an interest-free loan from customers to the business, funding operations and growth without external financing.
Salesforce carried deferred (unearned) revenue balances in the $18-24 billion range as of fiscal 2026, with free cash flow of approximately $12.6 billion for the fiscal year and approximately $15.2 billion on a trailing-twelve-month basis as of July 2026. Those are not debt obligations. They are prepaid customer demand.
How inflation amplifies the advantage rather than eroding it
In an inflationary environment, contract renewal prices rise in nominal terms. When a customer prepays a higher dollar amount on renewal, more cash arrives upfront. Here is where the margin structure matters: gross margins in mature SaaS typically run 70-80%, meaning most of each incremental inflation-linked price increase flows through to gross profit and ultimately free cash flow.
A manufacturer facing the same inflation sees input costs consume the margin gain. A software company does not have that problem. The variable cost of serving existing customers scales far more slowly than revenue. That means inflation-linked price increases expand free cash flow rather than merely maintaining it.
The typical rate-sensitivity story, that higher discount rates punish long-duration growth assets, is real but often overstated relative to this operating cash flow tailwind. If you hold a SaaS stock, the deferred revenue mechanic is precisely what makes it behave differently from a manufacturer during inflation. The balance sheet liability that looks like risk is actually the mechanism through which customers pre-finance the business.
When big ASX news breaks, our subscribers know first
What the mechanics look like in practice: ServiceNow and Salesforce in 2025-2026
The abstract mechanics only matter if they translate into real contracts with real dollar values. Through 2025 and 2026, two companies demonstrated exactly that.
Salesforce evolved under activist pressure into a more cash-flow-focused business, emphasising upfront annual subscription billing in a way that materially enhanced cash conversion. The result showed up in the numbers: free cash flow rose to approximately $12.6 billion in fiscal 2026 and approximately $15.2 billion on a trailing-twelve-month basis as of July 2026. But it also showed up in contract wins that locked in multi-year demand.
In January 2026, Salesforce was awarded a $5.6 billion, 10-year Indefinite Delivery Indefinite Quantity (IDIQ) agreement with the U.S. Army, a ceiling-value contract for enterprise platform services. In July 2026, it secured a $1.6 billion, three-year Department of Veterans Affairs Agentforce licence agreement focused on AI-driven modernisation of defence and health workflows.
ServiceNow took a different path to the same destination. Its OneGov and Government Transformation programmes now operate across nearly all 50 U.S. states, positioning the company as an AI control tower for public-sector workflow automation. It also made a major multi-year investment to enable Canada’s public sector to adopt AI at scale.
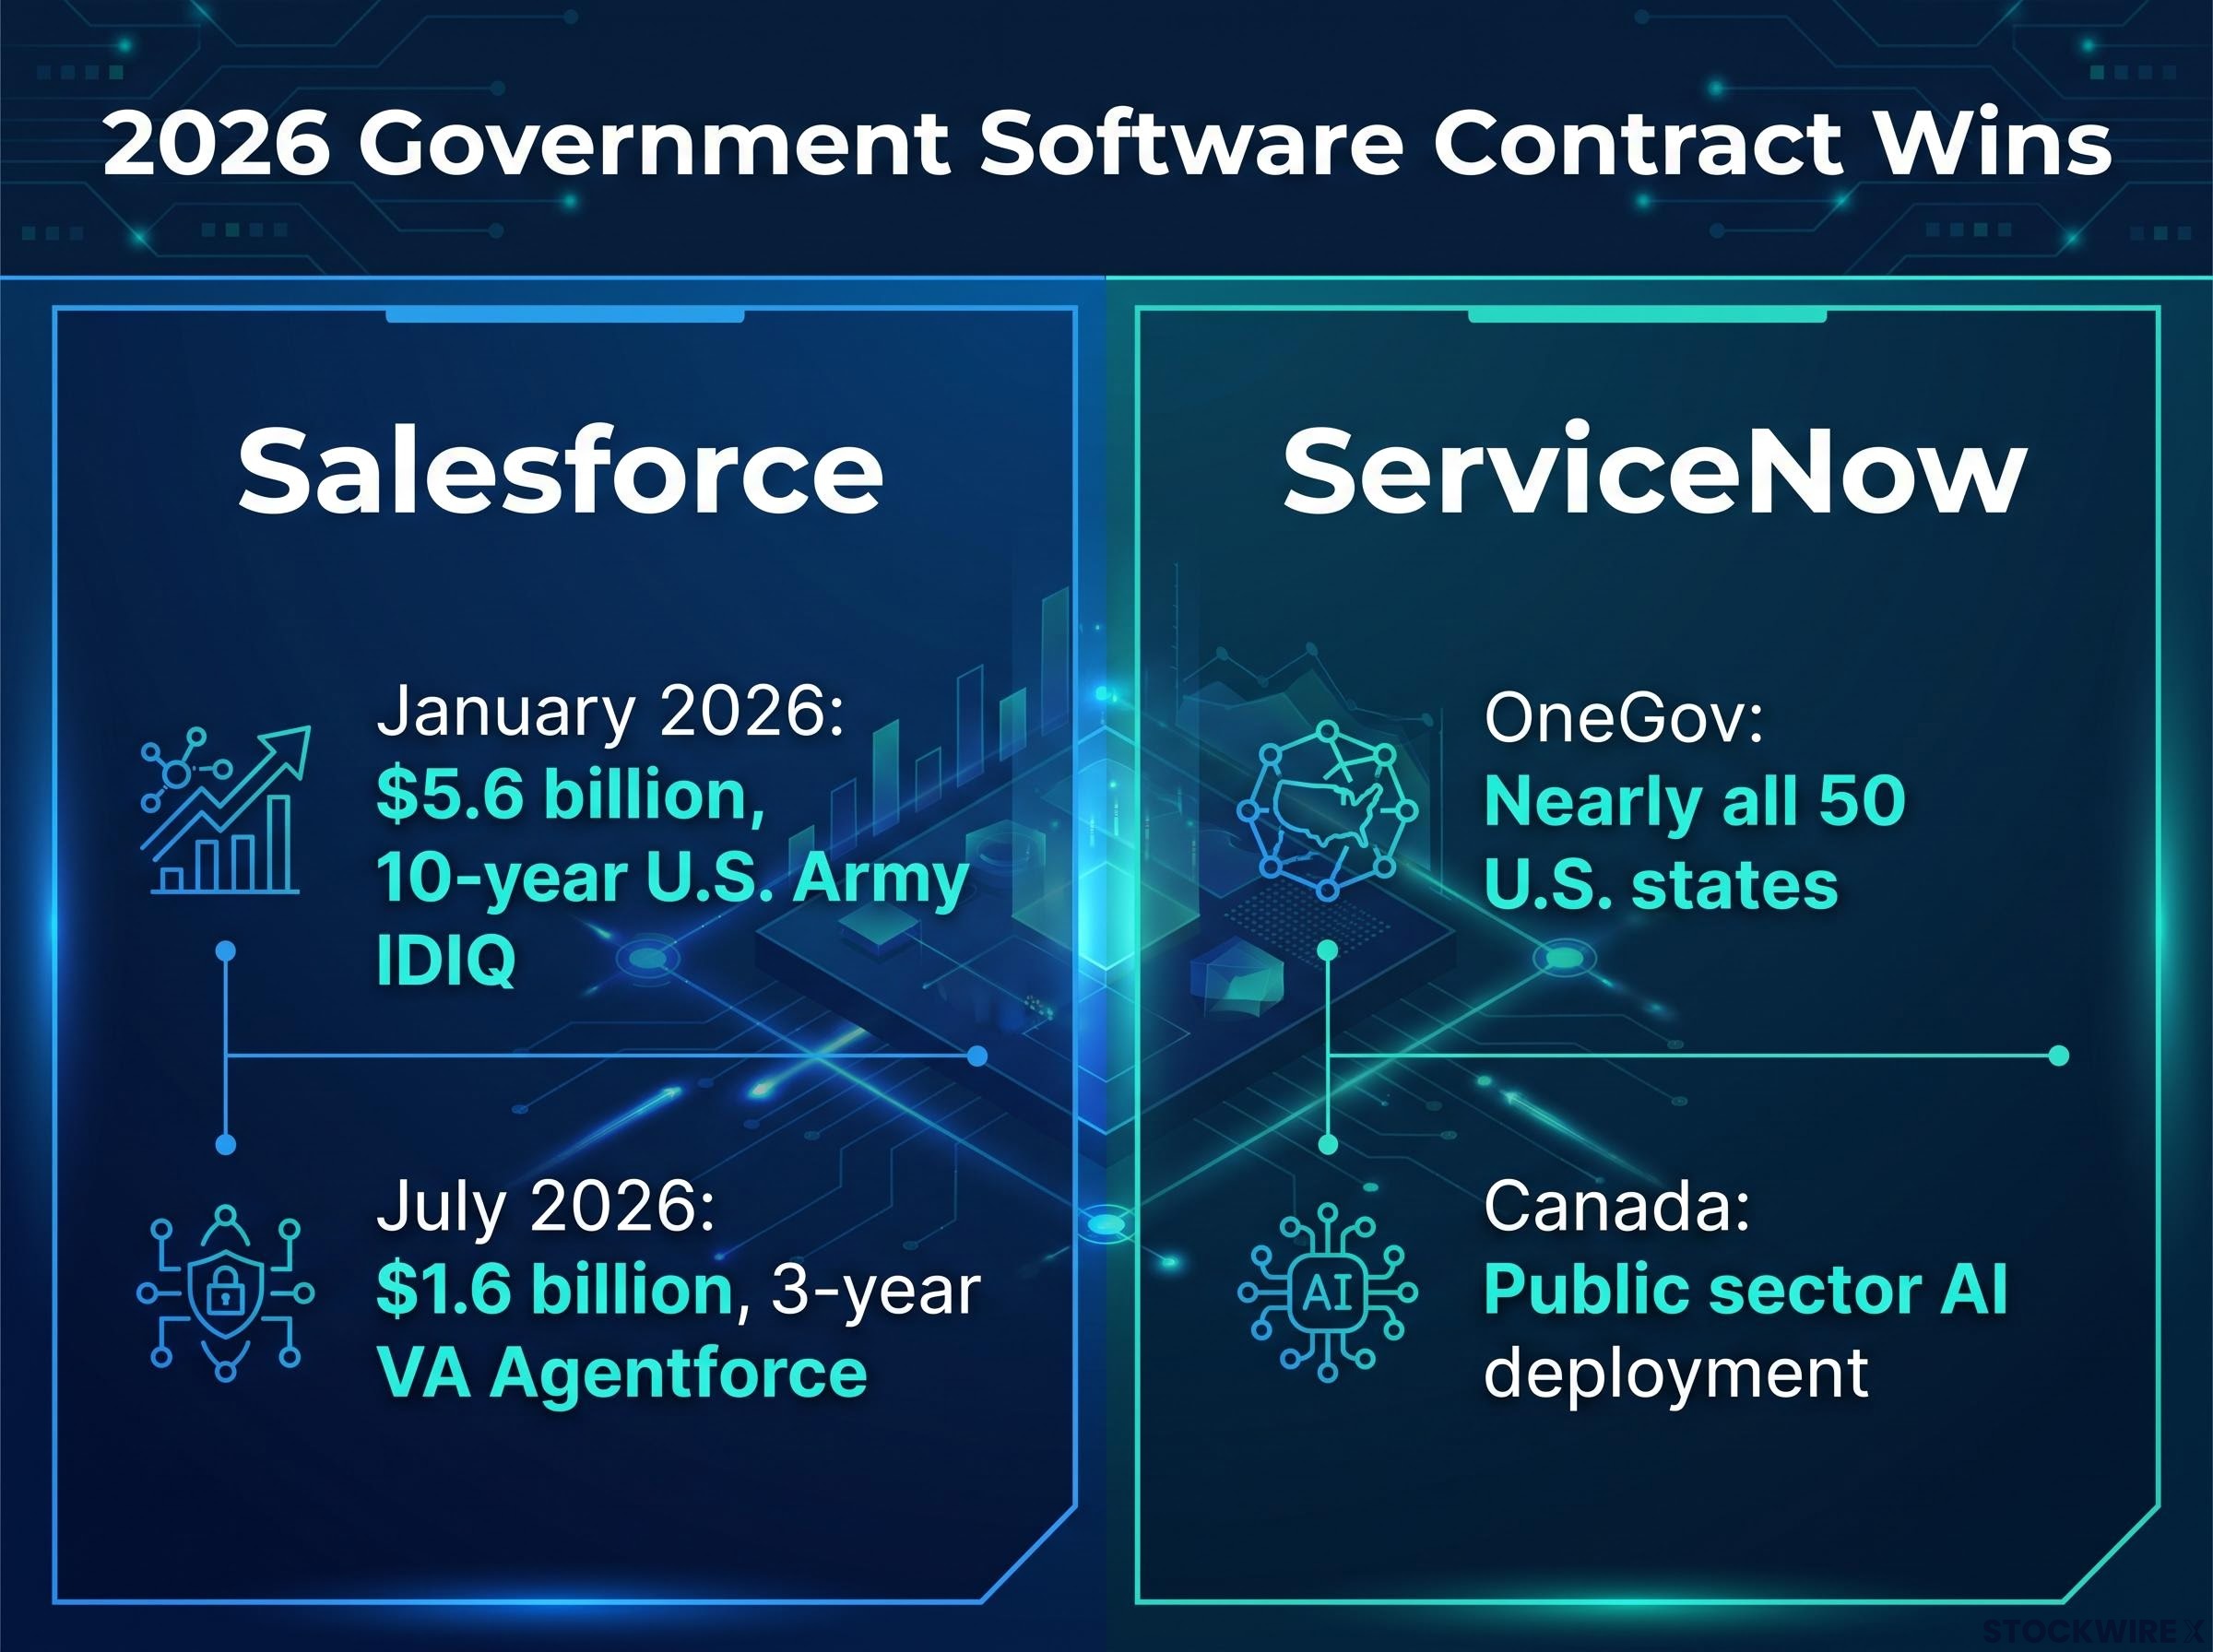
| Metric | ServiceNow | Salesforce |
|---|---|---|
| Government contract anchor | OneGov across nearly all 50 U.S. states; Canada AI deployment | $5.6B U.S. Army IDIQ; $1.6B VA Agentforce |
| Cash flow metric | Strong recurring subscription cash flow | ~$15.2B TTM free cash flow (July 2026) |
| Negative working capital indicator | Large deferred revenue from annual/multi-year contracts | Deferred revenue $18-24B range |
| Primary inflation-hedge mechanism | Pricing power in mission-critical ITSM workflows | Upfront billing on annual subscriptions with high gross margins |
Here is how a government multi-year contract produces the negative working capital dynamic in practice:
- Contract is awarded with a defined dollar value and multi-year duration.
- Upfront payment is collected at the start of each contract period.
- Deferred revenue is recorded as a liability on the balance sheet.
- Service is delivered gradually over the contract term.
- Costs are incurred incrementally, well below the upfront cash collected.
These are not aspirational pipeline numbers. They are awarded contracts with defined dollar values and multi-year durations, which tells you the inflation-hedge cash flow profile is anchored to real, locked-in demand rather than market assumptions.
Did the technical signals hold? The cup-and-handle outcome through mid-2026
Around early-to-mid 2025, a cup-and-handle formation was identified in software’s relative performance versus the broader market. A cup-and-handle is a chart pattern where a price drops, recovers in a rounded shape (the cup), then consolidates in a tighter range (the handle) before breaking higher. The pattern suggested institutional accumulation was building beneath the surface, even as software stocks traded at a discount to the broader market.
The original signal was identified by Jim Carzan of Kai Wealth approximately six months before late August 2025, as part of the broader thesis that enterprise SaaS was structurally mispriced.
The iShares Expanded Tech-Software Sector ETF (IGV) traced a cup-and-handle structure, with a pronounced drawdown into April 2025, a rounded recovery, consolidation through May 2026, and a breakout above its prior rim and 200-day moving average accompanied by rising volume.
The breakout characteristics confirmed the pattern:
- Pattern completion above the prior rim, clearing the resistance level that had capped software’s relative performance.
- Volume expansion on the breakout, indicating institutional participation rather than thin-market noise.
- Momentum readings pushing into overbought territory, with IGV posting double-digit percentage gains over several sessions.
No chart pattern is deterministic. A cup-and-handle resolving higher does not prove an investment thesis. But the convergence of a technically completed breakout with the fundamental evidence from contract awards and cash flow improvement tells you that institutional money followed the same logic the original thesis outlined. That convergence, technical and fundamental signals aligning independently, is a more meaningful signal than either data point alone.
What the retrospective tells you about where the trade stands now
The early-2025 discount versus the broader market has largely narrowed. Software’s meaningful re-rating from its 2022-2023 de-rating lows and early-2025 discounts means the margin of safety is smaller than it was at initiation.
The structural thesis, negative working capital, pricing power, and government demand, remains intact. What has changed is the entry point. You are now buying at a higher multiple, which shifts the emphasis from exploiting mispricing to participating in durable compounding.
This is not a signal to exit. It is a signal to size positions and structure risk differently than you would have in early 2025.
Options strategies for expressing an inflation thesis with defined risk
Options are appropriate here precisely because timing is uncertain but the structural thesis is sound. The easy re-rating has passed, making defined-risk structures more appropriate than outright long equity at current valuations.
The higher volatility and re-rating risk observed in software over 2025-2026, driven by shifts in AI sentiment and rate expectations, reinforce the logic of using structured option positions rather than large, unhedged common-stock positions. Options give you exposure to further upside without committing capital as if the margin of safety were still wide.
Four structures suit the current environment, arranged from shortest-dated to longest-dated:
- Long calls on individual names around known catalysts such as earnings reports or major government contract announcements for ServiceNow and Salesforce. These offer leveraged upside with downside strictly limited to the premium paid, best used when you have high conviction around a specific event.
- Call spreads (buying a near-the-money call and selling a higher-strike call on the same expiry) reduce cost while capping upside at plausible targets. Best used when the margin of safety is narrower and you want to participate without paying full premium.
Credit spread mechanics give options traders a structural probability advantage by converting time decay into a daily ally, with a properly constructed bull put spread offering three separate paths to maximum profit compared to the single directional path required by an outright long call position.
- LEAPS (calls with 12-24 month expirations) allow participation in extended themes like ongoing public-sector AI deployment and government digitisation without the severe time decay of short-dated options. Best suited when the demand trajectory is durable but the timing of specific catalysts is uncertain.
- Sector ETF options on IGV provide diversified exposure to the software inflation thesis, reducing single-name risk. Best used when you want thematic participation without concentrating in any individual company.
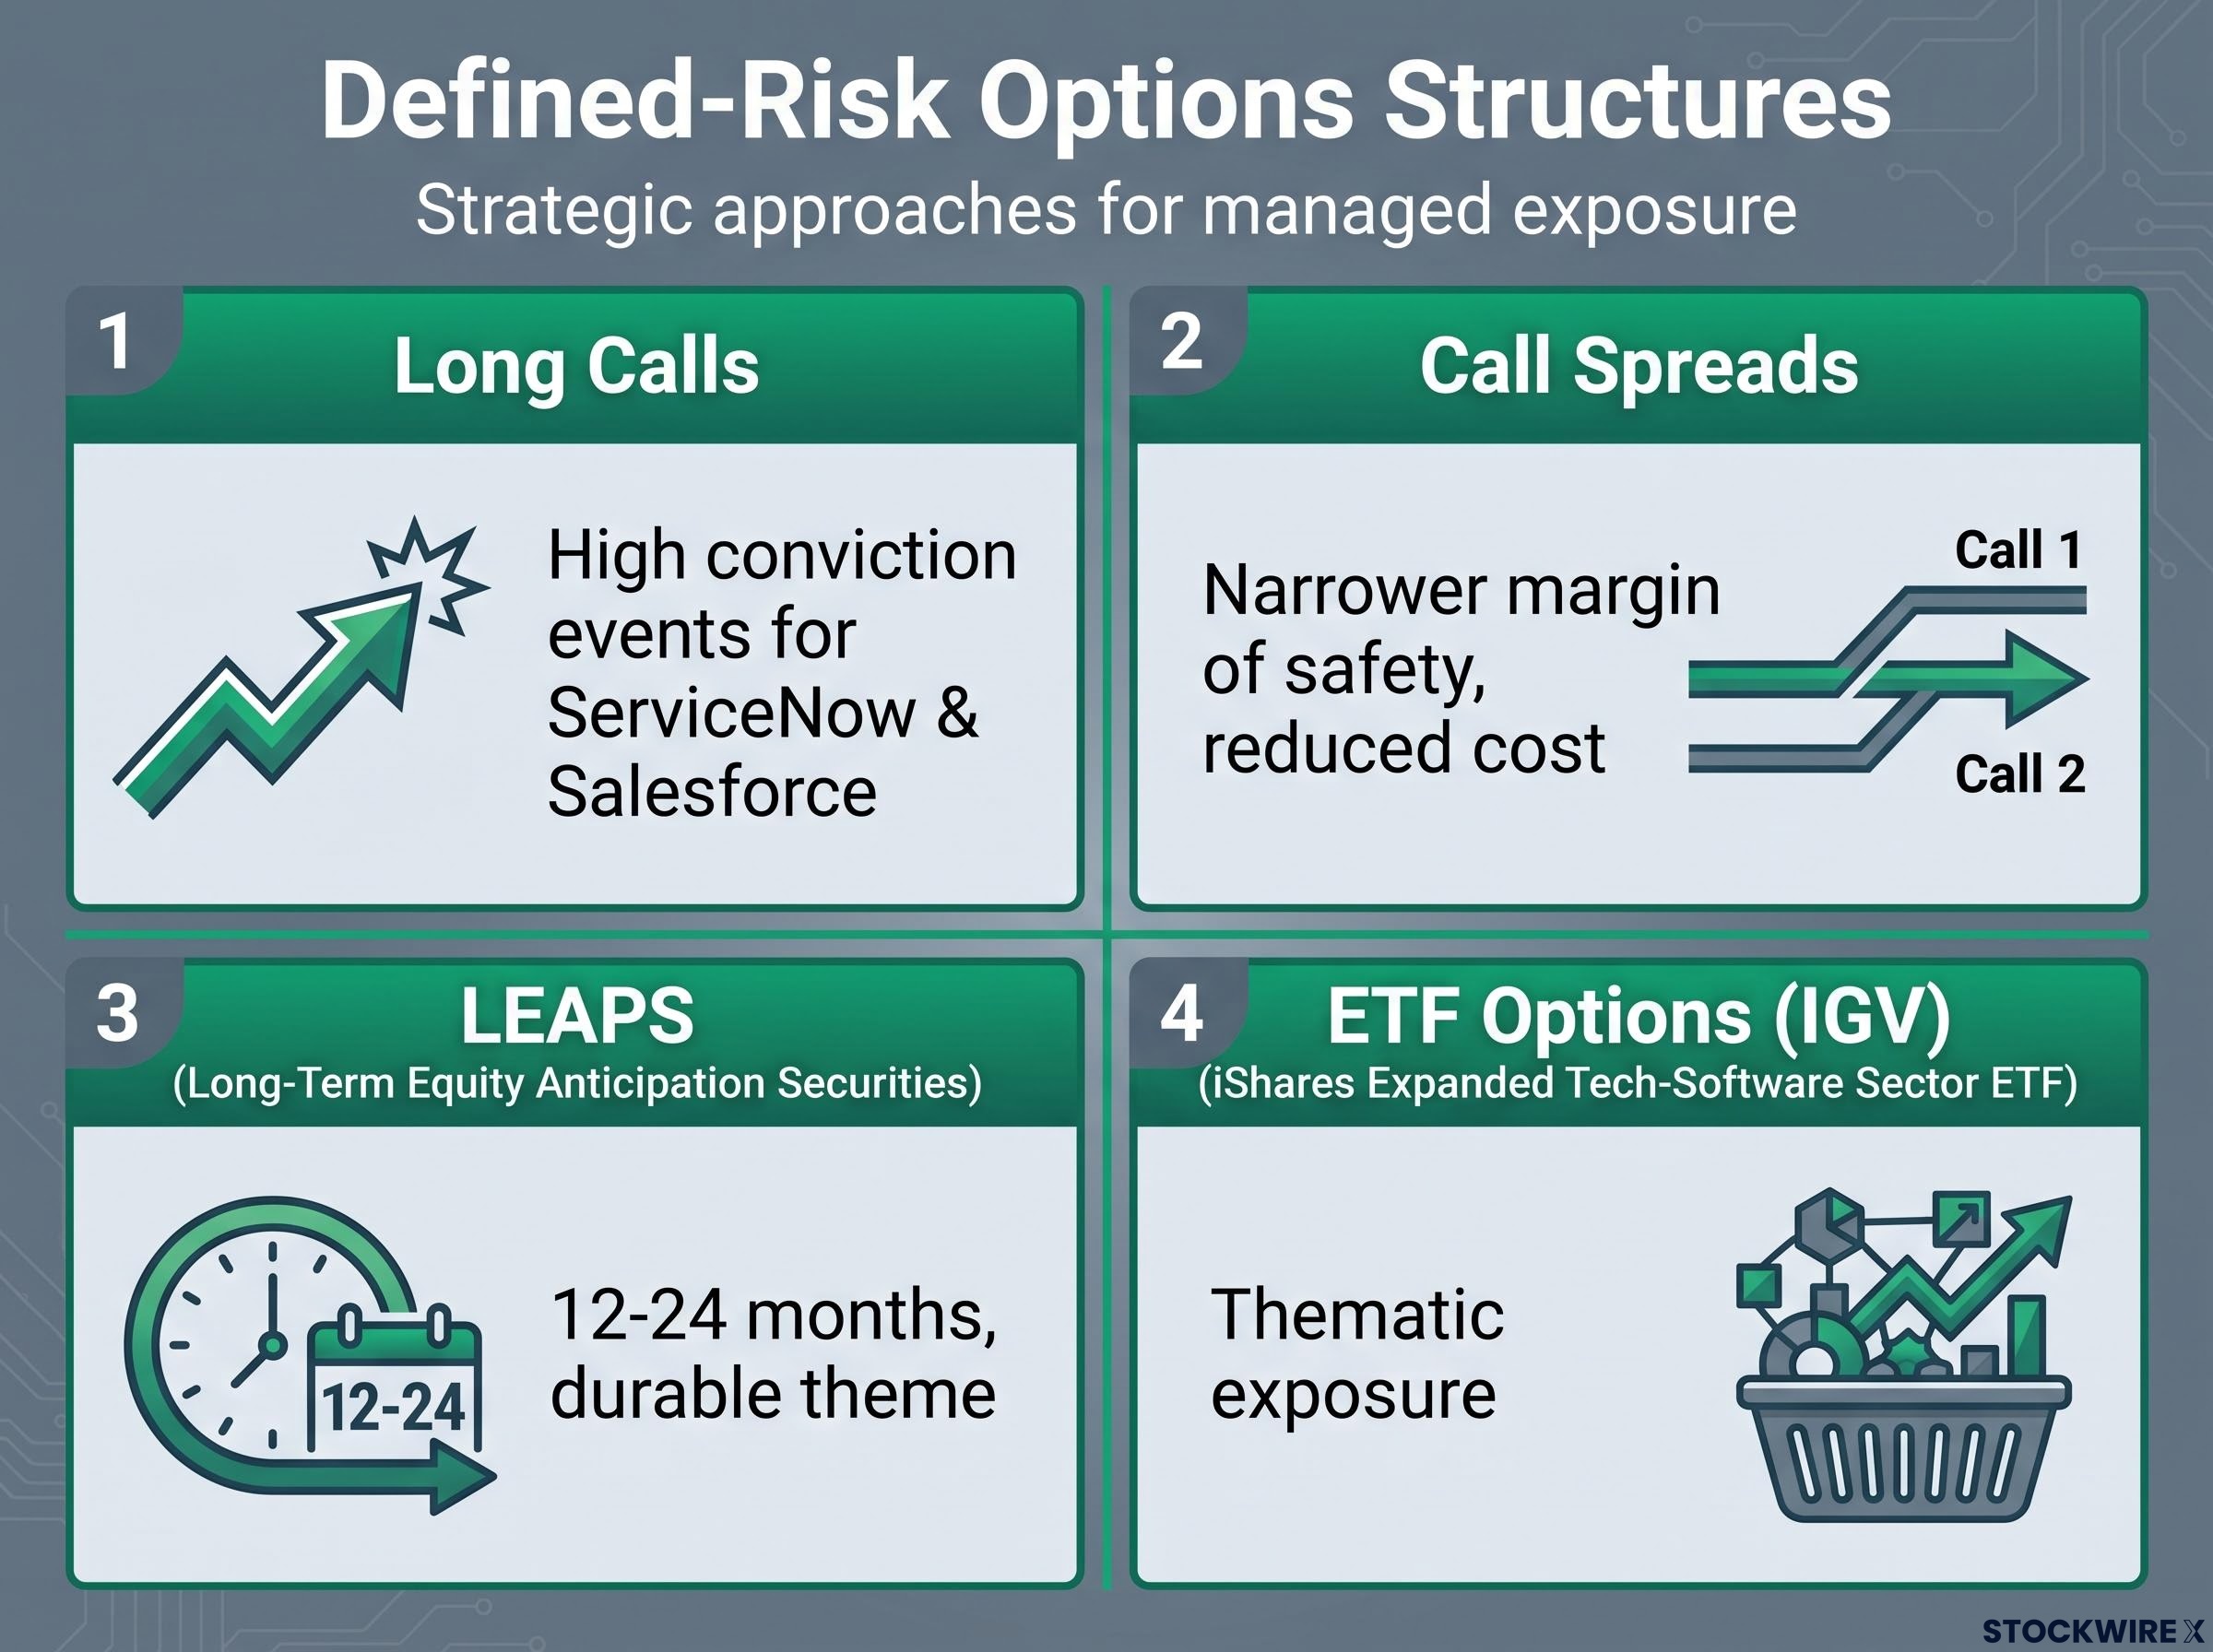
| Strategy | Best used when | Risk profile | Relevant catalyst |
|---|---|---|---|
| Long calls | High conviction around a specific event | Loss limited to premium paid | Earnings reports, contract announcements |
| Call spreads | Narrower margin of safety | Reduced cost, capped upside | Valuation re-rating within range |
| LEAPS (12-24 months) | Durable theme, uncertain timing | Lower time decay vs short-dated | Government digitisation, AI adoption |
| ETF options (IGV) | Thematic exposure, lower single-name risk | Diversified, premium-defined | Broad software sector momentum |
At current valuations, choosing a call spread over an outright long position is not a bearish signal. It is a disciplined acknowledgment that the risk-reward ratio has shifted and that preserving capital for the next identifiable catalyst matters as much as capturing upside. These structures let you stay positioned for further upside from ongoing government digitisation, AI adoption, and inflationary pricing dynamics without committing large capital at potentially late-cycle entry points.
This article is for informational purposes only and should not be considered financial advice. Options and equity investing involve risk, including the potential loss of principal. Investors should conduct their own research and consult with financial professionals before making investment decisions.
Software, gold, and Bitcoin: how the pieces fit in an inflation-aware portfolio
Software is not a replacement for gold or Bitcoin in an inflation-aware portfolio. It is a third mechanism that works through entirely different channels.
The three assets hedge inflation in distinct ways. Software hedges through operating cash flow mechanics and pricing power; when nominal prices rise, subscription revenue rises, and high gross margins convert that increase into free cash flow. Gold hedges through its role as a monetary reserve and crisis stabiliser, a store of value whose price tends to rise when confidence in fiat currencies falls. Bitcoin provides asymmetric, highly volatile exposure to monetary debasement and digital asset adoption, functioning as optionality rather than stability.
Bitcoin as an inflation hedge carries a more complicated track record than the asymmetric optionality framing suggests: its 2022 drawdown of roughly 77% during the highest inflation in four decades revealed that its correlation with risk assets like the NASDAQ can amplify portfolio drawdowns rather than offset them during the same stress periods when inflation protection is most needed.
Jim Carzan of Kai Wealth and Jamal Chand of Tasty Live characterised near-term pullbacks in gold and Bitcoin as buying opportunities within ongoing secular uptrends driven by persistent inflationary monetary policy. Gold’s pullback was viewed as a temporary correction within a longer-term bullish trend. Bitcoin saw renewed market interest after a period of being largely ignored, with price beginning to move higher again.
| Asset | Inflation-hedge mechanism | Volatility profile | Role in portfolio |
|---|---|---|---|
| Software / SaaS | Operating cash flow expansion via pricing power and negative working capital | Moderate (equity-linked) | Cash-flow-driven real growth |
| Gold | Monetary reserve status, fiat debasement hedge | Low to moderate | Stability and crisis protection |
| Bitcoin | Asymmetric exposure to monetary debasement and digital adoption | High | Optionality and asymmetric upside |
The policy backdrop of running monetary conditions hot is the primary long-run driver for all three. But they respond through entirely different mechanisms, which is why they complement rather than substitute for each other. Three characteristics make SaaS specifically complementary to hard assets:
- Equity-linked growth that participates in nominal GDP expansion.
- Operating-level inflation insulation through high margins and upfront billing.
- Liquid markets with options access for defined-risk positioning.
If you already hold gold for monetary protection and Bitcoin for asymmetric optionality, adding large-cap SaaS with negative working capital gives you a third hedge that works through operating earnings rather than asset price appreciation. That is a qualitatively different type of protection worth having in the same portfolio.
What the 2025-2026 cycle teaches you about the next inflation trade
The through-line is straightforward. The thesis worked because the structural mechanics were real, not theoretical. Negative working capital, pricing power, and high gross margins translated into verifiable cash flow growth. Government demand was not an abstract hope; it was a concrete, quantifiable tailwind measured in billions of dollars of awarded contracts. The technical signal confirmed that institutional positioning followed the same fundamental logic.
What has changed is the valuation. The structural case remains intact. The entry opportunity has narrowed. The tools for expressing the view, options structures with defined risk, have become more important as the margin of safety has compressed.
The practical forward-looking takeaway centres on three screening variables:
- Business model structure: Look for substantial deferred revenue, upfront billing, and gross margins above 70%. Salesforce’s trailing-twelve-month free cash flow of approximately $15.2 billion is what verified cash flow looks like in a confirmed negative working capital compounder.
- Demand anchor verification: Confirm a durable government or enterprise contract pipeline with defined duration and dollar values. ServiceNow’s penetration across nearly all 50 U.S. states is the benchmark for what durable government demand depth looks like.
- Risk structuring: When the margin of safety is narrow, use call spreads or LEAPS rather than outright long positions at late-cycle multiples. Defined-risk options allow you to stay positioned without overcommitting capital.
The structural thesis and the risk-structuring discipline are inseparable. One without the other is incomplete.
The lesson is not that software is always the right hedge. It is that understanding the mechanics of any candidate inflation hedge well enough to verify them with real balance sheet and contract data is what separates a structural position from a thematic guess. Any business model with negative working capital and pricing power is worth examining through the same lens, which means this framework gives you a screening tool you can apply to future cycles, not just a verdict on the 2025 trade.
SaaS pricing model disruption poses a forward-looking risk to the negative working capital thesis: AI-native competitors entering enterprise markets with consumption-based pricing designed to undercut incumbent seat costs by 80-90% could erode the very upfront billing mechanics that make large-cap SaaS function as an inflation hedge.
Past performance does not guarantee future results. Financial projections are subject to market conditions and various risk factors. These statements are speculative and subject to change based on market developments and company performance.
—
—