Earning $1,000 a year in passive income from the Vanguard Australian Shares High Yield ETF sounds like a clean, achievable goal. It is, until you look closely at how the yield is actually calculated.
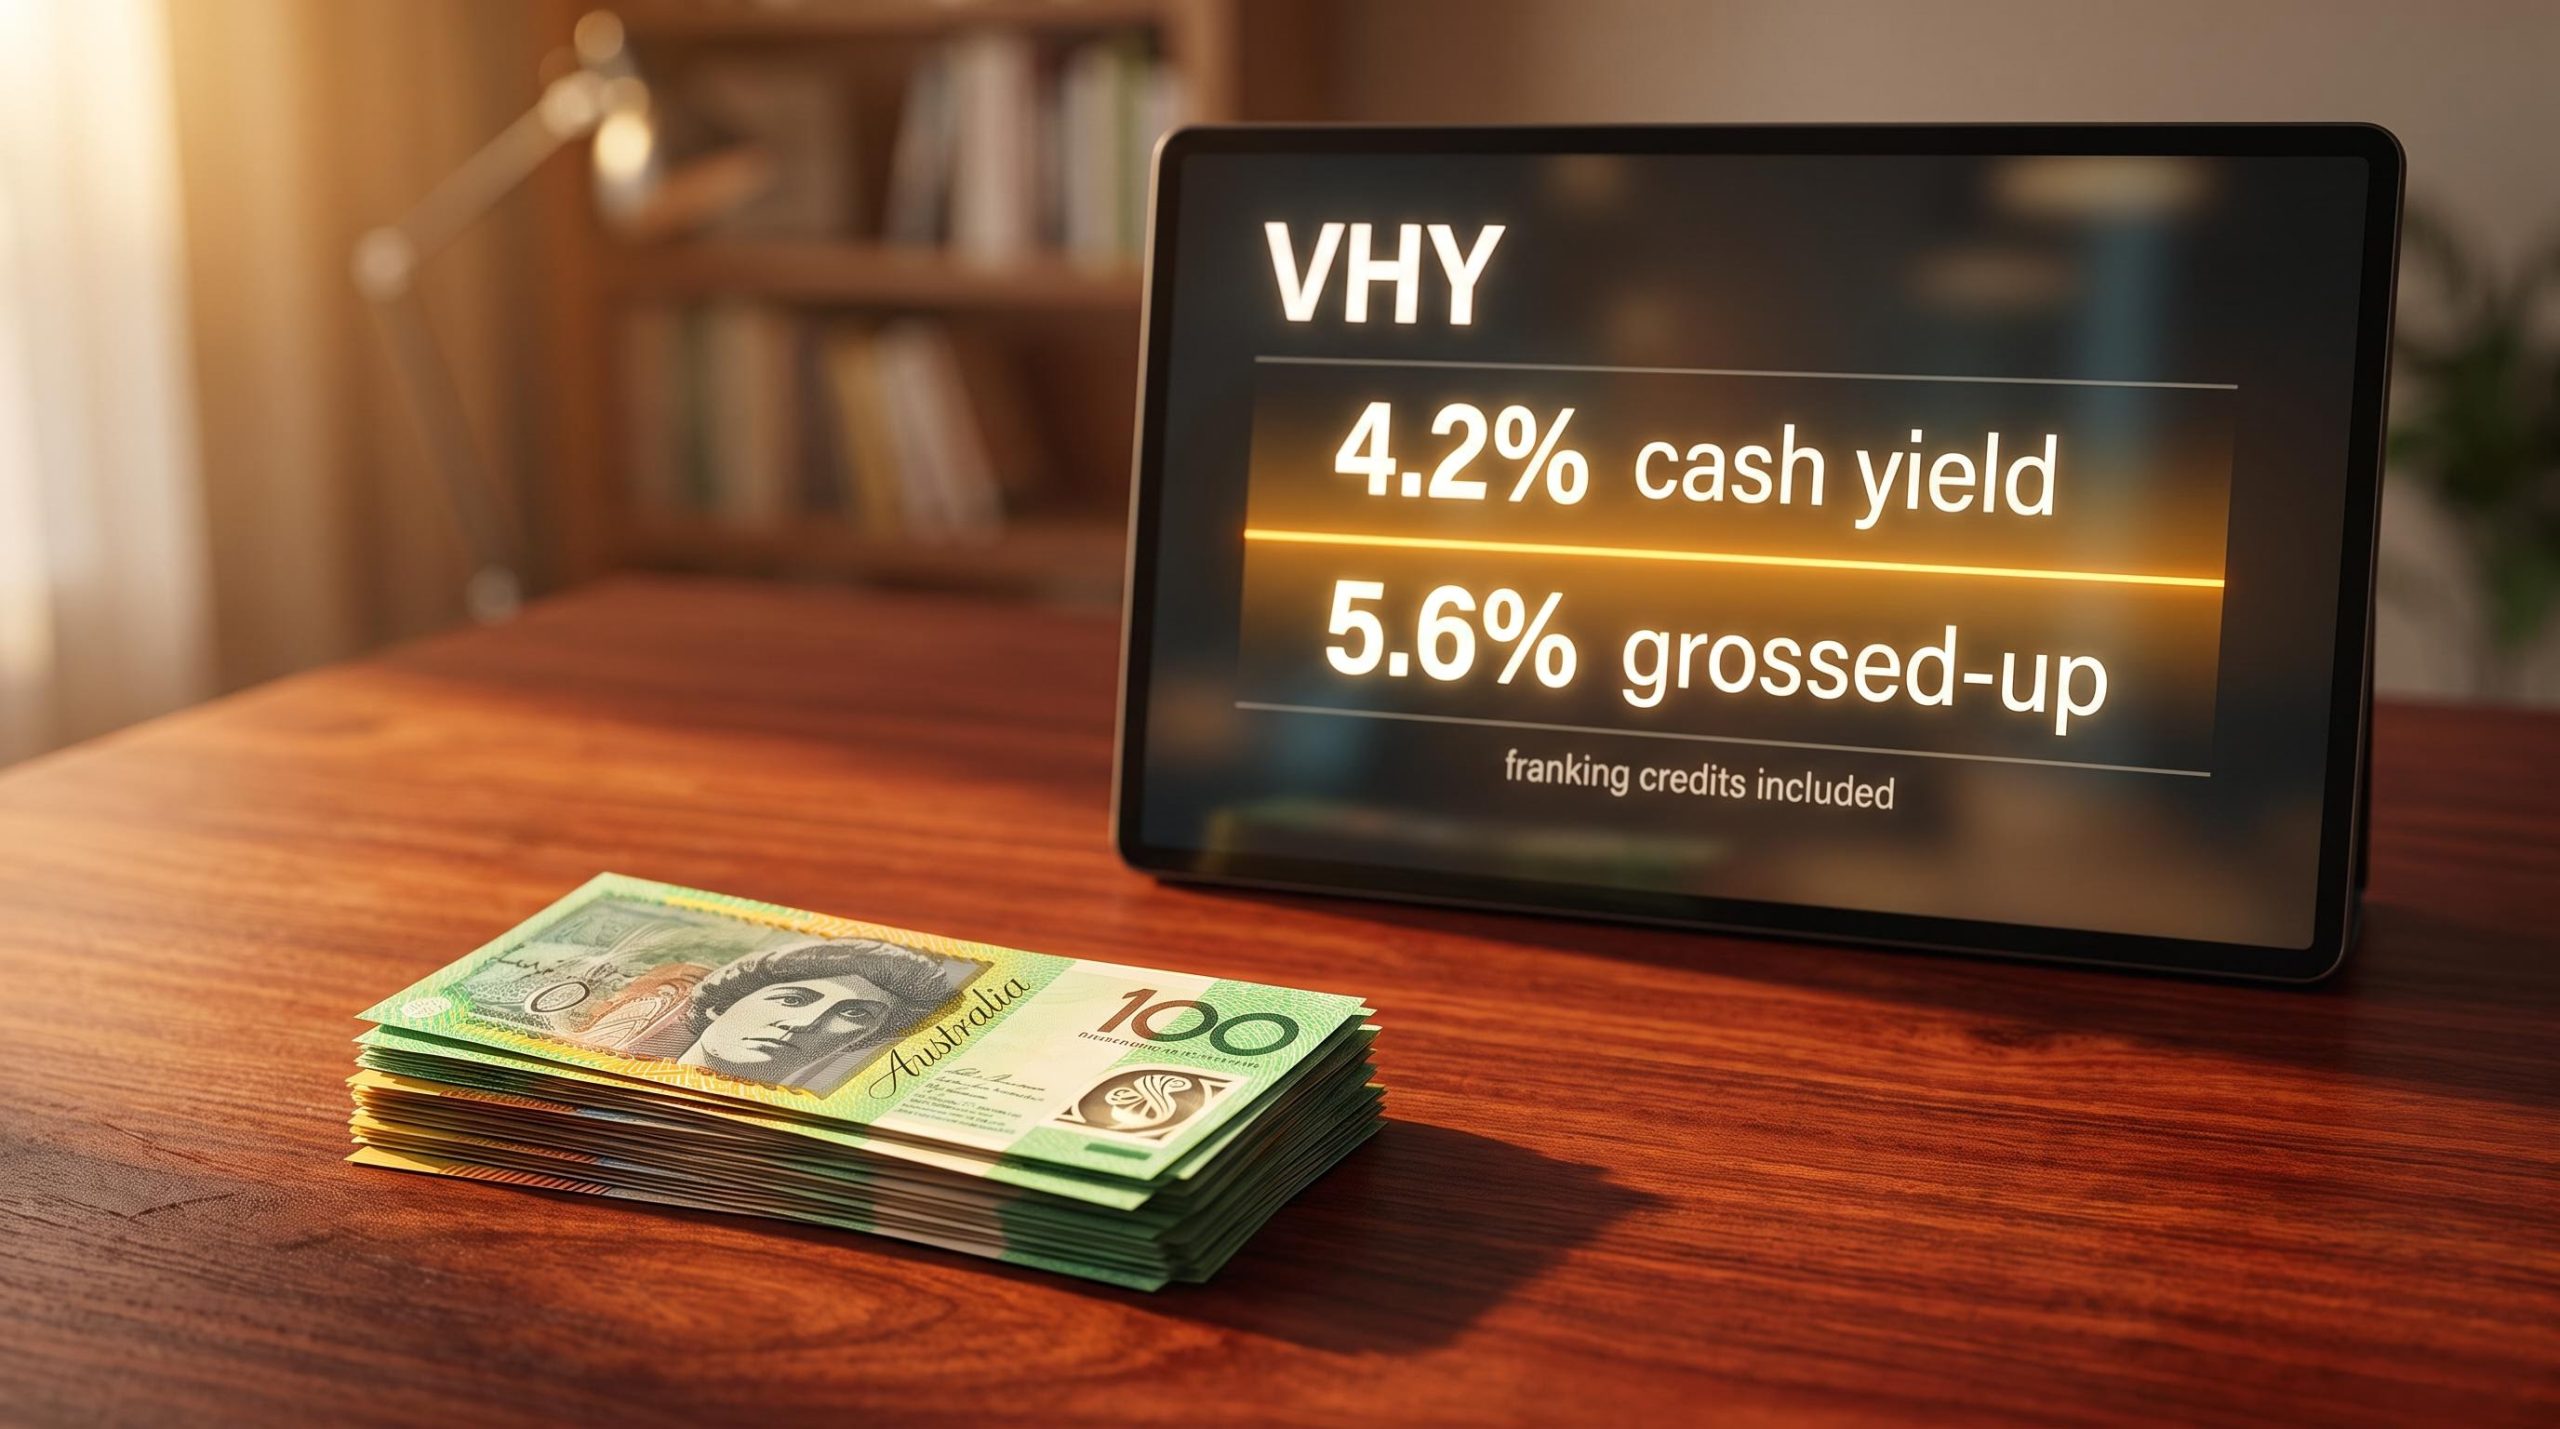
The forecast cash yield sits at roughly 4.2%, but the grossed-up yield including franking credits is closer to 5.6%. That gap means the capital you need swings by around $6,000, depending entirely on whether those franking credits land in your pocket.
VHY is a popular target for Australian income investors, and the reasons are obvious: a high-yield design, heavily franked distributions, and a portfolio stuffed with familiar blue-chip names. The trouble is that the maths behind a fixed income target from this fund is far less tidy than the headline yield suggests.
After reading this, you will know the specific unit count and capital figure you need, understand exactly what determines which of those two numbers applies to you, and see the structural risks that can push your actual income well away from the forecast. Let’s start with the number itself.
How many VHY units does it take to reach $1,000 a year?
Two numbers answer that question, and both are correct depending on who you are.
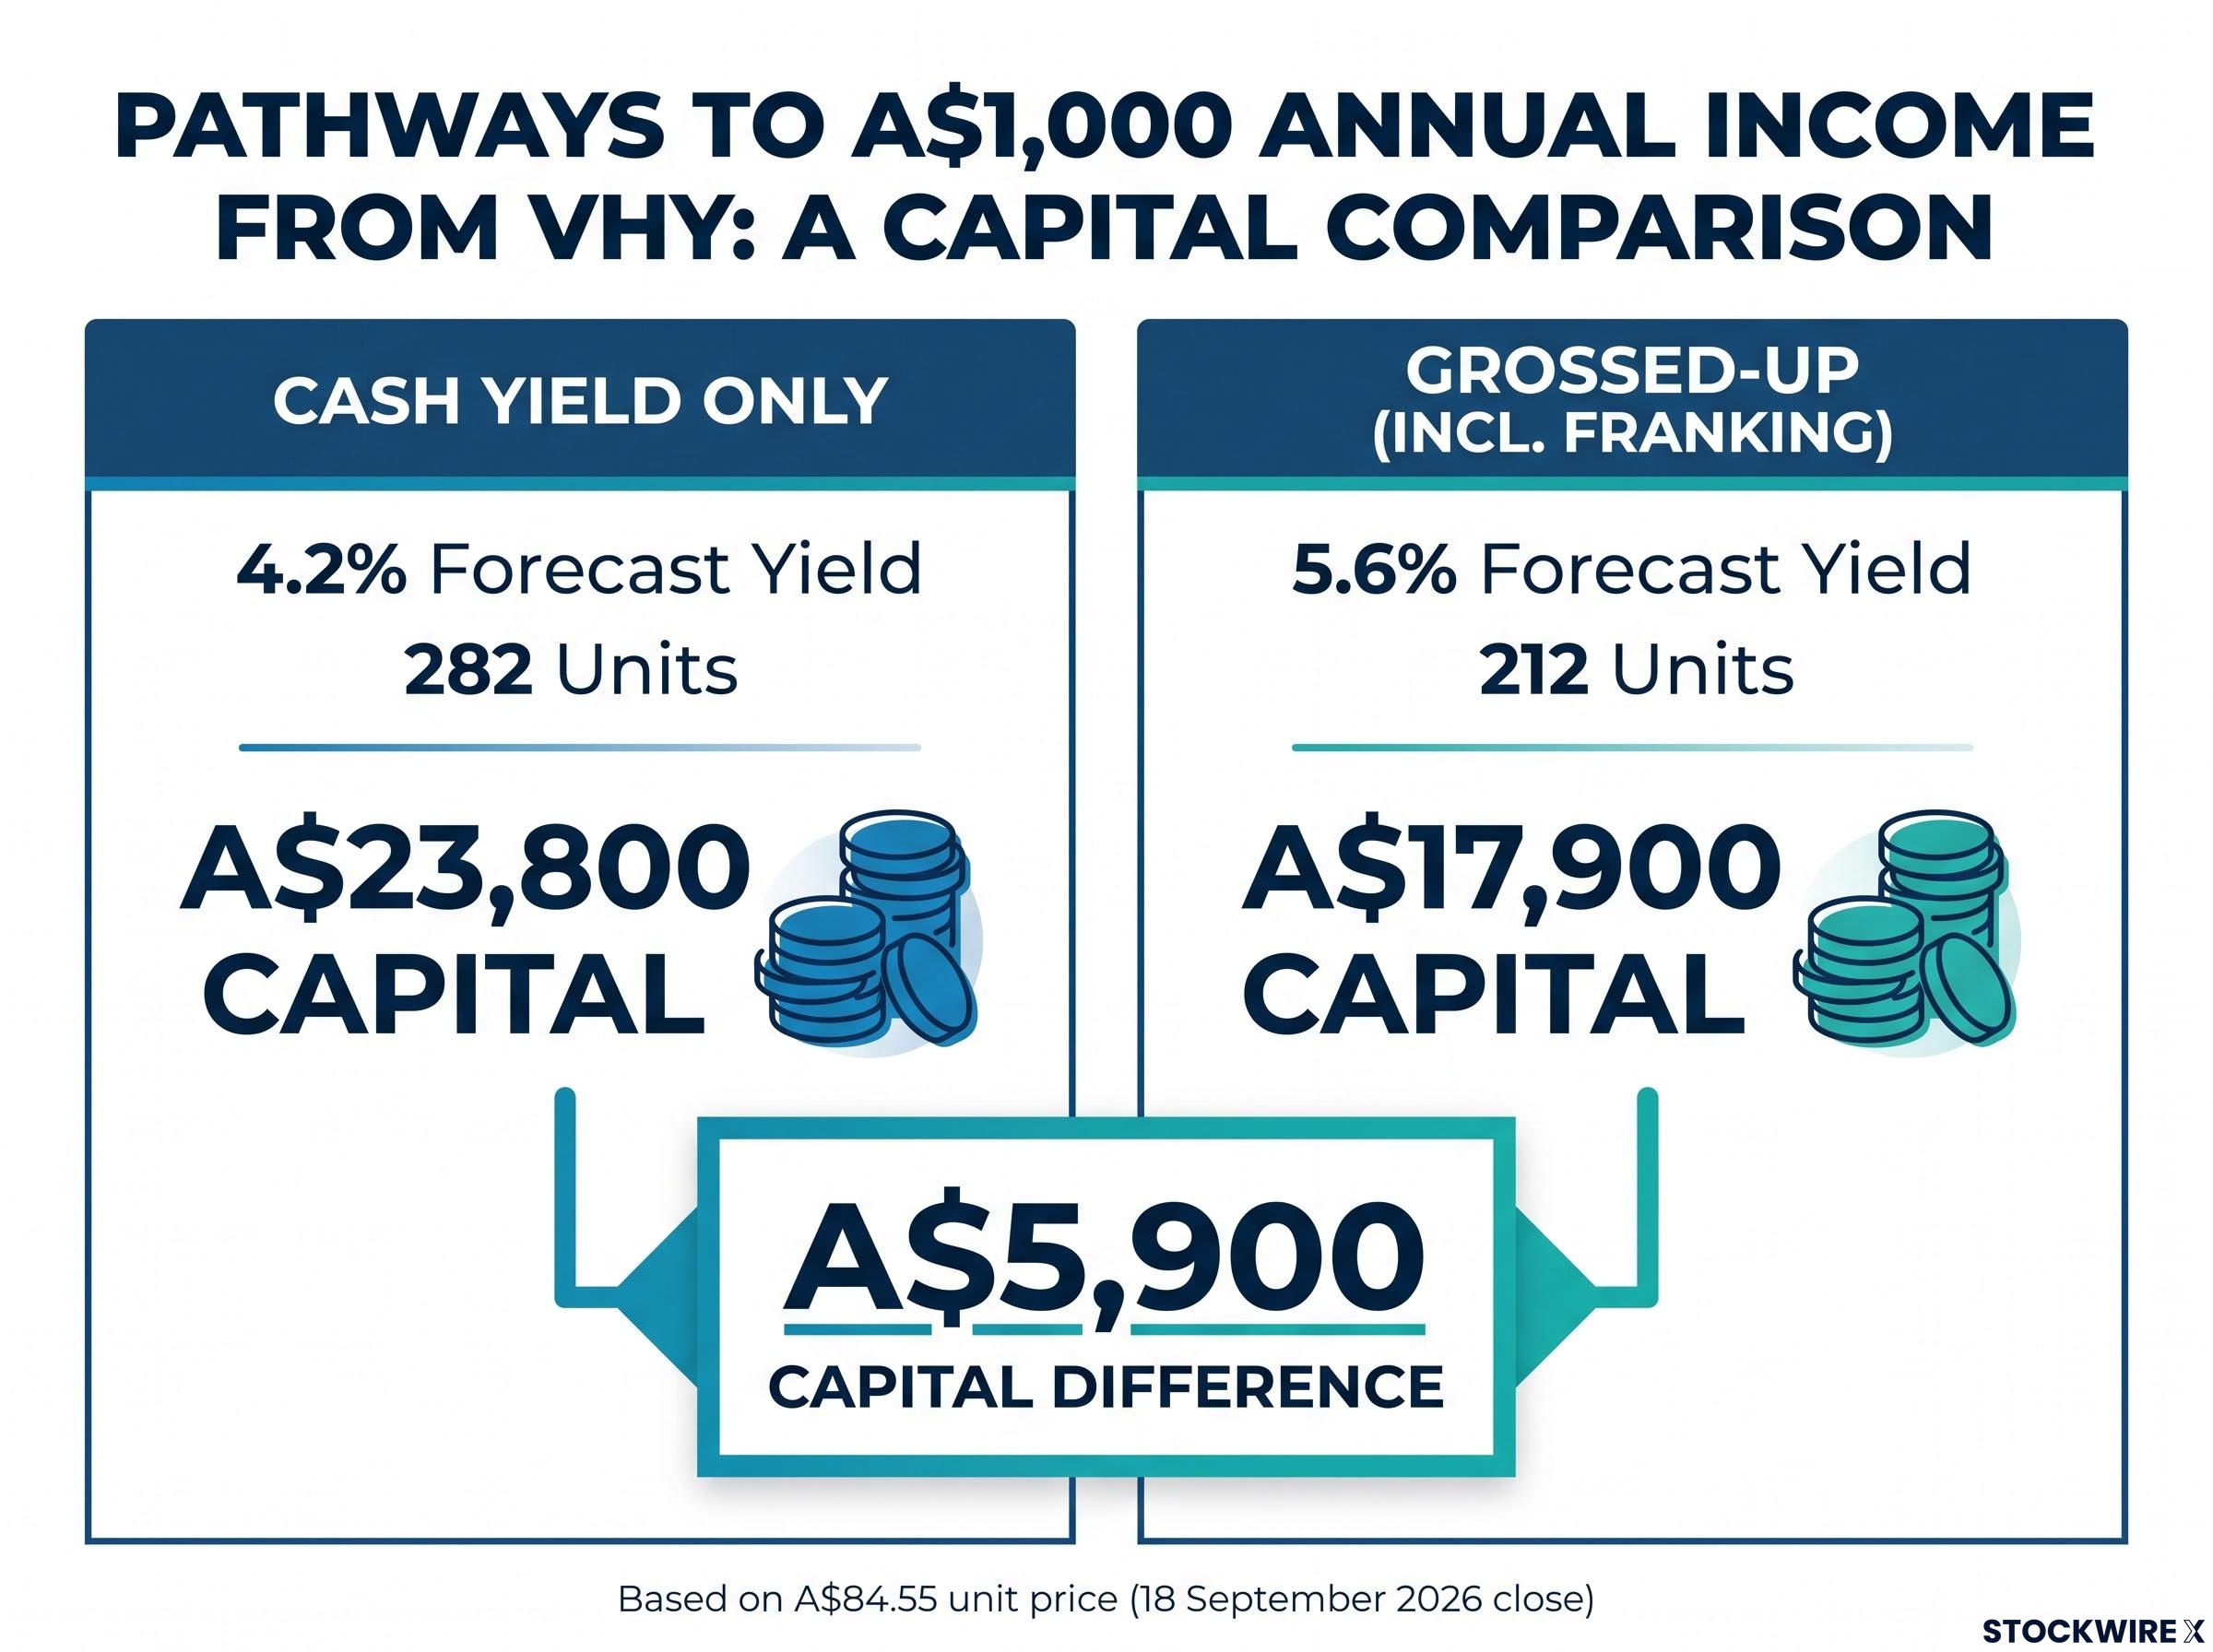
To generate $1,000 a year on the forecast cash yield of 4.2%, you need roughly 282 units. To hit the same target on the grossed-up yield of 5.6%, which counts franking credits as income, you need only around 212 units. At the current unit price of A$84.55 (18 September 2026 close), that is the difference between about A$23,800 and A$17,900 of capital.
| Yield basis | Forecast yield | Units required | Approx. capital | Income target |
|---|---|---|---|---|
| Cash yield only | 4.2% | 282 units | A$23,800 | $1,000 |
| Grossed-up (incl. franking) | 5.6% | 212 units | A$17,900 | $1,000 |
That A$5,900 capital difference is not a rounding quirk. It is the practical consequence of whether you can fully use the franking credits attached to VHY’s distributions, and that depends on your tax situation rather than on the fund itself.
VHY pays distributions quarterly, so the income arrives in four instalments across the year. Looking at what actually landed over the past 12 months grounds the forecast in reality rather than projection.
- Q4 2025: A$1.0969 per unit
- Q1 2026: A$0.6583 per unit
- Q2 2026: A$0.8114 per unit
- Q3 2026: A$0.4065 per unit
12-month cash reality check Total cash distributions from October 2025 to July 2026 came to approximately A$2.9731 per unit.
Here is where the gap between forecast and observed income becomes clear. At 282 units, that trailing per-unit figure produces roughly A$839 in actual cash distributions, about $161 short of the $1,000 target on a cash basis. The forecast yield is a projection, and the recent past did not quite match it.
The spread between 212 and 282 units is not a technical footnote. It tells you that your marginal tax rate is as important as the ETF itself in deciding whether this investment reaches its income goal. To understand which figure is yours, you need to understand franking.
When big ASX news breaks, our subscribers know first
What franking credits actually do to your VHY income (and who benefits most)
Franking credits are the single largest variable in the VHY income calculation, and the most commonly misunderstood.
The mechanism is simpler than it sounds. Australian companies pay corporate tax of 30% on their profits before distributing dividends. The franking credit attached to each dividend represents that tax already paid, and you can claim it as an offset against your own tax bill.
The franking credit formula converts a cash dividend into its grossed-up taxable equivalent using the 30/70 ratio, and the practical outcomes vary significantly depending on whether you are a working-age investor, a retiree, or an SMSF in pension phase.
The formula follows directly from that 30% rate. A franking credit equals the cash dividend multiplied by 30/70. So a fully franked cash dividend of $0.70 carries a $0.30 franking credit, and the grossed-up taxable amount you declare is $1.00.
What happens next depends entirely on your marginal tax rate relative to that 30% company rate. There are three outcomes.
| Your marginal tax rate | Franking credit treatment | Cash refund? | Effective yield |
|---|---|---|---|
| Above 30% | Offsets part of tax owed; you pay the difference above 30% | No | Below the grossed-up figure |
| Exactly 30% | Fully offsets tax on the grossed-up amount | No | Full grossed-up yield |
| Below 30% (incl. many retirees) | Excess credits refunded by the ATO in cash | Yes | Above the cash yield |
This is the counterintuitive part. Lower-income investors and retirees extract the most value from VHY’s franking, because the Australian Taxation Office (ATO) refunds excess credits in cash when they exceed your total tax liability. That inverts the usual assumption that high-yield investing rewards the biggest portfolios and the highest earners.
VHY’s distributions are around 85-90% franked, according to ReviewETF’s May 2026 profile. That heavy franking is why the grossed-up yield estimate of roughly 5.6% (Vanguard/FactSet forecast) rises as high as 7.5-8.0% on a trailing basis for an eligible resident taxpayer.
So whether your yield is the 5.6% grossed-up figure or the 4.2% cash figure comes down to a single variable: where your marginal rate sits relative to 30%. You need to locate yourself in that three-outcome model before the capital calculation from the previous section becomes personally meaningful.
Eligibility conditions that affect your franking credit claim
The credits only count if you meet the eligibility rules, and the main one has teeth.
The 45-day holding period rule To claim the franking tax offset, you must hold your units at-risk for at least 45 days around the ex-dividend date, not counting the day you buy or sell. Related payments rules also apply as anti-avoidance provisions.
For most people this is a non-event. If you hold VHY through its ordinary quarterly distributions, you satisfy the holding period without doing anything special. Short-term traders buying just before an ex-dividend date and selling straight after are the ones who fall foul of it.
The ATO rules on claiming a franking credit refund set out the qualified person test, the 45-day at-risk holding requirement, and the related payments provisions that determine whether your excess credits are refunded in cash or simply lost.
One caveat worth keeping in mind: the grossed-up yield figures quoted everywhere assume full eligibility. Your actual outcome depends on your own tax circumstances.
What VHY actually owns and why that shapes your income
The yield does not come from clever stock-picking. It comes from where the fund deliberately points.
VHY tracks the FTSE Australia High Dividend Yield Index and holds around 92 stocks. But the concentration is the story: the top 10 holdings account for 61.6% of assets, and the three largest sectors together make up more than 70% of the portfolio.
| Sector | Portfolio weight |
|---|---|
| Financials | 39.6% |
| Basic materials | 20.3% |
| Energy | 11.2% |
Those weights come from Vanguard’s own fact sheet as at the end of August 2026. Put the names to them and the concentration stops being abstract.
VHY’s sector concentration in financials and resources is not incidental to its performance record; over the 12 months to April 2026, CBA’s 44% price rise at a near-10% portfolio weighting accounted for a disproportionate share of the fund’s 22%-plus total return.
- Banks: Commonwealth Bank (CBA), National Australia Bank (NAB), Westpac (WBC), ANZ Group (ANZ)
- Resources: BHP Group (BHP), Rio Tinto (RIO)
- Others: Woodside Energy (WDS), Macquarie Group (MQG), Telstra (TLS), Transurban (TCL)
The fund’s own rules explain why the mix looks like this. No single industry can exceed 40% of the portfolio, and no single company can exceed a 10% weighting. Within those limits, VHY tilts hard toward the industries that pay the biggest dividends, and it excludes Australian Real Estate Investment Trusts (A-REITs) entirely.
The source of the yield ReviewETF puts it plainly: VHY’s high yield “comes from sector tilt, not stock-picking skill.”
That single feature is where the income and the risk meet. Buying VHY for income is a concentrated bet on the continued dividend-paying capacity of Australian banks, miners, and energy producers.
The implication matters for anyone treating a high-yield ETF like a bond. A banking downturn or a commodity price slump does not just dent your capital value. It can cut your income at the same time, because the same companies drive both. The income opportunity and the volatility risk are one structural feature, not two.
Why your $1,000 income target is a forecast, not a guarantee
The distributions are not fixed, and the recent record proves it.
Look again at the four quarters from the past year. The Q4 2025 payment of A$1.0969 per unit was more than 2.5 times the Q3 2026 payment of A$0.4065 per unit. That is a real within-year swing, and a single quarter like Q3 2026 would leave a meaningful shortfall against any annualised income target.
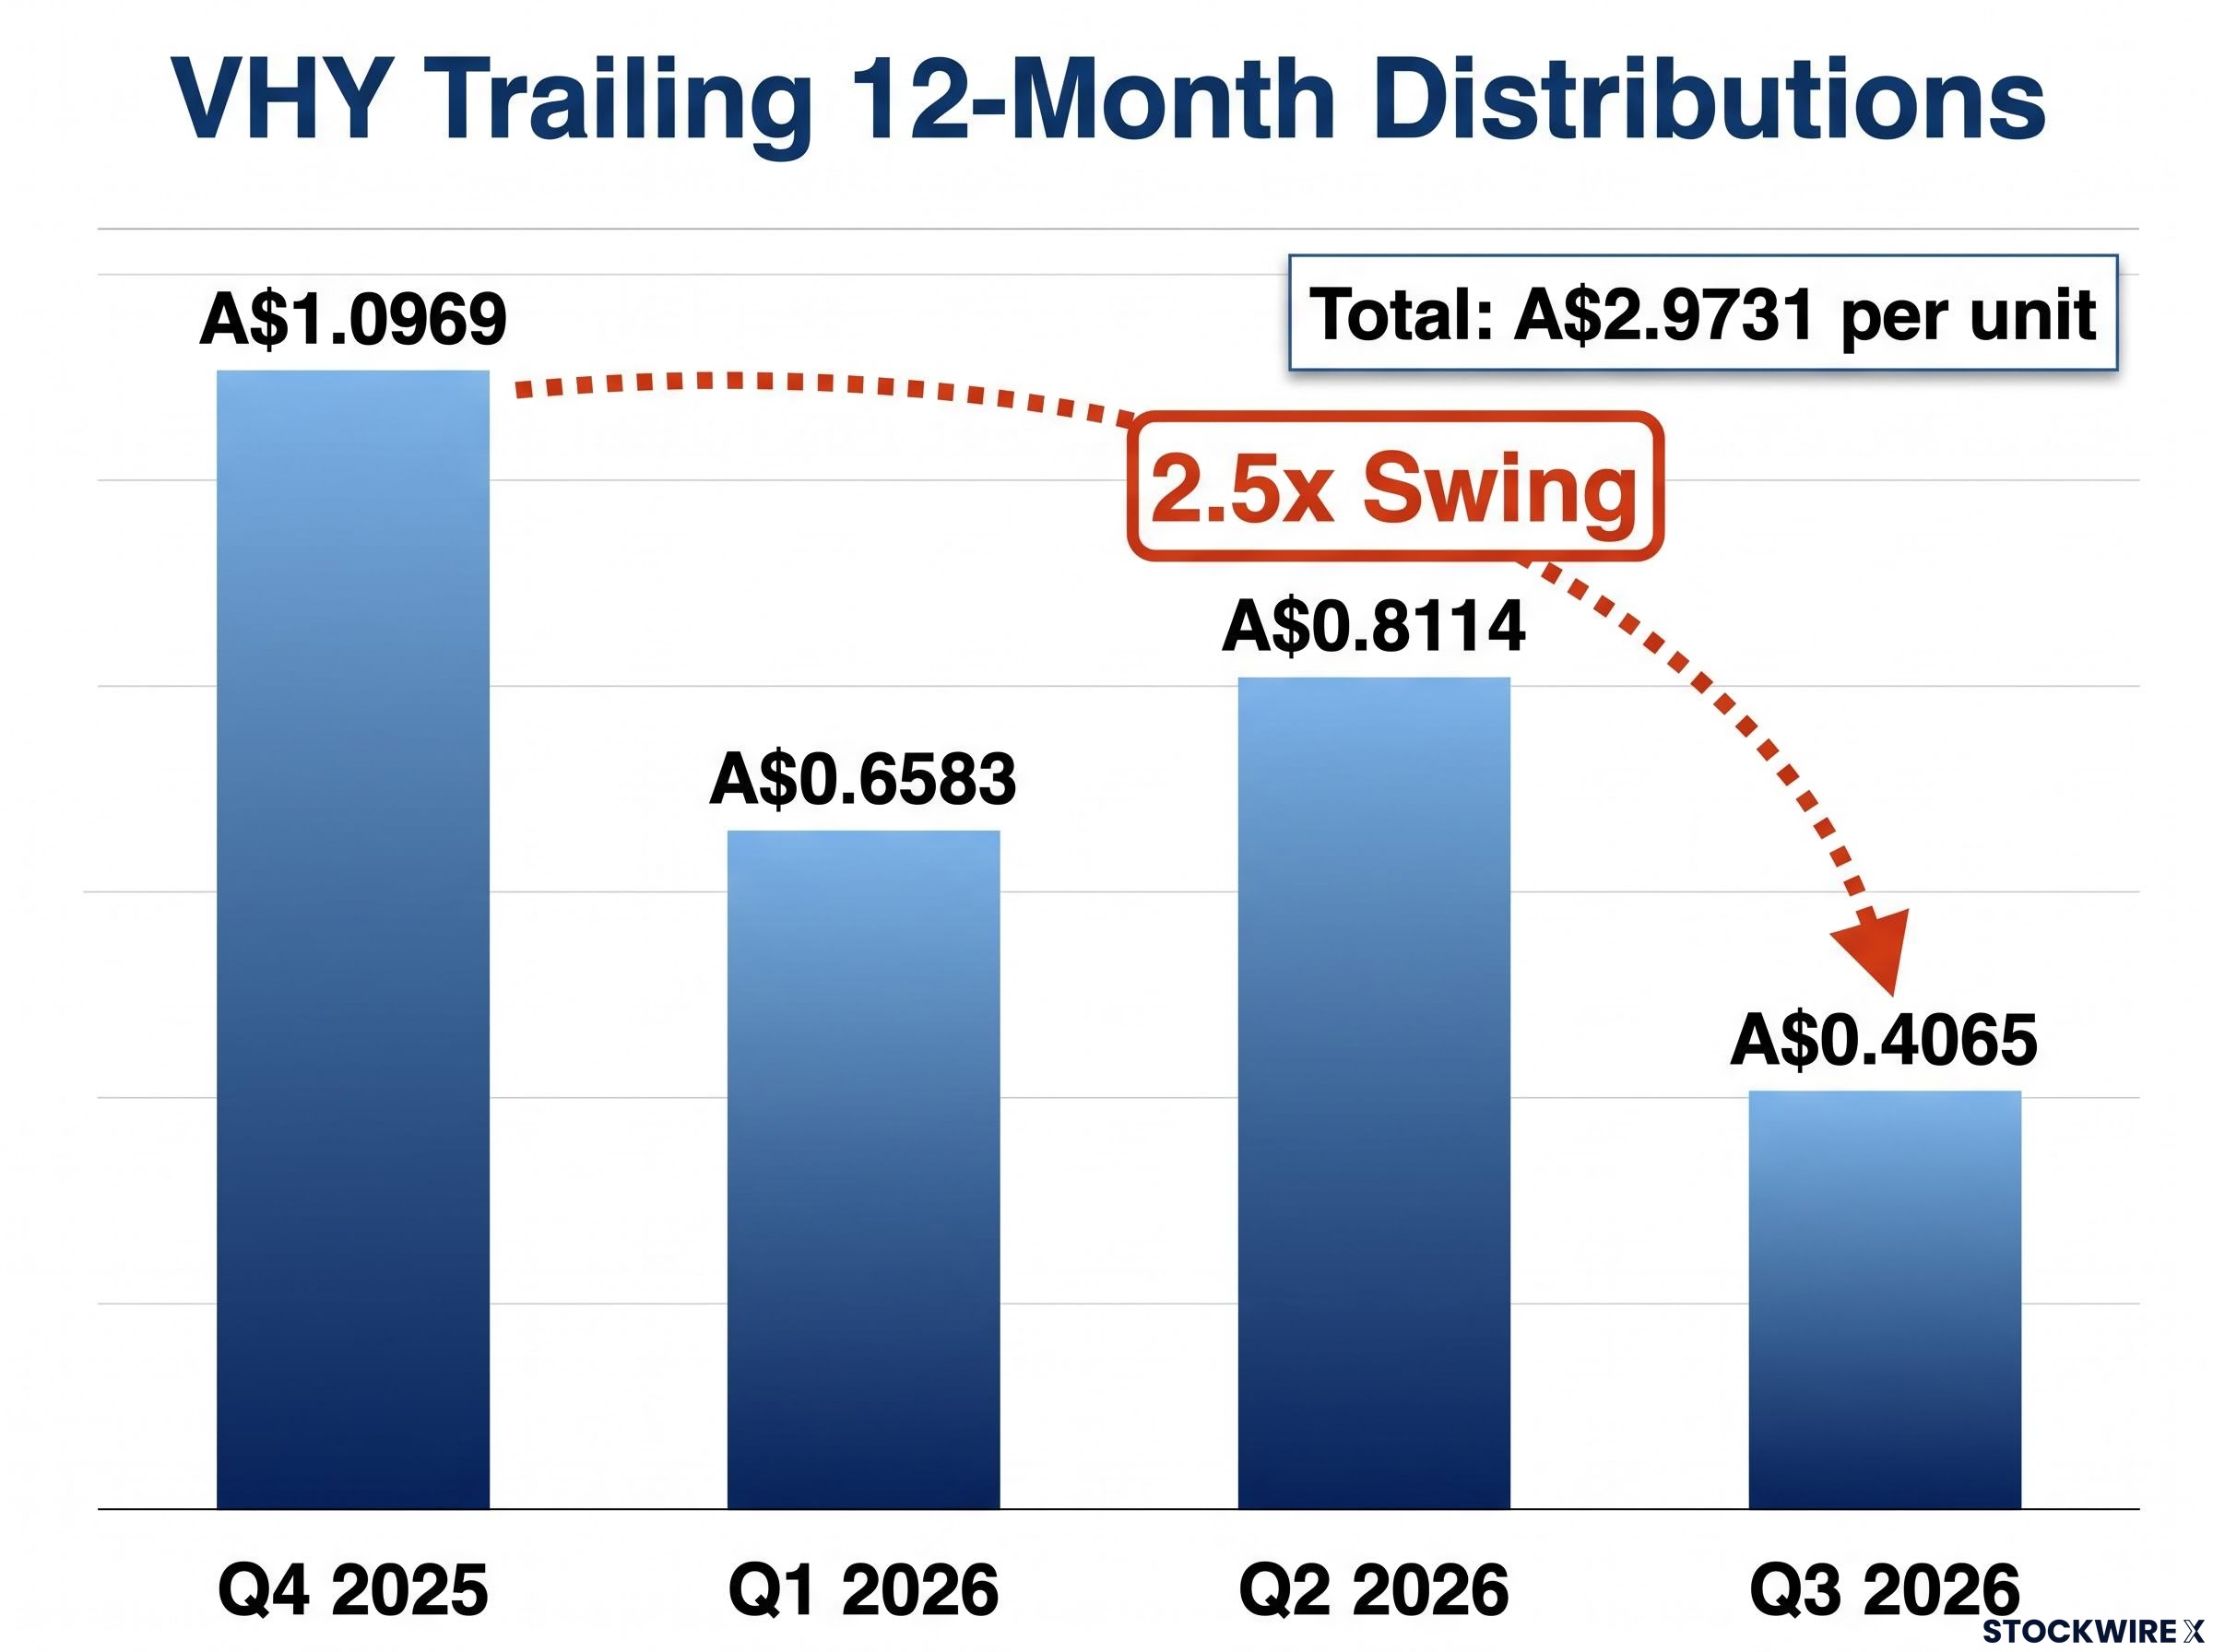
- Q4 2025: A$1.0969 per unit
- Q1 2026: A$0.6583 per unit
- Q2 2026: A$0.8114 per unit
- Q3 2026: A$0.4065 per unit
- Total: approximately A$2.9731 per unit
The reason distributions bounce is structural. VHY passes through whatever dividends its underlying companies actually pay, and bank and resources dividends move with earnings cycles, commodity prices, and each company’s capital management decisions.
This is also why the forecast and trailing yields differ. The forward-looking cash yield of 4.2% (Vanguard/FactSet, based on forecast 2027 dividends) sits below the trailing 12-month cash yield of roughly 5.5% (ReviewETF, May 2026). Neither is more true than the other; one looks ahead, one looks back.
The honest position ETFLens states it directly: VHY “distributions vary each period and are not guaranteed.”
Planning around VHY income without being caught short
Treat the forecast yield as a central estimate with genuine variance, not a fixed annuity payment. A practical safeguard is holding a modest cash buffer equal to about one quarter’s expected distribution, so a weak quarter like Q3 2026 does not force you to sell units at an awkward moment.
Investors who reinvest distributions in the stronger quarters and draw down in the leaner ones can smooth the experience, though that adds admin. The robust approach is to hold your income target as a long-run average rather than a number you expect to hit every single year.
ETFs are one of several income investing structures available to Australian investors; LICs, for instance, can retain profits in strong years to sustain dividends in weak ones, a smoothing mechanism that pass-through ETF structures like VHY cannot replicate.
What to weigh up before you buy VHY for income
VHY is not an income machine with a predictable dial. It is a concentrated sector bet with historically strong but variable dividend output, and the right question is not “is VHY good?” but “does this tilt match my situation?”
Three variables decide that for you:
- Your marginal tax rate. This determines whether you access the roughly 5.6% grossed-up yield or the 4.2% cash yield, and therefore whether you need around 212 or 282 units.
- Your tolerance for sector concentration. Roughly 70% of the fund sits in banks, miners, and energy.
- Your ability to plan around variable distributions. Quarterly payments are not fixed, as the 2.5x swing over the past year showed.
Cost is part of the trade-off too. VHY charges a management fee of 0.25% per annum, against 0.07% for a broad-market alternative like the Vanguard Australian Shares Index ETF (VAS). That premium is only worth paying if the income tilt genuinely serves your goal.
| Attribute | VHY | VAS |
|---|---|---|
| Index tracked | FTSE Australia High Dividend Yield | S&P/ASX 300 |
| Number of holdings | ~92 | ~300 |
| Management fee | 0.25% p.a. | 0.07% p.a. |
| Income yield | Higher | Lower |
| 10-year total return | ~6.8% p.a. | ~8% p.a. |
The return figures come from Motley Fool coverage, and they capture the core trade-off: VHY has delivered higher income yield but lower total return over a decade. There is a diversification catch as well. ETFLens estimates roughly 60% overlap by weight between VHY and VAS, so pairing them tends to double your weight in high-yield sectors rather than spread your risk.
Investors exploring alternatives to VHY will find our comprehensive walkthrough of ASX income ETF selection, which applies a five-filter framework across all 40-plus Australian equity income ETFs to identify which products clear the grossed-up yield hurdle and which fail on AUM, concentration, or return-of-capital grounds.
This article is for informational purposes only and should not be considered financial advice. Investors should conduct their own research and consult with financial professionals before making investment decisions. Past performance does not guarantee future results, and financial projections are subject to market conditions and various risk factors.
The income case for VHY is real, but so is the complexity
Hitting $1,000 in annual passive income from VHY takes between 212 and 282 units, or roughly A$17,900 to A$23,800 at current prices. That range is not sloppy estimating. It reflects a real variable sitting in your own tax position.
Three layers of complexity shape whether the target holds. Franking credit eligibility widens or narrows the yield depending on your marginal rate. Sector concentration means your income and your capital can fall together when banks or miners struggle. And distribution variability, shown by that 2.5x swing between quarters, means the target is a long-run average rather than a quarterly certainty.
None of that makes VHY a buy or an avoid. It makes it a tool you can now use with your eyes open. Investors who understand the mechanics, the tax implications, and the sector risk are far better positioned to put VHY to work than anyone chasing the yield headline alone.