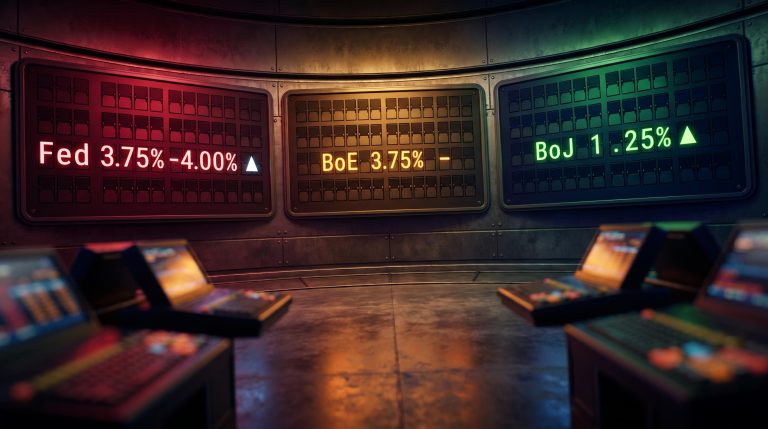
Equity indices climbed hard last week. The Nasdaq rose roughly 2% and the S&P 500 added about 1%, in the same stretch that 10-year Treasury yields were pressing toward the 5% ceiling and oil had just posted four consecutive losing sessions.
That combination should not produce a rally. Rising yields compress equity valuations; falling oil often signals cooling demand. Yet stocks surged anyway.
The move is not random. It is the newest iteration of a pattern that has repeated through 2025 and 2026: geopolitical pressure builds, a summit gets announced, and equities reverse sharply. The next instance is already scheduled, a 24 September 2026 White House meeting between US and Chinese leadership, landing squarely inside the one-to-one-and-a-half month window before the November midterms.
Here is the framework for reading what the data is actually telling you about who is moving markets and why. You will finish this piece able to identify a politically driven market move, know which macro variables to watch during an administration’s intervention window, and understand why the setup after the votes are counted may matter more than the rally before them.
The diplomatic rally playbook: tension, summit, surge
The sequence has three phases, and it has run cleanly enough to become predictable. First comes geopolitical pressure, whether manufactured, real, or some blend of both. Then a staged diplomatic breakthrough: a meeting, a summit, a handshake. Then the relief rally in equities.
Trace it back through this cycle and the repetition speaks for itself. In mid-March, a meeting between Scott Bessent and Li Fang preceded a market recovery within two weeks. The template was already forming.
The May 2026 Trump-Xi summit in Beijing followed the same arc. According to a Commonwealth Bank of Australia note dated 15 May 2026, the Dow rose 0.75%, the S&P 500 gained 0.77%, and the Nasdaq climbed 0.88%, with Reuters reporting the S&P 500 and Nasdaq closing at record highs as tech stocks rallied.
Go back further, to the US-China tariff truce of May 2025, and the scale of a genuine relief trade becomes clear.
The S&P 500 rose 3.3% on the 90-day ceasefire, per Yahoo Finance, while the Wall Street Journal reported the Nasdaq Composite climbed 4.3%, closing more than 20% above its April low. That is the benchmark for what full-throated diplomatic relief looks like.
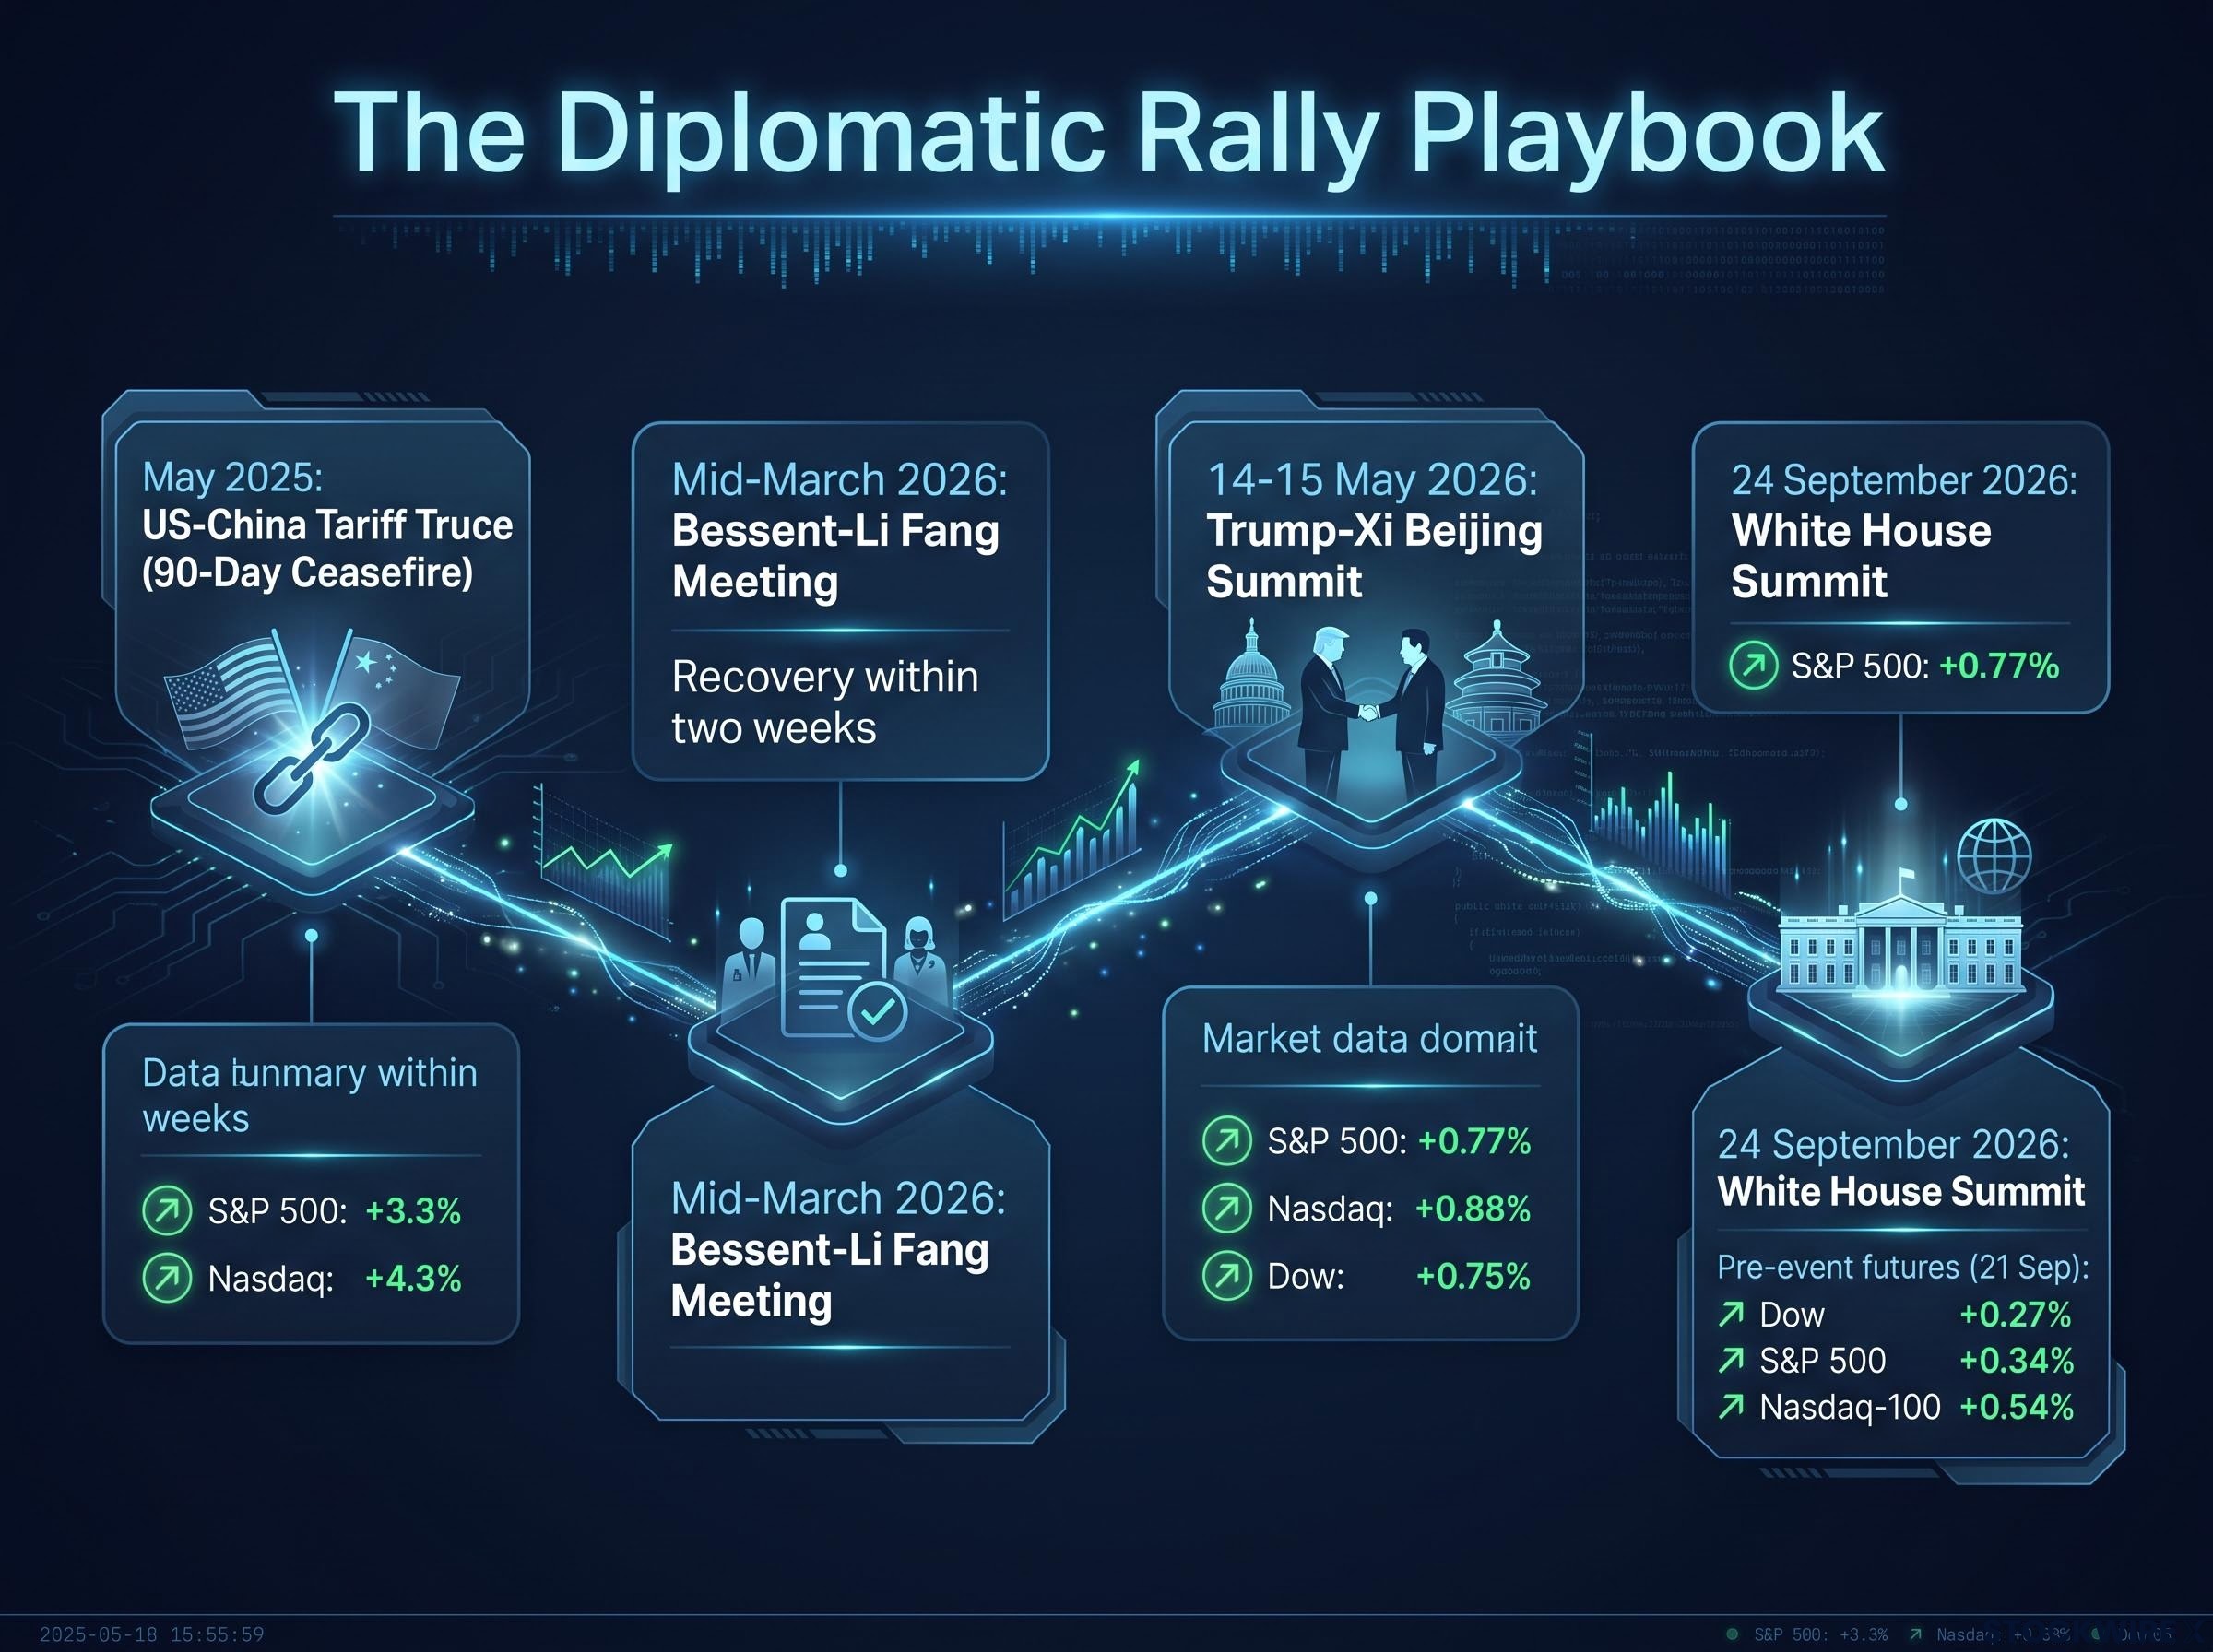
Now the 24 September 2026 White House summit slots into the identical template. Futures were already pricing optimism before any substantive outcome. On 21 September 2026, Stocktwits News reported Dow futures up 0.27%, S&P 500 futures up 0.34%, and Nasdaq-100 futures up 0.54%, all ahead of the scheduled meeting.
| Date | Event | Key Index Move | VIX Direction | Rally Timing |
|---|---|---|---|---|
| Mid-March 2026 | Bessent-Li Fang meeting | Recovery within two weeks | Lower | ~2 weeks |
| 14-15 May 2026 | Trump-Xi Beijing summit | S&P 500 +0.77%, Nasdaq +0.88% | Lower | Record highs on the day |
| 24 September 2026 | White House summit | Futures higher pre-event | Compressing | Priced in ahead of outcome |
The mechanics behind this are documented. An International Monetary Fund working paper found that its Geopolitical Risk index spikes during confrontations but falls significantly around summits and multilateral talks. Research from Kennesaw State’s Coles College showed implied volatility, measured by the VIX, drops materially around major summits like the G7 and G20.
Policy-driven market risk concentrated in single-session swings ranging from a 2.06% S&P 500 decline to a 6.87% KOSPI surge across the January to May 2026 cycle, with geographic exposure mapping before the event determining which markets captured the largest relief-rally gains rather than broad sentiment.
The consistency across these cycles tells you something specific. Markets are not repricing trade fundamentals on new information. They are pricing the removal of a tail risk that was itself partially constructed. Recognising that is what separates a trader chasing the announcement from one positioned before it.
When big ASX news breaks, our subscribers know first
What political market rallies actually look like under the hood
The diplomatic optics are only half the story. The rally is actively supported by concurrent suppression of two macro headwinds during the pre-midterm window: 10-year Treasury yields and oil prices.
Start with the instruments, because they are concrete. On 21 September 2026, TradingEconomics and Investing.com listed the 10-year yield at 4.95%, down 0.05 percentage points on the day but up roughly 0.80 percentage points year-over-year, after an intraday peak of 5.04% on 15 September 2026. Front-month WTI crude, meanwhile, sat at $95.78 per barrel, dropping 4.51% in a single session, with a month earlier the prior contract having traded above $100.
Both variables pulled back from ceilings at the same time. That timing is the tell.
On oil, the administration’s toolkit is visible. Politico characterised the White House as the “Oil Market Jawboner-in-Chief,” documenting several levers being pulled at once:
- Temporarily easing sanctions on Russian oil purchases by India
- Offering naval escorts through the Strait of Hormuz
- Touting US and Venezuelan production
- Direct verbal jawboning of prices
On yields, the mechanism is counter-pressure. When short interest, trend-following, and volatility-targeting strategies stack on one side of the bond trade, the administration leans against it, producing overnight equity moves of 0.5% or more.
The Treasury buyback programme running from 9 September to 4 November 2026 sits alongside the oil and yield suppression toolkit as a third concurrent instrument, with operations expanding from a $2 billion to at least $4 billion ceiling per session for long-dated securities across that exact pre-election window.
The framing from the original analysis is blunt: during this window, fighting the Treasury and the administration is as dangerous as fighting the Fed. Positioning against a coordinated suppression effort in a six-week electoral window carries asymmetric risk.
Where the toolkit hits its ceiling
The window is real. It is also bounded, and the structural counterarguments matter for anyone tempted to treat it as permanent.
On oil, NBC News research shows that Strategic Petroleum Reserve releases have historically added only cents per gallon of relief, not a structural change in price. The lever moves sentiment more than fundamentals.
On yields, the institutional view is firmer still. U.S. Bank, JPMorgan, and the Kansas City Fed all stress that Treasury yields respond to Fed policy, inflation, and Treasury supply dynamics, not to direction from the White House.
The honest read for a US investor is that both variables can be compressed for weeks, not months. The genuine risk is positioning as though the suppression window is a permanent feature rather than a tactical one that closes with the calendar.
Why Senate polling is the signal behind the signal
Move the frame from markets to the political calculation driving them, and the timing stops looking arbitrary. This is not generic incumbency behaviour. It is a response to specific, quantifiable vulnerability in Senate races that were not supposed to be close.
Ohio is the lead case, a state considered competitive but now tilting the wrong way for the administration.
A Bowling Green State University/YouGov poll released 16 September 2026 shows Democrat Sherrod Brown leading Republican Jon Husted 48% to 45%, a three-point margin. The New York Times’ Ohio polling page lists multiple August-September surveys from Trafalgar, InsiderAdvantage, and Abacus Data putting Brown ahead by three to five points.
That is a seat the administration cannot comfortably afford to lose, and it is not the only one under pressure. USA Today’s 18 September 2026 aggregation showed narrow Democratic leads or toss-up conditions across a cluster of critical states.
| State | Democrat | Republican | D Lead | Source / Date |
|---|---|---|---|---|
| Ohio | Brown 48% | Husted 45% | +3 | BGSU/YouGov, 16 Sep |
| Alaska | Peltola 53% | Sullivan 47% | +6 | USA Today, 18 Sep |
| Georgia | Ossoff 49% | Collins 43% | +6 | USA Today, 18 Sep |
| Michigan | El-Sayed 48% | Rogers 45% | +3 | USA Today, 18 Sep |
| Texas | Talarico 47% | Paxton 46% | +1 | USA Today, 18 Sep |
Aggregators including Pollsmax, Decision Desk HQ, and VotePredictor confirm the same picture: narrow Democratic leads or toss-ups across the map.
Senate outcome scenarios carry nearly equal probability weights on prediction markets, with a Democratic sweep and a split Congress both sitting in the 39-47% range, meaning investors who position for either outcome as if it were certain are absorbing uncompensated scenario risk across the November window.
For a US market participant, this polling is not political colour. It is the variable that determines how hard the administration presses on yields, oil, and diplomatic sequencing through October. Track the shifts in Ohio, Georgia, and Texas as a leading indicator for how long the suppression window holds, not as a sideshow to the market story.
After the votes are counted: what the historical cycle actually tells you
The historical record does something useful here. It validates the tactical suppression thesis, then quietly reframes the more important trade.
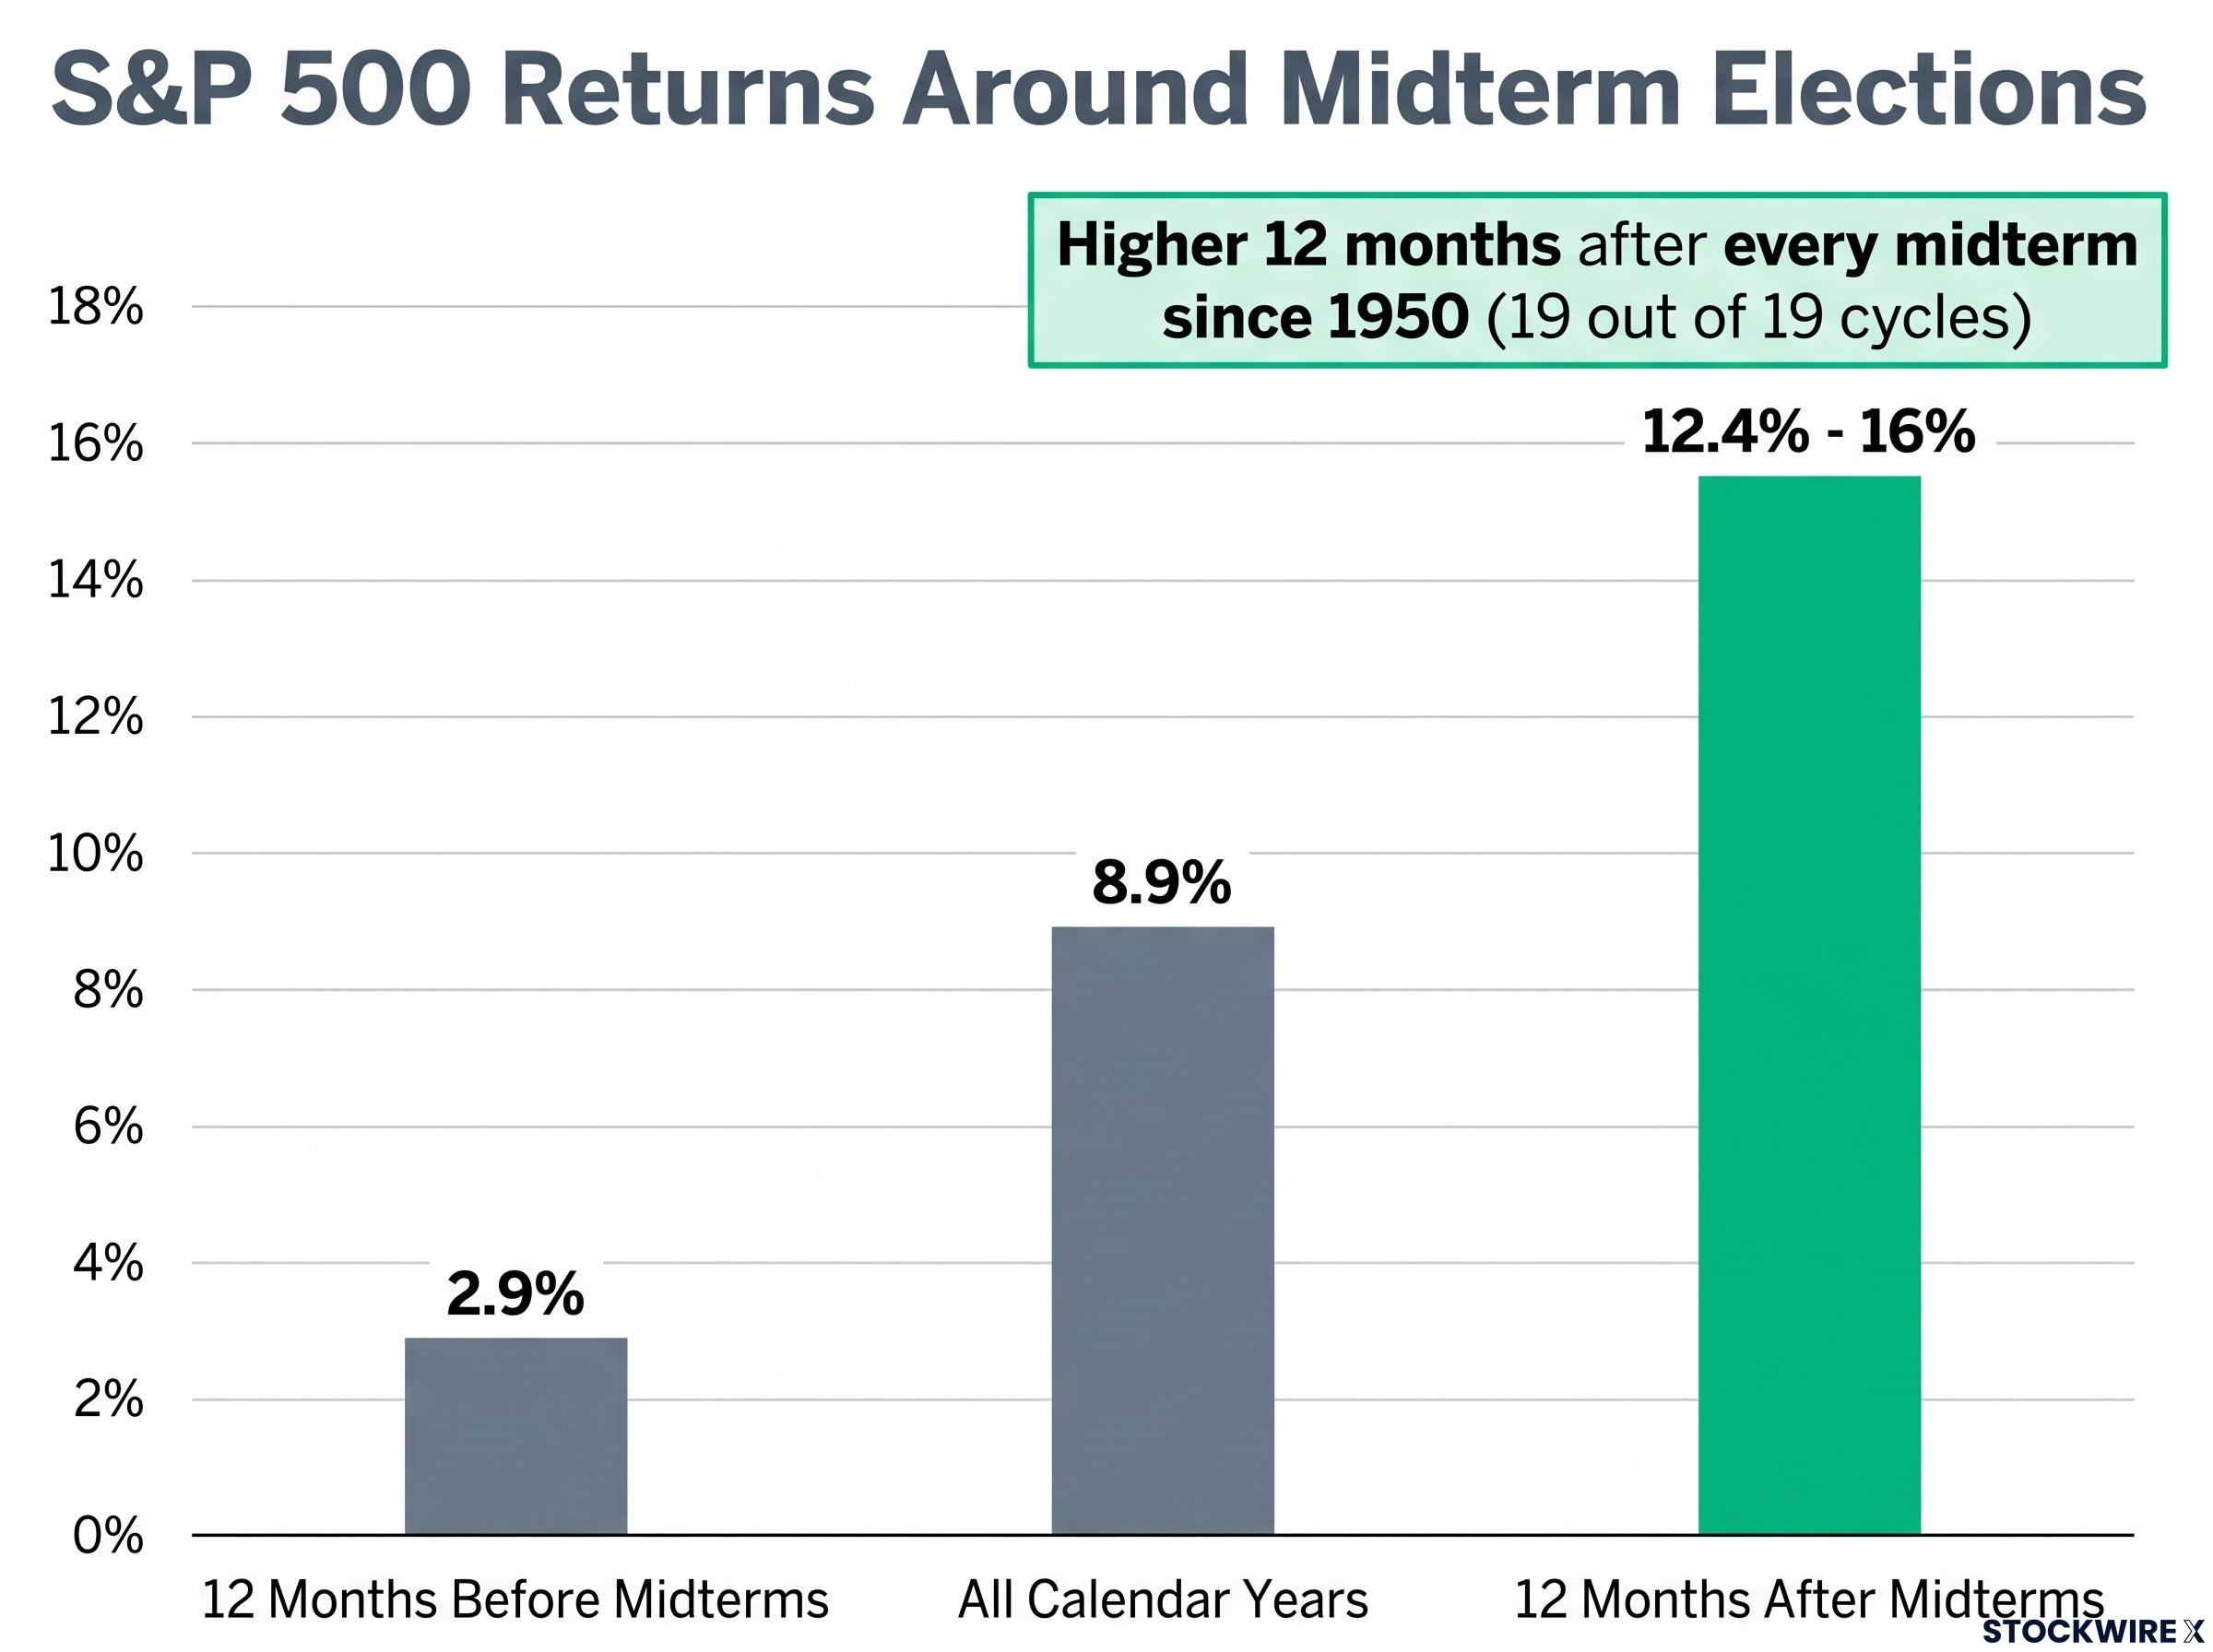
The pre-midterm environment is structurally weak. U.S. Bank finds the S&P 500 averages just a 2.9% return in the 12 months before midterm elections, against an 8.9% average across all years. The administration is compensating for a stretch that would otherwise produce below-average returns on its own.
What follows the vote is a different picture entirely.
| Period | Average S&P 500 Return | Source |
|---|---|---|
| All calendar years | 8.9% | U.S. Bank |
| 12 months before midterms | 2.9% | U.S. Bank |
| 12 months after midterms | 12.4%-16% | RBC, RiseWealth, Fidelity |
The consistency is what elevates this from noise to signal. Academic research from Canterbury shows the S&P 500 has been higher 12 months after every midterm election since 1950, a clean 19 out of 19 cycles.
The post-midterm return record covers 19 cycles with no exceptions since 1950, but the 2026 setup complicates the base case because the S&P 500 entered the midterm window up 14.8% year-to-date, operating from an already elevated base rather than the flat or negative starting points typical of prior cycles.
That record tells you where to put your attention. Be tactically aware of the administration’s six-week window, but position for the post-midterm setup, where the clearing of electoral uncertainty has produced the most consistent positive return environment in the modern equity record.
This cycle carries genuine uncertainty the historical average cannot capture. Three variables will decide whether the post-vote pattern holds:
- Fed policy trajectory. Morgan Stanley’s 2026 note stresses that equities rarely sustain meaningful out- or under-performance in the three to six months after a vote, with Fed policy the dominant medium-term driver.
- US-China diplomatic durability. The summit architecture has to hold rather than fracture back into confrontation once the electoral pressure lifts.
- Structural oil supply. The original analysis frames a longer-term bullish oil trade that reasserts once the political suppression window closes, which cuts against equities if energy costs climb.
Past performance does not guarantee future results. Financial projections are subject to market conditions and various risk factors.
Reading this cycle clearly before the noise peaks
Pull the four layers together and a single framework emerges for the next six to eight weeks. The diplomatic rally template signals the trigger before the announcement. The macro suppression toolkit tells you which variables are being managed. The Senate polling explains the intensity and timing. The historical cycle tells you where the more durable trade sits.
The tactical window is real, but it is fenced by the November midterms and by the honest limits of the suppression toolkit. The administration can extend the window; it cannot hold it open indefinitely. Yields, oil supply, and Chinese trade posture will reassert on a timeline the White House does not fully control.
The perceptual shift this framework asks for is simple. Watch these as market signals, not political headlines:
- Senate polling movement in Ohio, Georgia, Texas, and Michigan through October
- The next concrete US-China diplomatic signal after the 24 September summit
- 10-year yield behaviour relative to the 5% ceiling
- WTI crude once the suppression window closes
- Fed communications through October
This article is for informational purposes only and should not be considered financial advice. Investors should conduct their own research and consult with financial professionals before making investment decisions.
Read this way, October’s polling shifts and summit sequencing stop being news to react to. They become the leading indicators for how long the window holds, and that is the read the framework was built to give you.