
Four of the world’s largest economies posted their freshest economic scorecards in the past three weeks, and the results point in strikingly different directions. The UK beat growth expectations, the eurozone confirmed its plodding pace while inflation re-accelerated, Japan stayed in measured reflation, and China’s monetary data surprised to the upside but left questions about real demand unanswered. With US inflation dominating financial media in May 2026, the international picture has received less attention than it deserves. Yet the divergences now visible across the UK, eurozone, Japan, and China carry real implications for globally diversified portfolios, currency dynamics, and central bank sequencing. A fresh batch of flash purchasing managers’ index (PMI) readings and April inflation prints is scheduled for release beginning 21 May 2026, making this a moment to establish a baseline understanding of where each economy actually stands. What follows synthesises the most recent confirmed data releases across all four economies, explains what each reading means in structural context, identifies the divergences that matter for investors, and frames the questions that next week’s data will need to answer.
The UK’s Q1 2026 beat: stronger growth, unresolved questions
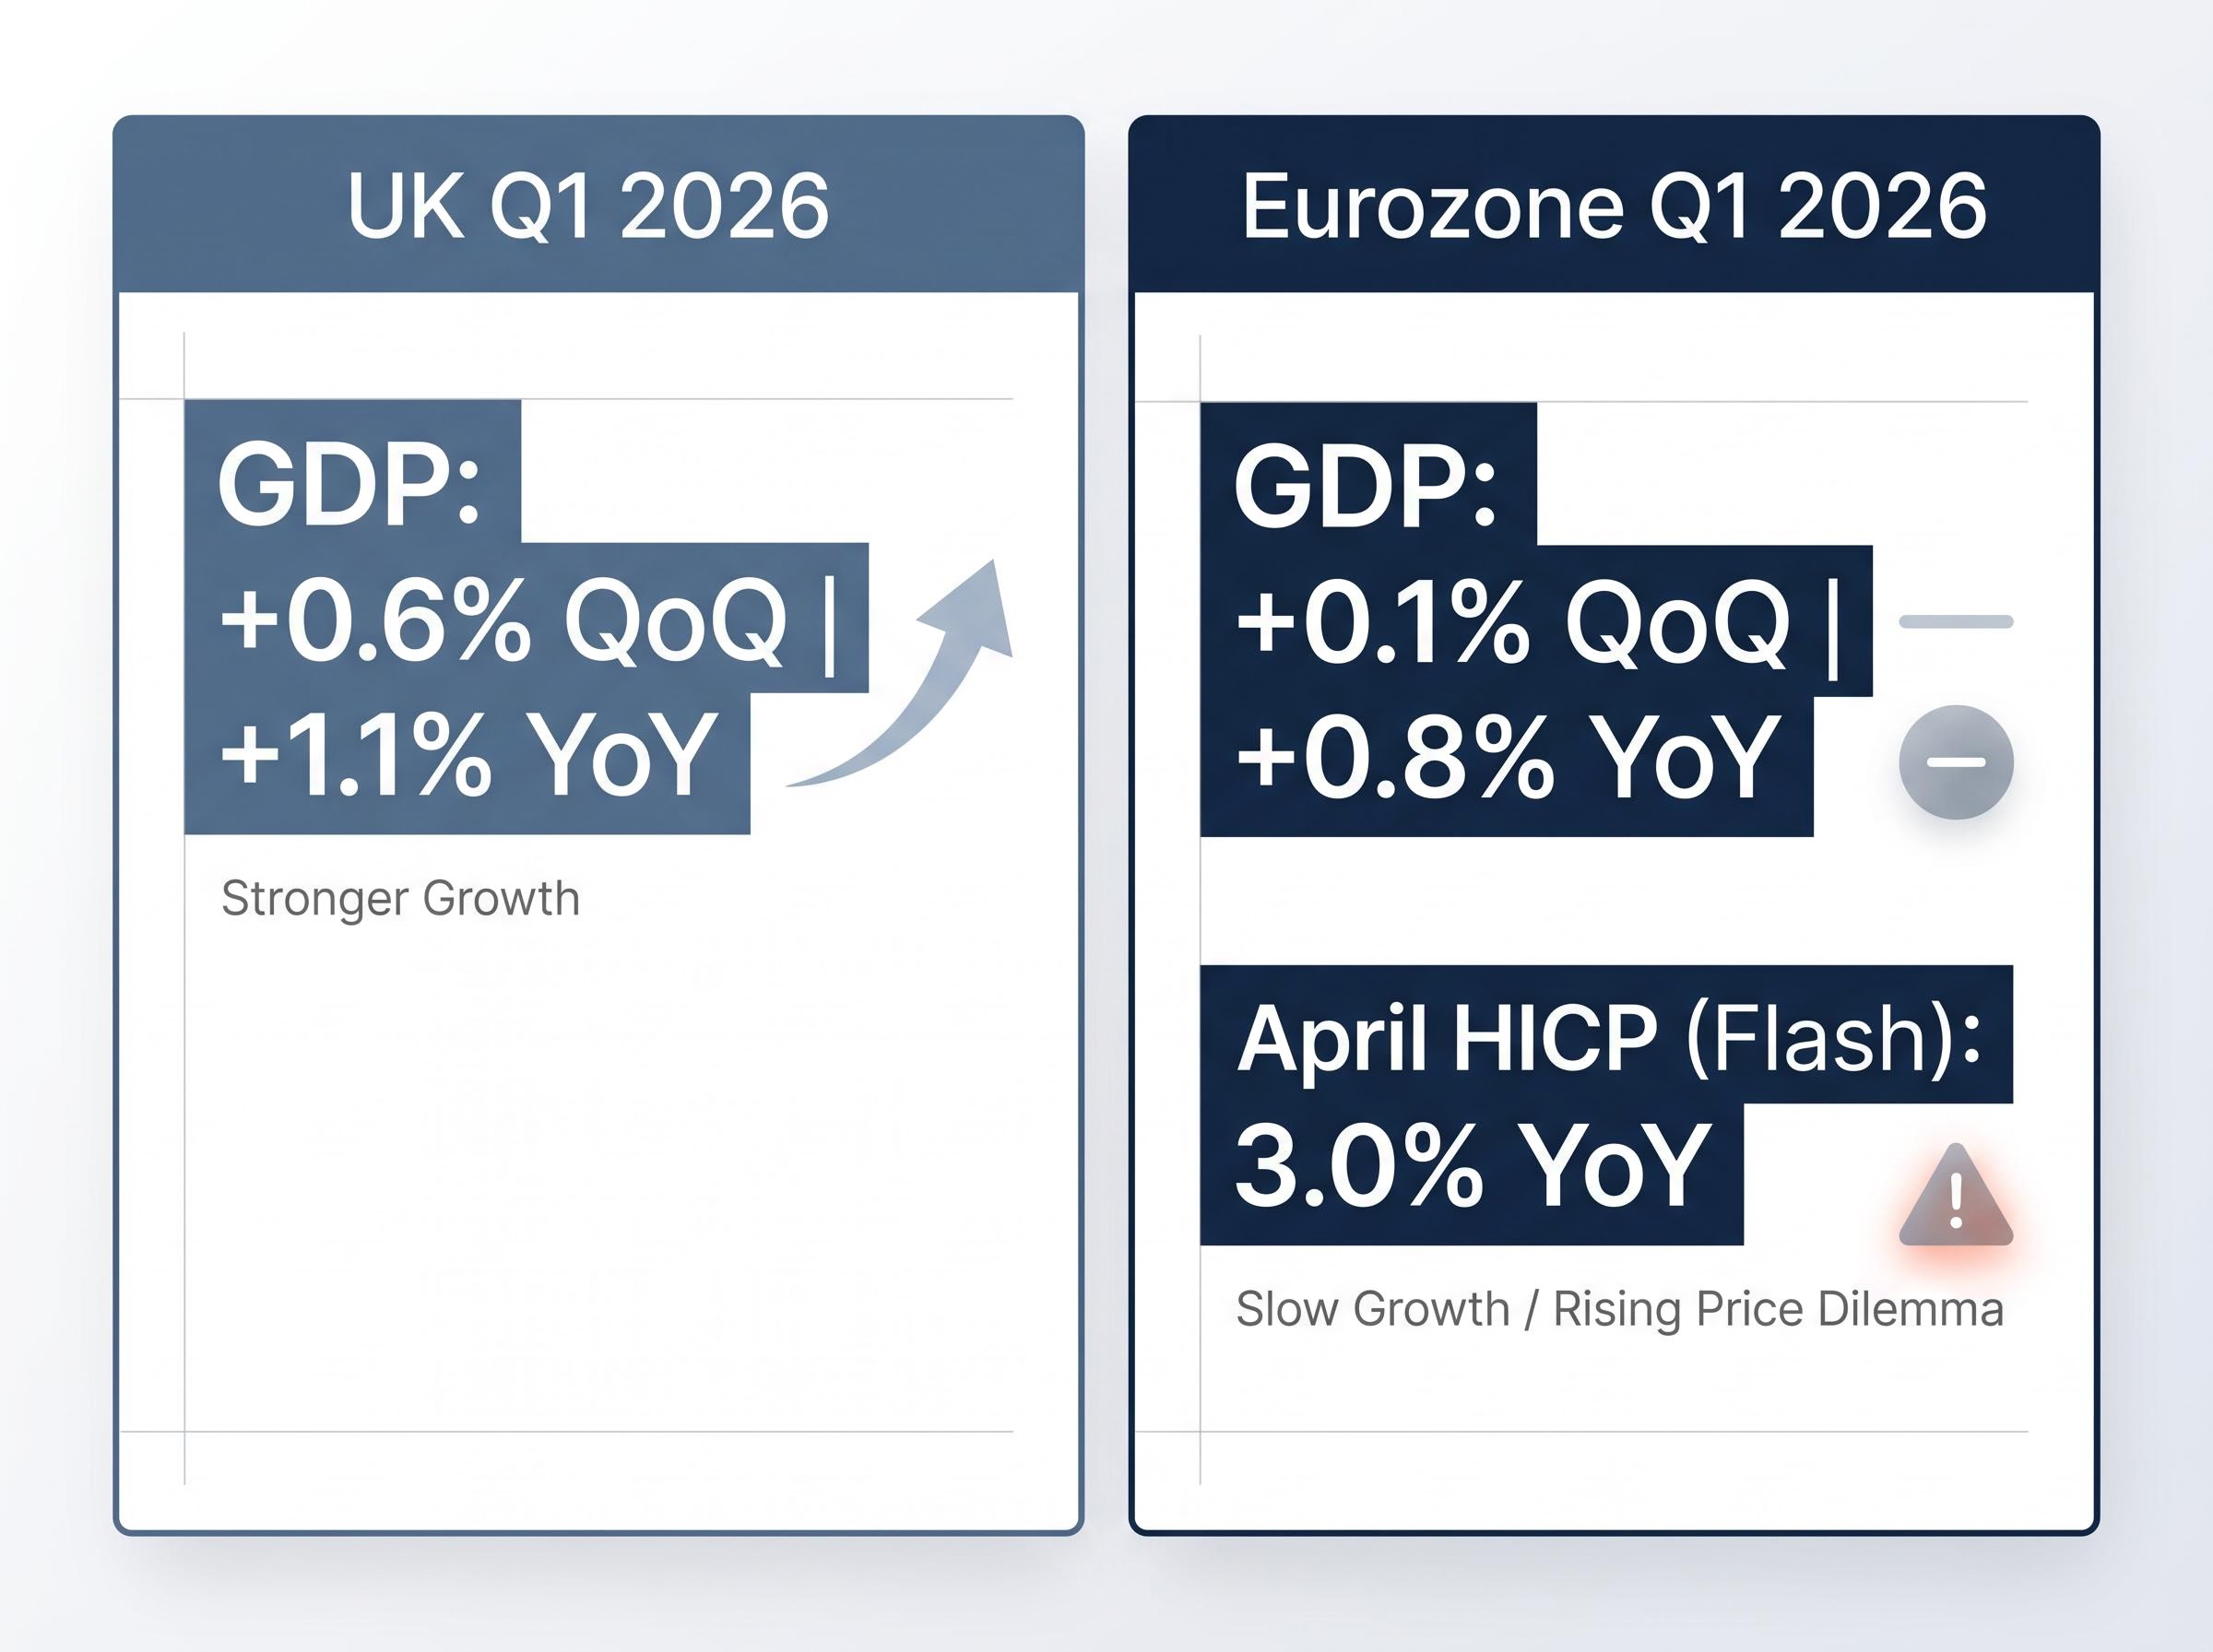
The Office for National Statistics (ONS) released its initial estimate of UK first-quarter 2026 gross domestic product (GDP) on approximately 14 May 2026, and the headline numbers landed well above consensus on both measures.
UK Q1 2026 GDP grew 0.6% quarter-on-quarter and 1.1% year-on-year, beating expectations on both quarterly and annual measures.
Monthly data added granular support, but with one notable soft spot at the sectoral level:
- Q1 2026 GDP: +0.6% QoQ, +1.1% YoY (ONS initial estimate)
- March 2026 monthly GDP: +0.3% MoM, +1.2% YoY
- March 2026 industrial production: –0.2% MoM, 0.0% YoY
- March 2026 manufacturing production: +1.2% MoM, +1.2% YoY
The manufacturing rebound in March partly offset the industrial softness, but the divergence between the two readings signals sectoral unevenness beneath the headline beat. The more important gap, however, is interpretive. No sell-side reassessments of full-year UK growth or Bank of England commentary dated after 14 May 2026 have been published as of 18 May 2026. The raw numbers tell a positive story; the full significance of that story for UK growth projections, sterling positioning, and rate expectations remains to be assessed once the 21 May PMI releases and the pending UK April consumer price index (CPI) print arrive.
UK Q1 growth sustainability is complicated by the composition of the beat: two-thirds of the quarterly expansion was concentrated in a single month, business investment swung sharply from a deeply negative Q4 reading in a pattern consistent with demand deferral rather than a structural shift, and the IMF’s full-year forecast of 0.8% implies subsequent quarters must run well below the annualised Q1 pace.
When big ASX news breaks, our subscribers know first
What “muddling along” looks like: the eurozone’s modest growth and rising prices
Eurozone Q1 2026 GDP, confirmed in the second estimate as unchanged from the flash reading, came in at +0.1% quarter-on-quarter and +0.8% year-on-year. This is not contraction, but it is not recovery either. It is the statistical footprint of an economy generating just enough forward motion to avoid stalling.
The sectoral picture offered a similar pattern. March 2026 industrial production registered +0.2% month-on-month but –2.1% year-on-year, a monthly stabilisation that masks ongoing annual weakness in the bloc’s manufacturing base.
- Q1 2026 GDP: +0.1% QoQ, +0.8% YoY (second estimate, unchanged)
- March 2026 industrial production: +0.2% MoM, –2.1% YoY
- April 2026 HICP flash estimate: 3.0% YoY (up from 2.6% in March)
April inflation re-acceleration adds pressure
Eurostat’s flash estimate for April 2026 harmonised index of consumer prices (HICP), released 30 April 2026, registered 3.0% year-on-year. That represents the fastest pace of eurozone inflation in recent months and a meaningful jump from 2.6% in March.
The combination is uncomfortable. Slow growth and rising prices is the scenario that most complicates European Central Bank (ECB) decision-making, compressing the space for rate cuts to support activity while inflation moves in the wrong direction. For investors holding eurozone fixed income or euro-denominated assets, this is the least favourable macro pairing among the economies examined here.
Understanding what these numbers actually measure (and why it matters)
Investors tend to treat headline economic figures from different economies as directly comparable. A 0.6% GDP print in the UK and a 0.1% print in the eurozone appear to communicate a clear gap. They do communicate a gap, but the precision of the comparison requires methodological awareness.
Three considerations are worth holding in view:
- Eurostat flash HICP timeliness. Eurostat publishes flash inflation estimates on a faster schedule than some national statistical offices. That is why an April 2026 eurozone inflation figure is already confirmed while UK and Japanese national April readings remain pending. Timeliness is not accuracy; it is a structural feature of the release calendar.
- Tokyo CPI as a leading indicator. Japan’s Tokyo area core CPI (April 2026: 1.5% YoY, released approximately 30 April / 1 May 2026) functions as a reliable early read on national figures, typically published around three weeks ahead. The national April 2026 CPI is scheduled for 22 May 2026.
- Chinese monetary data framework differences. Chinese monetary aggregates, including M2 and loan growth, are compiled under frameworks that differ from G7 norms in coverage and consistency, as documented by International Monetary Fund (IMF) Special Data Dissemination Standard (SDDS) filings. An 8.6% M2 beat does not automatically translate into confirmed consumer demand recovery; the statistical architecture itself requires a different interpretive lens.
The IMF Special Data Dissemination Standard establishes the reporting benchmarks and coverage requirements that differentiate monetary aggregates compiled under member-country frameworks, which is precisely why an 8.6% M2 reading from China requires a different interpretive lens than a comparable headline figure from a G7 economy.
The table below summarises the current data landscape and the comparability caveats attached to each reading:
| Economy | Indicator | Status as of 18 May 2026 | Notes on Comparability |
|---|---|---|---|
| UK | Q1 2026 GDP | Confirmed: +0.6% QoQ | ONS initial estimate; no post-release analyst commentary located |
| Eurozone | April 2026 HICP | Confirmed: 3.0% YoY (flash) | Eurostat flash schedule is faster than UK or Japan national releases |
| Japan | Tokyo core CPI (April 2026) | Confirmed: 1.5% YoY | Leading indicator for national figure; national CPI due 22 May 2026 |
| China | M2 money supply (April 2026) | Confirmed: +8.6% YoY | Compiled under frameworks differing from G7 norms (IMF SDDS) |
Reading the global economic picture accurately requires treating each economy’s data on its own statistical terms, not as interchangeable scorecards.
The instinct to treat a headline GDP number as a definitive economic verdict is understandable, but interpreting GDP data releases requires holding several methodological caveats simultaneously: advance estimates carry average absolute revisions of around 0.6 percentage points, equity markets typically price consensus expectations weeks before publication, and the leading indicators visible at release time often tell a more forward-looking story than the lagged GDP figure itself.
Japan and China: credit expansion with caveats
The headline monetary figures from both economies were genuinely positive. Japan’s April 2026 bank lending grew 5.4% year-on-year. China’s M2 money supply expanded 8.6% year-on-year, above consensus expectations according to People’s Bank of China (PBOC) data released approximately 14 May 2026, while loan growth came in at 5.6% year-on-year.
China’s M2 money supply grew 8.6% year-on-year in April 2026, beating consensus expectations, according to PBOC data.
The gap between these financial-system signals and confirmed real-economy momentum is where the analysis becomes more cautious. China’s April 2026 consumer inflation, at +0.3% month-on-month and +1.2% year-on-year, is consistent with a modest demand environment rather than a consumption acceleration. No official April retail sales data have been published as of 18 May 2026.
| Indicator | Japan (April 2026) | China (April 2026) | Interpretation Note |
|---|---|---|---|
| Bank lending / M2 | +5.4% YoY | +8.6% YoY (M2) | Both positive; China beat above consensus |
| CPI | 1.5% YoY (Tokyo core) | +1.2% YoY | Measured inflation in both; demand signal modest |
| Retail sales | Not referenced | Not yet available | Key confirmation of demand recovery still pending |
World Bank China Economic Update reports (2022-2024 vintages) have consistently highlighted structural headwinds including the property sector, demographic pressures, and productivity constraints. These factors remain relevant context for interpreting any apparent credit surge. Policy-driven credit pulses in China have historically not always translated into sustained real-economy acceleration, and the absence of confirmed retail sales data means the optimism warranted by the M2 print is real but incomplete.
The World Bank China Economic Update has consistently identified the property sector correction, population ageing, and slowing total factor productivity as the structural constraints most likely to limit how far credit expansion can translate into sustained output growth, a framework that remains essential context when interpreting any apparent monetary surge.
Reading the divergence: what four economies tell investors right now
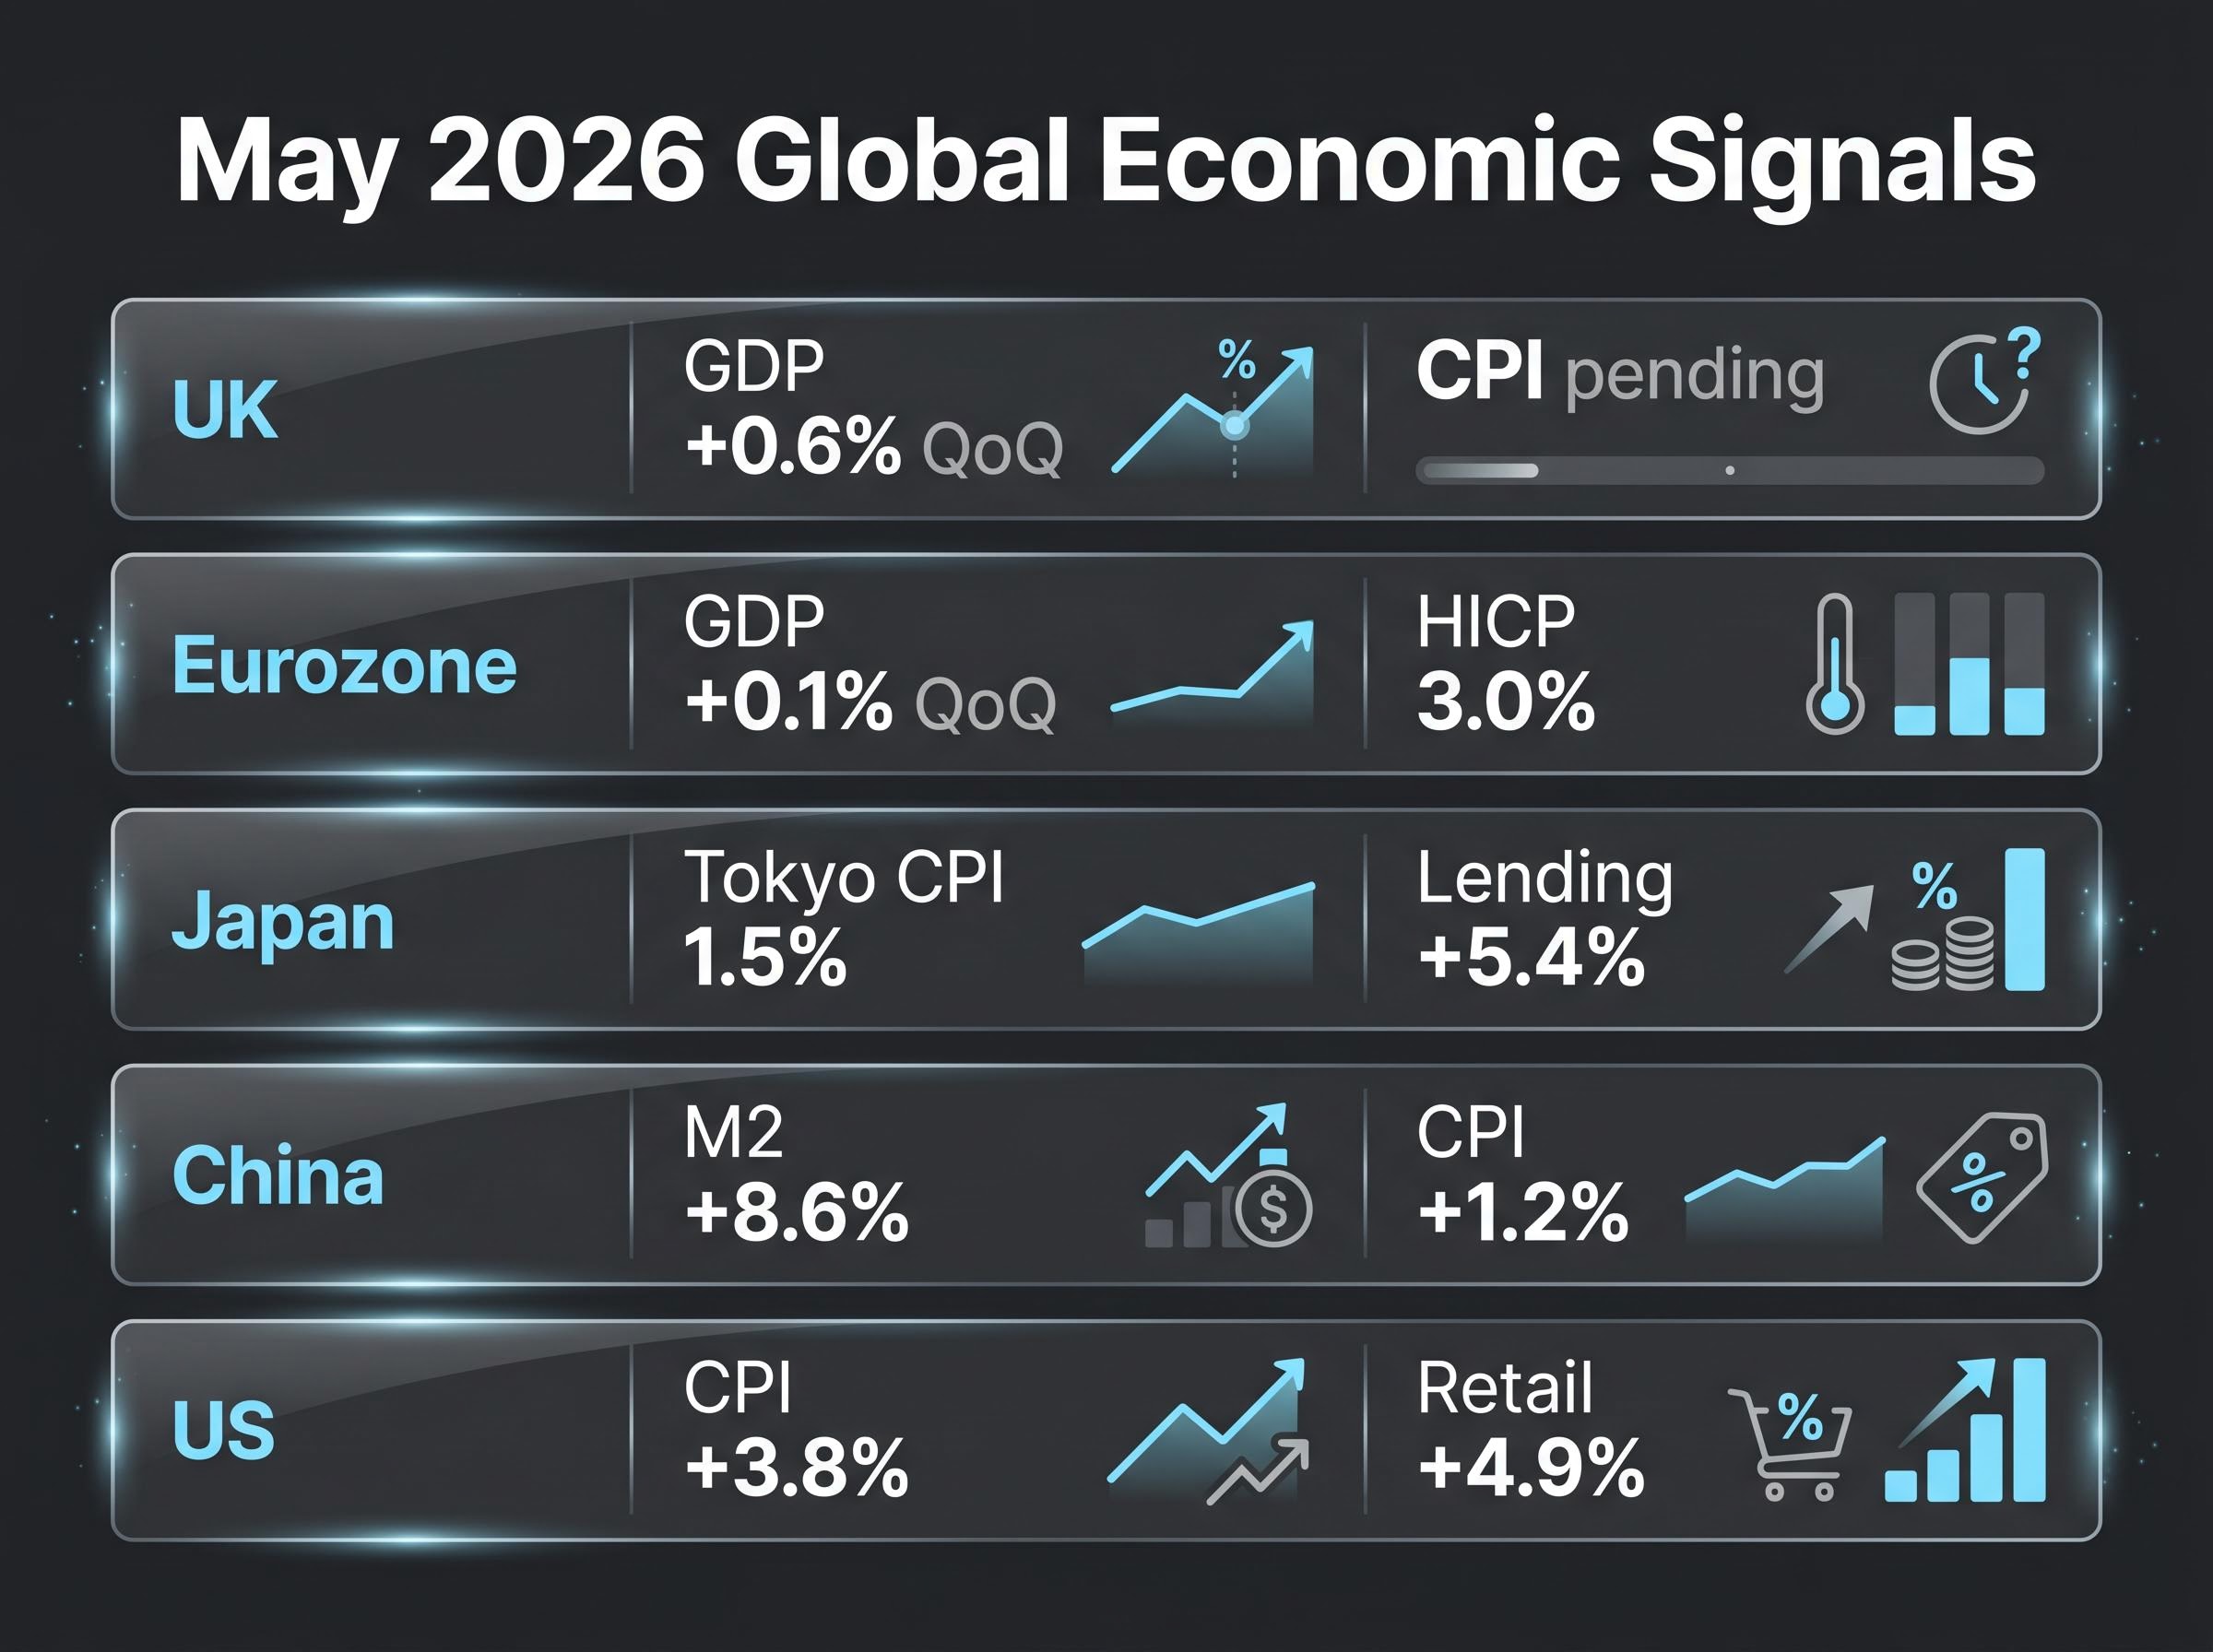
Taken together, the four economy profiles form a pattern. The UK delivered growth outperformance with inflation data still pending. The eurozone confirmed slow growth with inflation re-accelerating. Japan continues measured reflation with a policy backdrop that remains distinct from Western tightening bias. China showed confirmed credit expansion but uncertain real demand.
The US provides a fifth reference point. April 2026 data showed headline CPI at +3.8% year-on-year and core CPI at +2.8% year-on-year (FactSet), while retail sales grew 4.9% year-on-year and industrial production expanded 1.4% year-on-year. Fisher Investments, in analysis published 12 May 2026, characterised the inflation outlook as potentially more favourable than current consensus, a perspective that illustrates the range of views even within a single economy’s data set.
US Q1 GDP composition reveals dynamics that complicate the surface-level 2.0% annualised reading: domestic demand grew faster at 2.5% while a tariff-driven import surge subtracted from the headline, business investment surged at 10.4% annualised on AI infrastructure spending, and consumer expenditure decelerated to 1.6% annualised, suggesting the economy’s growth engines are narrower than the aggregate figure implies.
| Economy | Key Q1/April 2026 Data | Growth Signal | Inflation Signal | Central Bank Posture |
|---|---|---|---|---|
| UK | GDP +0.6% QoQ | Above expectations | CPI pending | Awaiting data |
| Eurozone | GDP +0.1% QoQ; HICP 3.0% | Subdued | Re-accelerating | Policy dilemma |
| Japan | Tokyo CPI 1.5%; lending +5.4% | Measured reflation | Contained | Gradual normalisation |
| China | M2 +8.6%; CPI +1.2% | Credit positive, demand uncertain | Modest | Easing bias |
| US | CPI +3.8%; retail +4.9% | Broadly positive | Persistent | Data-dependent |
The current global picture is one of uneven but broadly positive growth momentum alongside persistent inflation variance. A globally diversified portfolio is exposed to multiple distinct macro environments simultaneously, and reading each economy’s signals on its own terms is more analytically sound than applying a single top-down narrative.
The next major ASX story will hit our subscribers first
Five data releases that will reshape the global picture from 21 May
The confirmed data examined above establishes a baseline. The releases beginning this week will determine whether the divergences visible in Q1 data are continuing or beginning to converge.
- Flash May 2026 PMIs (UK, eurozone, Japan, US; from 21 May 2026). These composite readings will provide the first cross-economy-comparable snapshot of May activity, directly testing whether the UK’s growth lead and the eurozone’s sluggishness are persisting.
- Japan national April 2026 CPI (scheduled 22 May 2026). The Tokyo reading of 1.5% provides a directional guide, but the national figure will confirm whether measured reflation is holding nationwide.
- Japan Q1 2026 GDP initial estimate (due this week). With UK and eurozone Q1 figures already confirmed, Japan’s reading will complete the developed-market growth picture for early 2026.
- UK April 2026 CPI (due this week). The UK growth beat arrived without a matching inflation print. This release will determine whether the Bank of England faces the same growth-inflation tension as the ECB.
- China and UK April 2026 retail sales (due this week). China’s M2 beat needs demand-side confirmation; UK retail data will add colour to the GDP outperformance.
Why flash PMIs matter more than usual this cycle
Flash PMIs provide a composite, cross-economy-comparable read on activity that bridges the gap between lagged hard data such as GDP and industrial production and real-time sentiment. With Q1 GDP figures confirmed for the UK and eurozone but Japan’s still pending, and with April inflation confirming divergent paths, the May PMI readings will indicate whether the divergences are deepening or narrowing. That makes them the single most informative set of releases arriving this week.
The global picture is diverging, not decoupling
The global economic outlook in May 2026 is defined by meaningful divergence across growth and inflation dimensions, not by a uniform directional trend. The UK is outperforming on growth while awaiting its inflation verdict. The eurozone faces the tightest policy bind: slow growth, rising prices. Japan continues its measured path. China’s financial system is expanding, but the real economy has not yet confirmed the signal.
These are not isolated stories. They operate within an interconnected global system where currency moves, capital flows, and central bank sequencing in one economy affect positioning in others. Divergence is the defining feature of this moment, and investors equipped with a multi-economy analytical framework are better positioned than those anchored to any single national narrative.
Geopolitical fragmentation adds a structural layer to the cyclical divergences examined above: regional blocs are now pursuing distinct industrial policies worth hundreds of billions of dollars in semiconductors, EVs, and green technology, creating separately investable macro environments where MSCI Emerging Markets returned 31-42% over the past year while the Euro Stoxx 50 returned only 7-9%, making the cost of geographic concentration measurable rather than theoretical.
The divergences now visible across developed and emerging market economies are real and investable, but they require reading each economy’s data on its own terms rather than applying a single macro thesis across all exposures.
The data releases beginning 21 May 2026 will provide the next significant opportunity to update this picture, with the UK CPI print and May flash PMI composite readings as the most likely drivers of near-term reassessment.
This article is for informational purposes only and should not be considered financial advice. Investors should conduct their own research and consult with financial professionals before making investment decisions. Past performance does not guarantee future results. Financial projections are subject to market conditions and various risk factors.