What Two ASX Broker Calls Reveal About the Rate Cycle Trade
15 mins ago

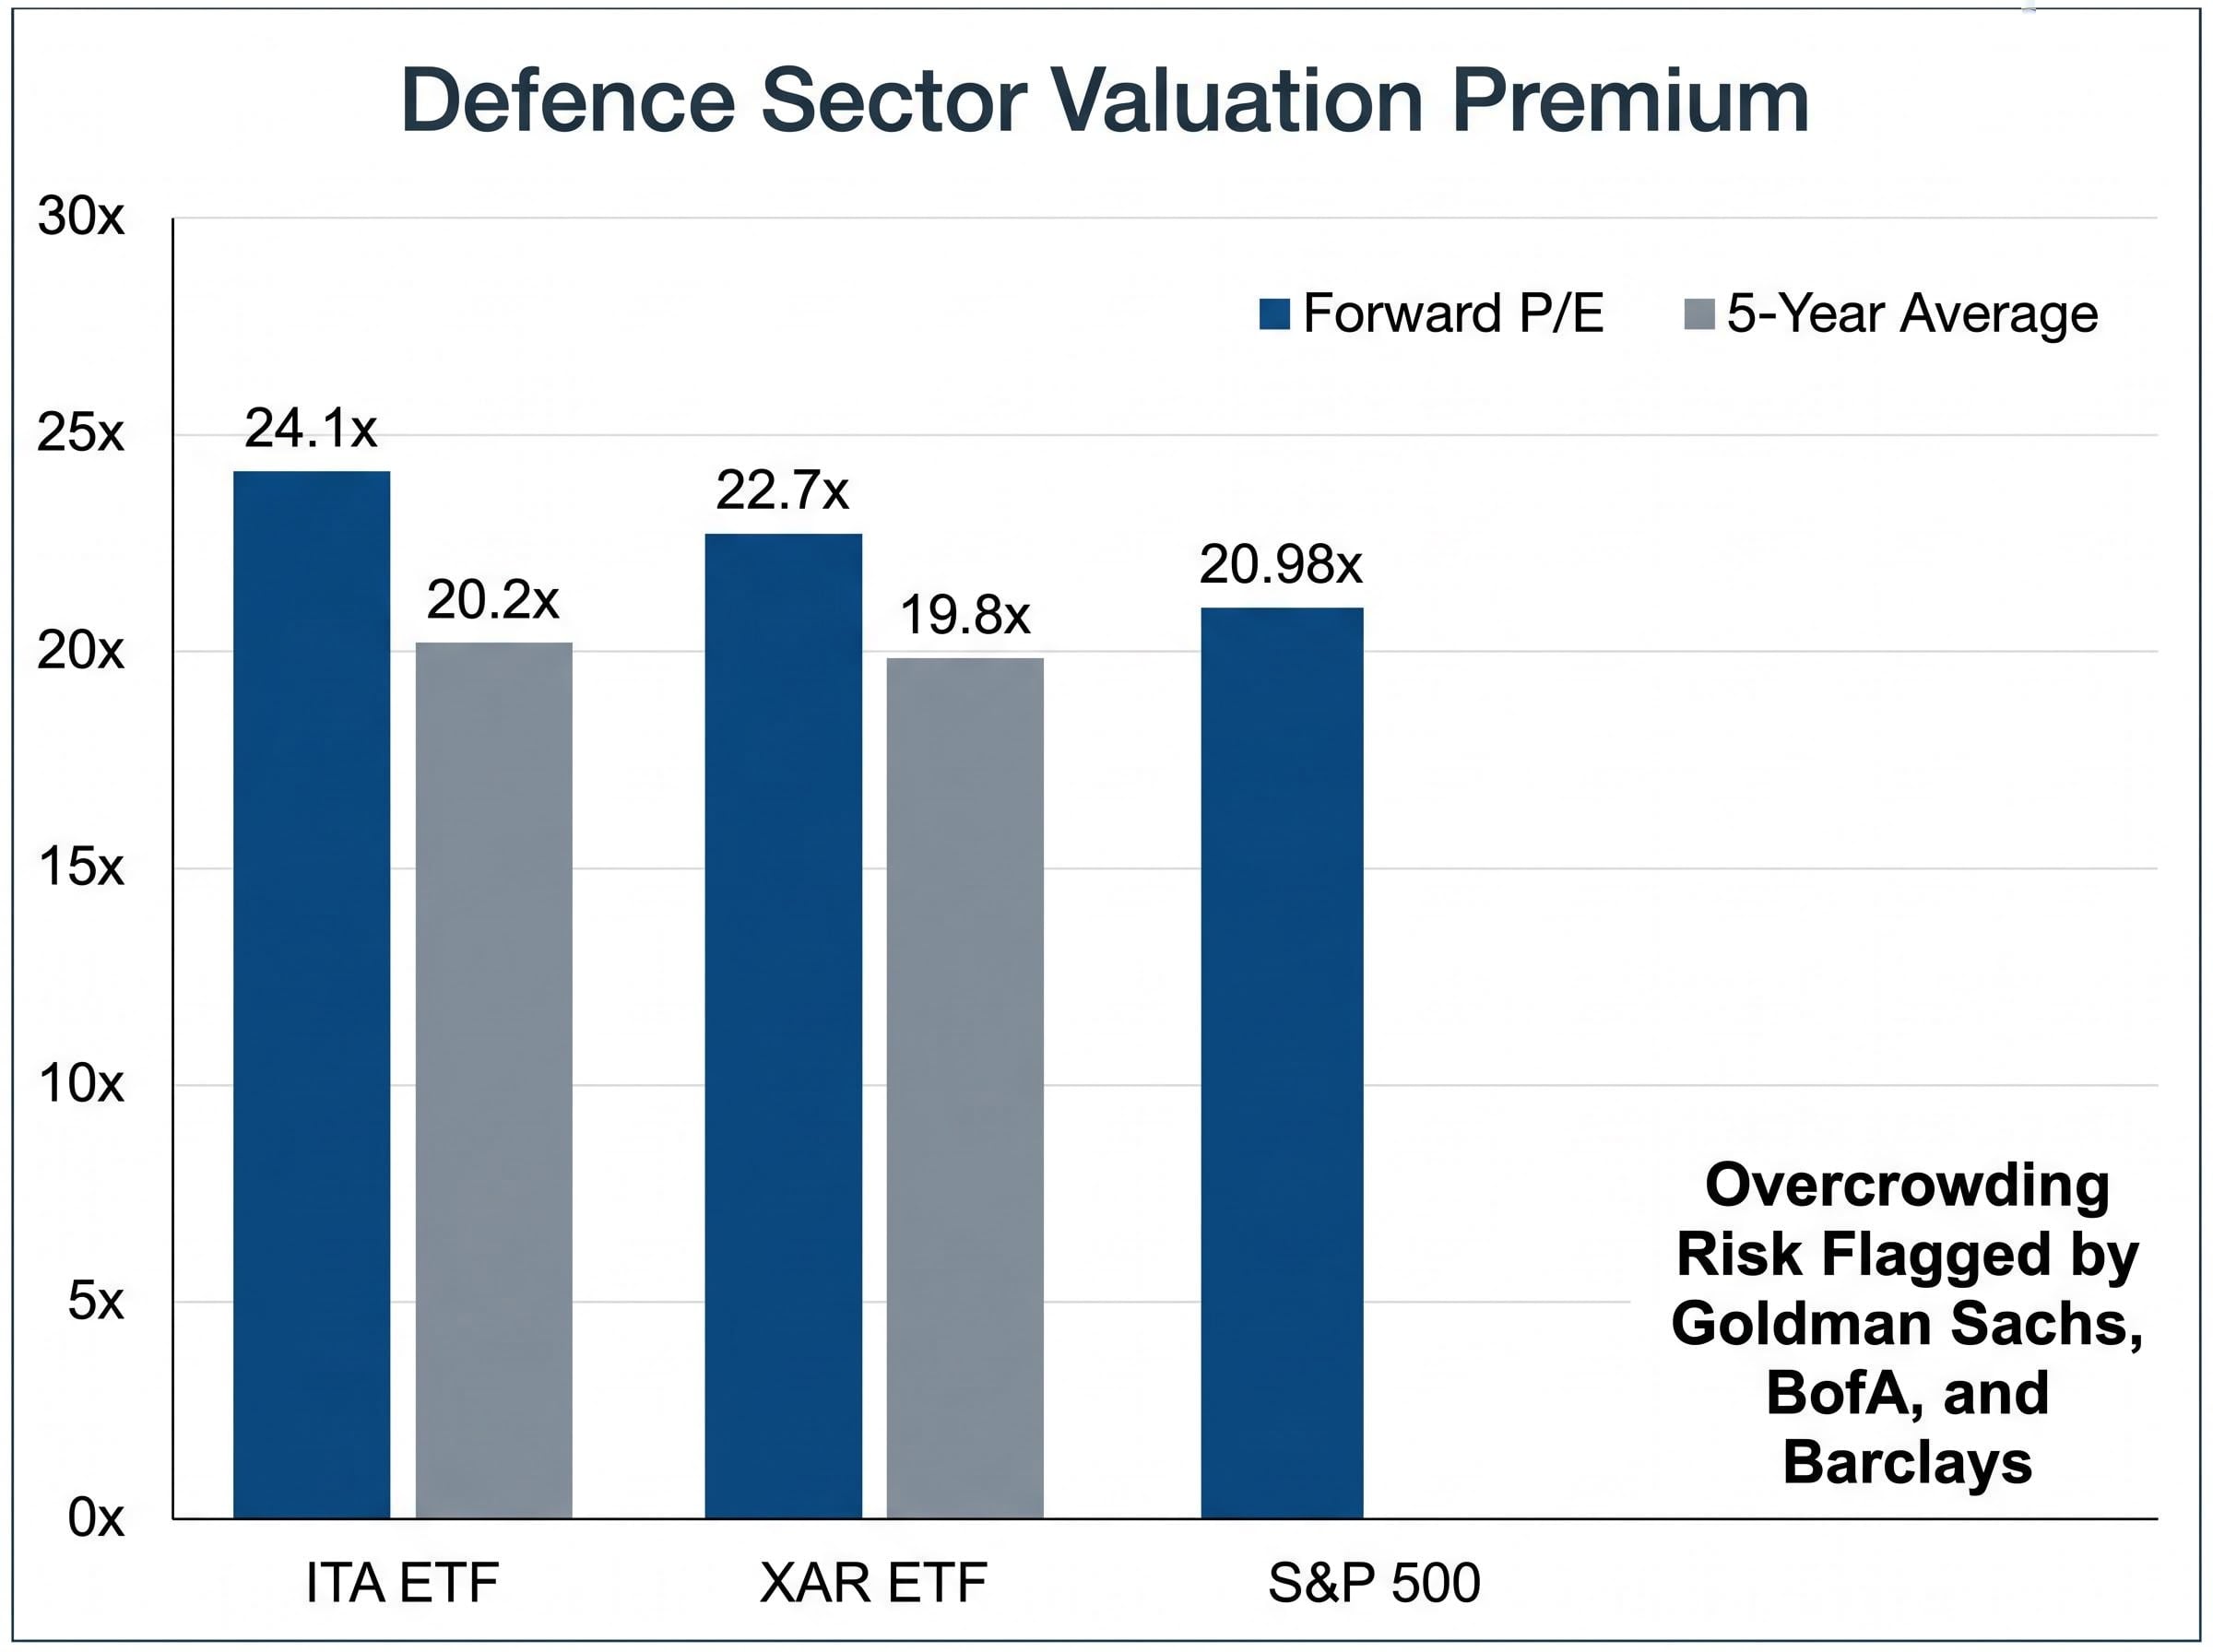
Defence ETFs ITA and XAR are trading at forward price-to-earnings multiples of roughly 24x and 23x respectively, compared to five-year historical averages closer to 20x. The broader S&P 500 sits at approximately 21x. Investors entering the defence sector on the back of US-Iran headlines in May 2026 may be paying a steep premium for a story the market has already absorbed. With institutional analysts at Goldman Sachs, BofA, and Barclays spending April and May flagging overcrowding, valuation stretch, and cautious forward guidance from the sector’s largest names, the intuitive case for defence stocks deserves scrutiny. What follows is an examination of why the sector trade may already be exhausted, how defence revenues actually work relative to real-time conflict dynamics, and what historical patterns from 1991, 2002, and 2003 suggest about what happens next for investors who buy at the peak of a geopolitical narrative.
The surface-level case writes itself. Three reasons are circulating in virtually every investor forum and brokerage note:
Each of these points is real. None of them is new information.
ITA is up approximately 4.2% as of 8 May 2026, having peaked near +15% in February before pulling back sharply on Ukraine peace signals around 10 April. XAR has performed better at roughly +10.1%, boosted by its drone-heavy weighting, with AeroVironment alone up 40% YTD. The S&P Aerospace and Defence Select Industry Index sits at approximately +7.5% YTD as of 12 May 2026.
The problem is not the thesis; it is the positioning. An estimated $1 trillion has flowed into defence-related equities since 2024, according to institutional commentary. When a trade becomes this consensus, the premium tends to arrive before the earnings do.
Goldman Sachs warned in April 2026 that a basket of defence stocks slid approximately 5% on a single session of Ukraine peace signals, a move that exposed the overcrowding risk embedded in the sector’s positioning.
BofA Global Research echoed the concern on 19 April 2026, flagging overvaluation in Lockheed Martin and Raytheon at 25x forward multiples versus 18x pre-2022 levels. When the two largest US investment banks are telling clients the same sector is crowded, the contrarian value of the trade has already evaporated.
The intuitive link between “conflict escalation” and “defence earnings rising” feels direct. In practice, it is not.
Defence company revenues derive from multi-year government contracts with fixed pricing, predetermined delivery schedules, and congressional appropriations timelines. A missile strike in the Strait of Hormuz does not generate a purchase order the following week. It generates a replenishment request that enters a procurement pipeline measured in months to years. Revenue recognition is, as Fisher Investments described it in May 2026 commentary, “lumpy via contracts, not conflict spikes.”
Defence contractor backlog analysis adds a layer of precision that headline revenue figures obscure: the book-to-bill ratio, the funded versus unfunded split, and pipeline visibility metrics are the numbers that separate a contractor genuinely converting geopolitical tailwinds into durable cashflow from one riding sentiment without the contract wins to match.
Fisher Investments noted that defence revenue arrives through contract cycles, not conflict-driven spikes, a distinction that retail investors frequently underestimate.
Two recent examples illustrate the gap between headline and cashflow.
| Contract Event | Announcement-Day Move | One-Week-Later Move | Expected vs Actual Value |
|---|---|---|---|
| RTX Iran missile replenishment (April 2026) | +3% | Approximately -5% | $3B expected; $1.5B awarded |
| AeroVironment Venezuela drone awards (January 2026) | +40% (cumulative) | Approximately -8% by March | $2B announced; delivery delays emerged |
The RTX Pentagon missile replenishment award of $1.5 billion, announced around 15 April 2026, generated a +3% pop on the day. Within a week the stock had reversed to approximately -5% as the contract volume came in well below the $3 billion the market had anticipated. AeroVironment’s $2 billion in drone awards from January 2026 drove a +40% rally, only for delivery delays to trigger an -8% correction by March.
Meanwhile, Lockheed Martin trimmed its forward EPS guidance to $27.50-$28.00 from a prior $28.50 midpoint in its Q1 2026 results, citing elevated labour costs outweighing contract ramps. The contracts are arriving. They are simply not arriving at the speed or scale the market has priced.
The numbers clarify what “priced in” looks like in practice.
| ETF | Trailing P/E | Forward P/E | 5-Year Average P/E | YTD Performance |
|---|---|---|---|---|
| ITA | 28.5x | 24.1x | 20.2x | ~+4.2% |
| XAR | 26.8x | 22.7x | 19.8x | ~+10.1% |
Both ETFs are trading at forward multiples roughly 10-20% above their own five-year averages and approximately 10-15% above the S&P 500 forward P/E of 20.98x. That premium is not simply paying for current earnings. It is paying for a sustained conflict-driven earnings trajectory that requires geopolitical tensions to persist and translate into proportional contract volumes.
BofA Global Research flagged this explicitly on 19 April 2026, noting overvaluation in Lockheed and Raytheon at 25x forward versus 18x pre-2022 levels.
Across the sector’s largest names, Q1 2026 results followed a consistent pattern: marginal beats or in-line results paired with no guidance raises and, in several cases, outright guidance cuts.
For stocks rated at growth premiums, flat or reduced forward guidance at elevated multiples represents a fundamental mismatch. The market is paying for acceleration that management teams are not confirming.
The pattern is not new. Three decades of data tell a remarkably consistent story.
The historical record on equity markets during active conflicts is more counterintuitive than most retail investors expect: the S&P 500 has delivered a positive return one year after conflict onset in 73% of cases since 1959, with recoveries consistently beginning before hostilities formally end, which explains why the sector-specific trade and the broader index can diverge sharply from the same geopolitical catalyst.
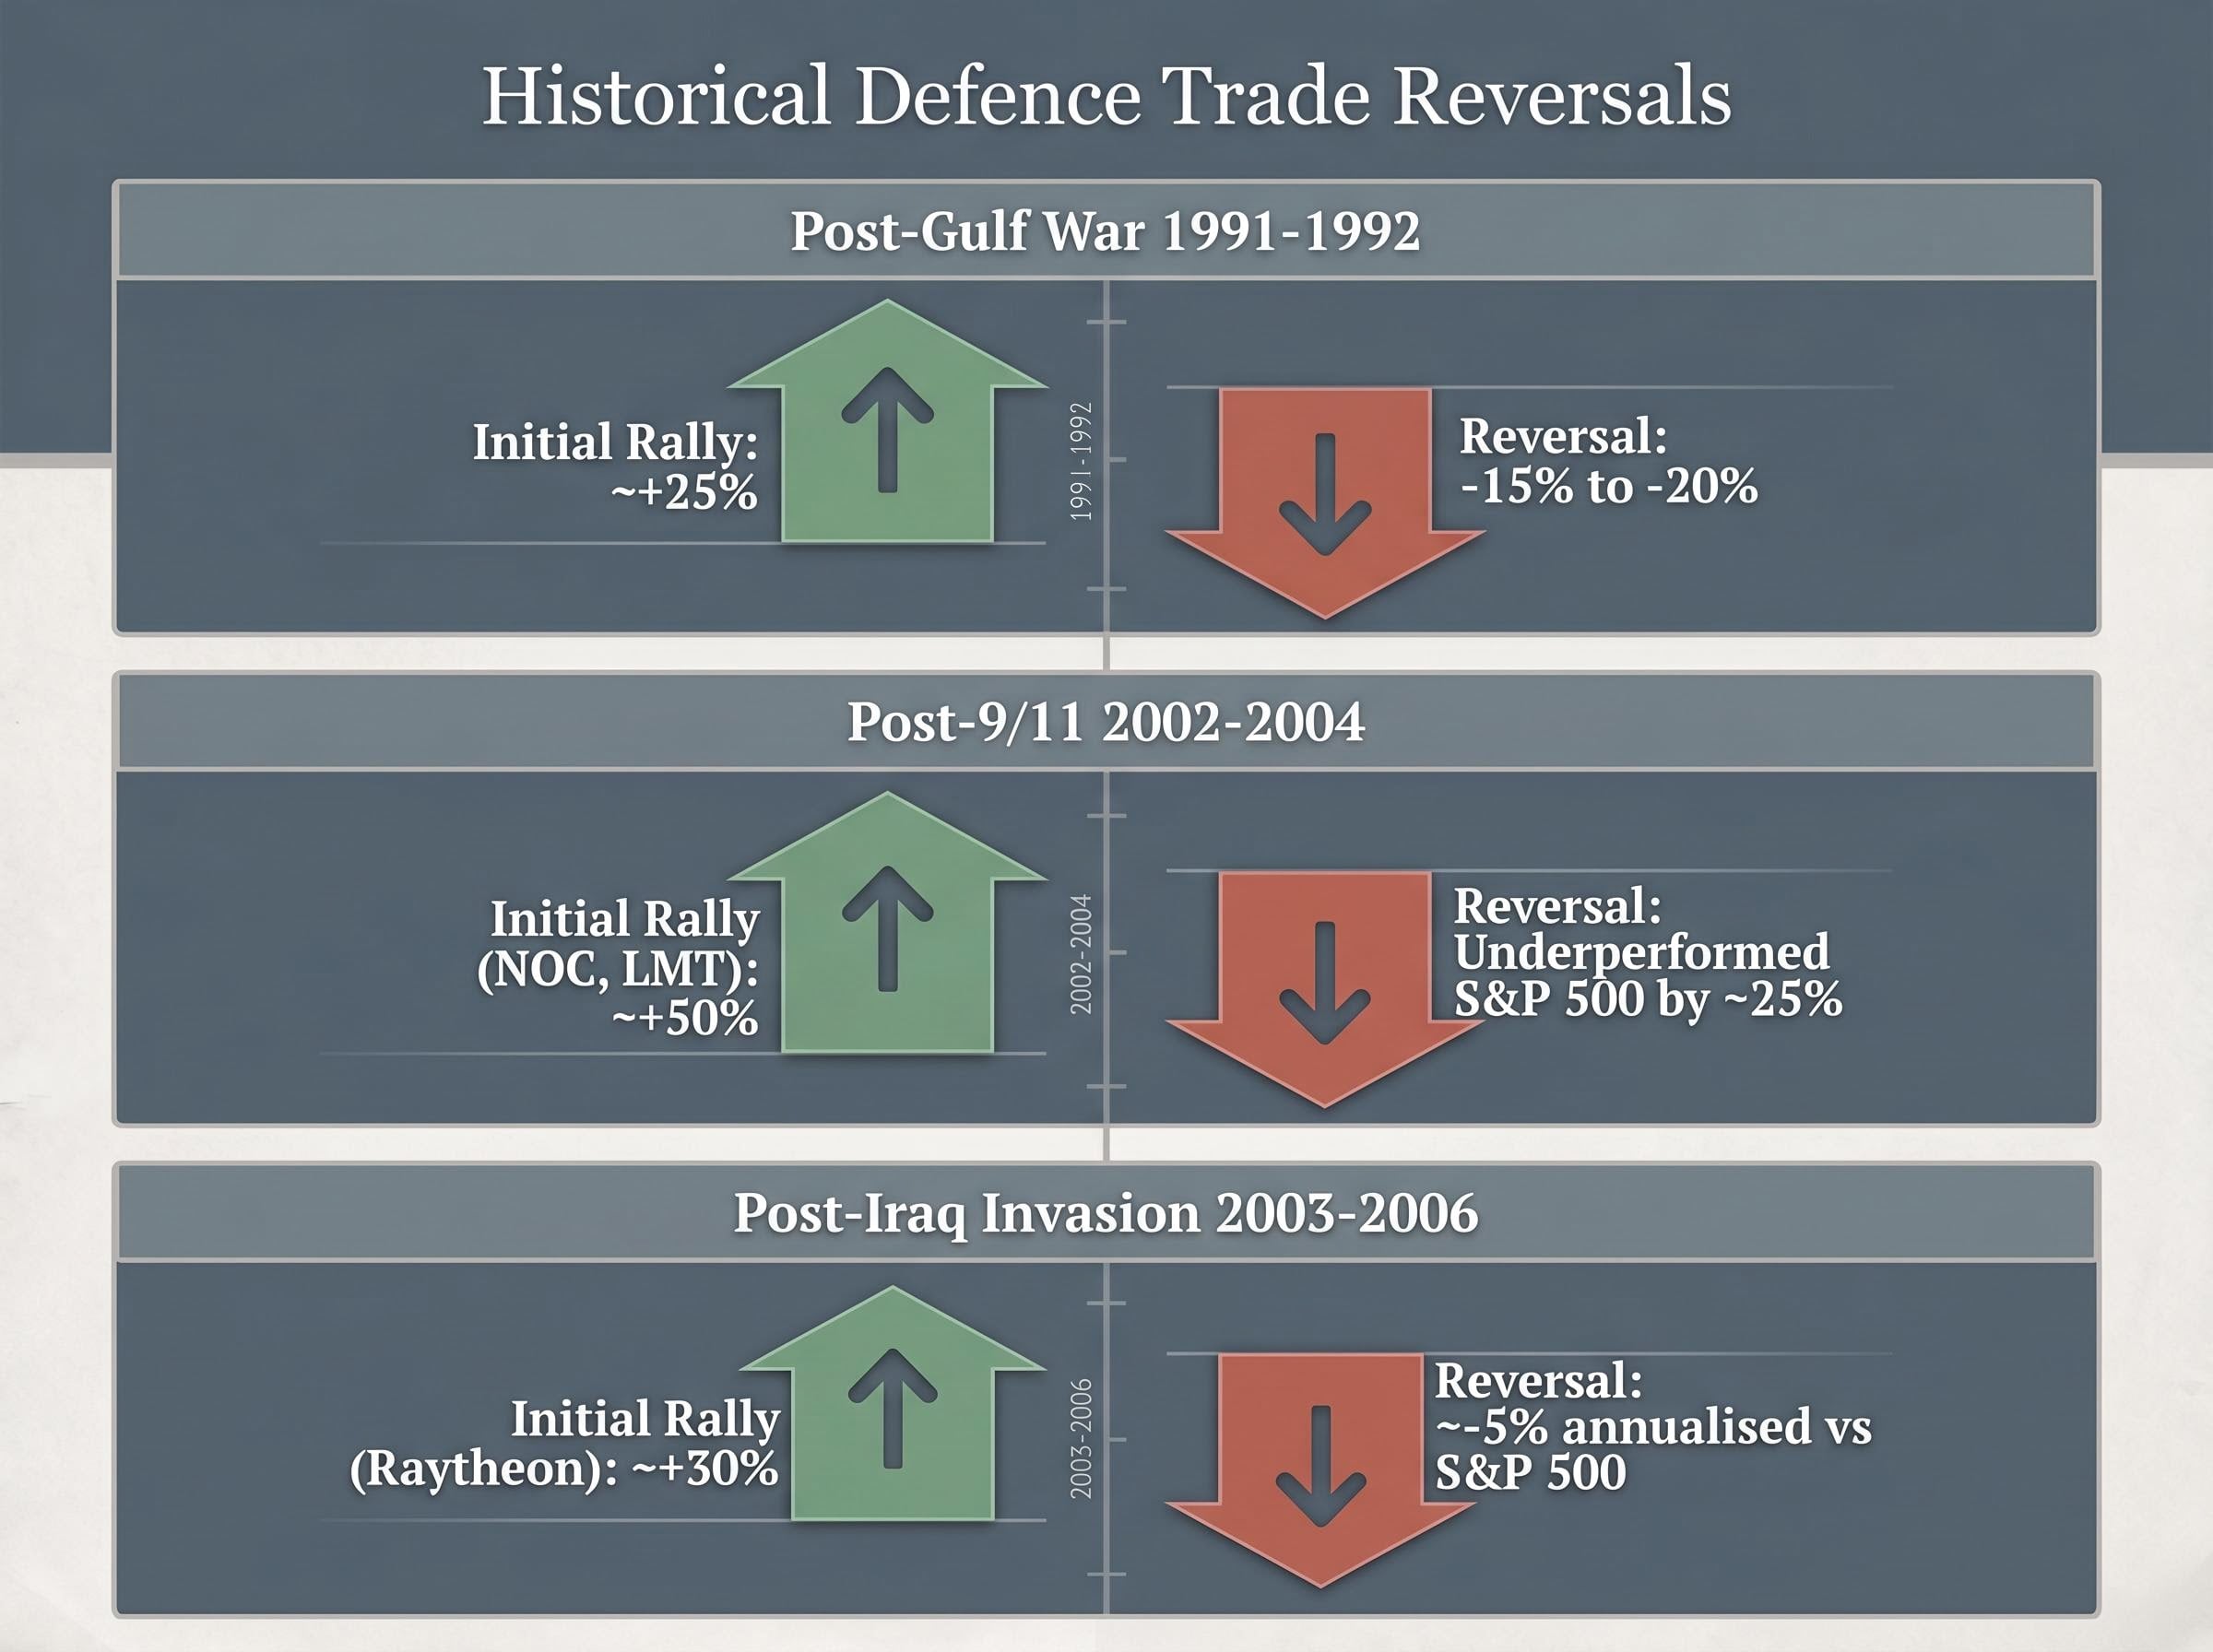
| Conflict / Period | Initial Defence Rally | Subsequent Reversal | Primary Reversal Driver |
|---|---|---|---|
| Post-Gulf War (1991-1992) | ~+25% during Desert Storm | -15% to -20% over 6 months; S&P Aerospace -18% in 1992 | “Peace dividend” budget contraction |
| Post-9/11 Afghanistan (2002-2004) | NOC, LMT ~+50% in 2002 | Underperformed S&P 500 by ~25% in 2003-2004 | Iraq War costs without proportional contract awards |
| Post-Iraq Invasion (2003-2006) | Raytheon ~+30% in 2003 | ~-5% annualised vs S&P 500 at ~+10% | Earnings misses on overoptimistic war-duration assumptions |
In each case, the initial rally of 20-50% during conflict escalation faded by 10-30% once budget realities, peace signals, or execution disappointments materialised.
Conflict creates expectations. Budget cycles determine actual earnings. The gap between the two has driven defence stock underperformance in every major geopolitical cycle of the past three decades.
The mechanism is already visible in 2026. On 10 April, when Ukraine peace signals emerged, the ITA ETF declined approximately -2.5% in a single session on no new contract data, purely on de-escalation sentiment. European defence peers fell approximately -7% on the same day. The sensitivity to narrative deflation is live and measurable.
PIMCO-aligned analysts have warned of a potential 10-15% pullback if Iran-related tensions drag without materialising into new large contracts. The historical record suggests that warning is conservative.
Knowing what to watch matters more than knowing what already happened. Four specific downside triggers carry named analyst backing or measurable precedent:
The White House FY2027 budget topline fact sheet structures the $950 billion defence figure across base discretionary authority and supplemental mandatory resources, a split that means congressional appropriators can approve the headline number while materially altering the contract-ready portions that directly fund procurement.
The FY2027 budget proposal itself offers a case study in how headline numbers disappoint on follow-through. L3Harris and Huntington Ingalls gained approximately +11% intraday on the January 2026 announcement. Both stocks were flat by the end of February as budget details underwhelmed relative to expectations.
JPMorgan cut its RTX price target from $135 to $125 on 2 May 2026, flagging “margin compression from missile overproduction bets not materialising.” Goldman Sachs strategists warned that 14% YTD gains in European defence indices may signal that US peers have peaked rather than that they have room to run.
The upside triggers are real, even if partially reflected in current prices:
These factors explain why the sector is not a clear short. They do not, however, make it a compelling long at current multiples, given that institutional investors have already identified and positioned around each of them.
Three analytical threads converge on the same conclusion. Defence revenues lag conflict headlines by months to years, governed by contract mechanics and budget cycles rather than operational tempo. Current multiples price in sustained conflict-driven earnings growth that management teams are not confirming in their forward guidance. And historical analogues across three decades suggest 10-30% drawdown risk when the narrative that justified the premium begins to deflate.
The distinction that matters is between investors who already hold defence exposure and those considering initiating a position on the back of May 2026 Iran headlines. For existing holders, the calculus involves weighing the premium against their cost basis. For new buyers, the risk-reward at current valuations tilts against them.
Fisher Investments research noted in May 2026 that equity markets have historically looked past active regional conflicts and rebounded faster than most investors expected. That observation carries a second implication: the broader market may offer better risk-adjusted opportunities than a sector trading at a 15-20% premium to its own history. The second half of a presidential second year has also historically been favourable for US equities broadly, according to the same research.
Defence as a sector is not broken. The entry point, however, is the entire argument, and May 2026 is not the moment the numbers favour a new position.
For investors who recognise the entry-point risk laid out here but are uncertain what to do with existing positions or how to think about portfolio rebalancing during active geopolitical cycles, our comprehensive walkthrough of geopolitical risk investing strategy examines the behavioural research on reactive trading costs, the dollar-cost averaging case, and the specific filters institutional analysts apply before repositioning around individual conflict headlines.
This article is for informational purposes only and should not be considered financial advice. Investors should conduct their own research and consult with financial professionals before making investment decisions. Past performance does not guarantee future results. Financial projections are subject to market conditions and various risk factors.
When defense stocks are described as priced in, it means the market has already factored anticipated earnings growth from geopolitical events into current valuations, so investors buying at that point are paying a premium without the benefit of the original catalyst still driving prices higher.
Defense company revenues come from multi-year government contracts with fixed pricing and congressional appropriations timelines, not real-time conflict activity; a missile strike does not generate a purchase order the following week but instead triggers a replenishment request that moves through a procurement pipeline measured in months to years.
Historical data from 1991, 2002, and 2003 shows that defense stocks typically rallied 20-50% during conflict escalation before reversing by 10-30% once budget realities, peace signals, or execution disappointments materialised, as seen after the Gulf War, post-9/11 Afghanistan, and the Iraq invasion.
On 10 April 2026, the ITA ETF dropped approximately 2.5% in a single session on Ukraine peace signals alone, with no new contract data involved, illustrating how heavily the sector's valuations depend on sustained geopolitical tension rather than on fundamental earnings changes.
Four key downside triggers identified by named analysts include an Iran ceasefire or de-escalation, a Ukraine peace resolution, congressional budget compression reducing contract-ready appropriations from the FY2027 proposal, and continued contract execution gaps where awards arrive below market expectations or with delivery delays.