
There is a number in a headline CAR-T result that most readers never see: the number of patients who needed the therapy but never got it.
When a clinical trial reports a response rate, the instinct is to read it as a statement about everyone the drug was meant to help. For most treatments, that instinct is fine. The gap between the patients a therapy was intended for and the patients who actually received it is usually tiny, often just a few days between the decision to treat and the first dose.
For CAR-T cell therapy, that gap is not tiny. It is structural, measurable, and easy to miss if you only read the top-line efficacy figure.
This piece sits before infusion, in the window that the rest of this series does not cover. Other pieces examine what happens once cells are in the patient. Here, the focus is what happens before that, and how much of the intended patient population never makes it that far.
What follows here is a framework for reading cell therapy data accurately, so you can spot failures of delivery that headline response rates tend to hide.
Intention-to-treat versus as-treated: the two ways to count
Start with how trials actually count.
Almost every CAR-T readout you will see uses an as-treated analysis. This measures outcomes only in patients who received the therapy. It is standard, reasonable, and how the overwhelming majority of trial results are reported. If a patient underwent cell collection but never got infused, they simply are not in the number.
An intention-to-treat (ITT) analysis works differently. It measures outcomes across everyone assigned to receive the therapy, including patients who dropped out before infusion. It captures failures of delivery alongside failures of the biology.
This distinction matters because of where CAR-T patients disappear. They are not recorded as non-responders. They are absent from the as-treated denominator altogether.
In clinical trial methodology, ITT is widely regarded as the more conservative and complete reflection of real-world benefit, precisely because it refuses to ignore the patients who never received treatment. That is the whole point of it.
The ICH E9(R1) statistical guideline treats ITT as the preferred framework for defining treatment effects in clinical trials, specifically because intercurrent events such as dropping out before receiving a therapy must be accounted for rather than silently excluded from the analysis.
Here is the practical consequence for you. A high response rate among infused patients can coexist with the therapy reaching only a minority of the intended population. Read only the as-treated figure and you will systematically overestimate the real-world benefit.
So when you read any cell therapy result, ask one question: how many patients were enrolled or underwent collection, and how many were actually infused? The gap between those two numbers is the delivery problem made visible.
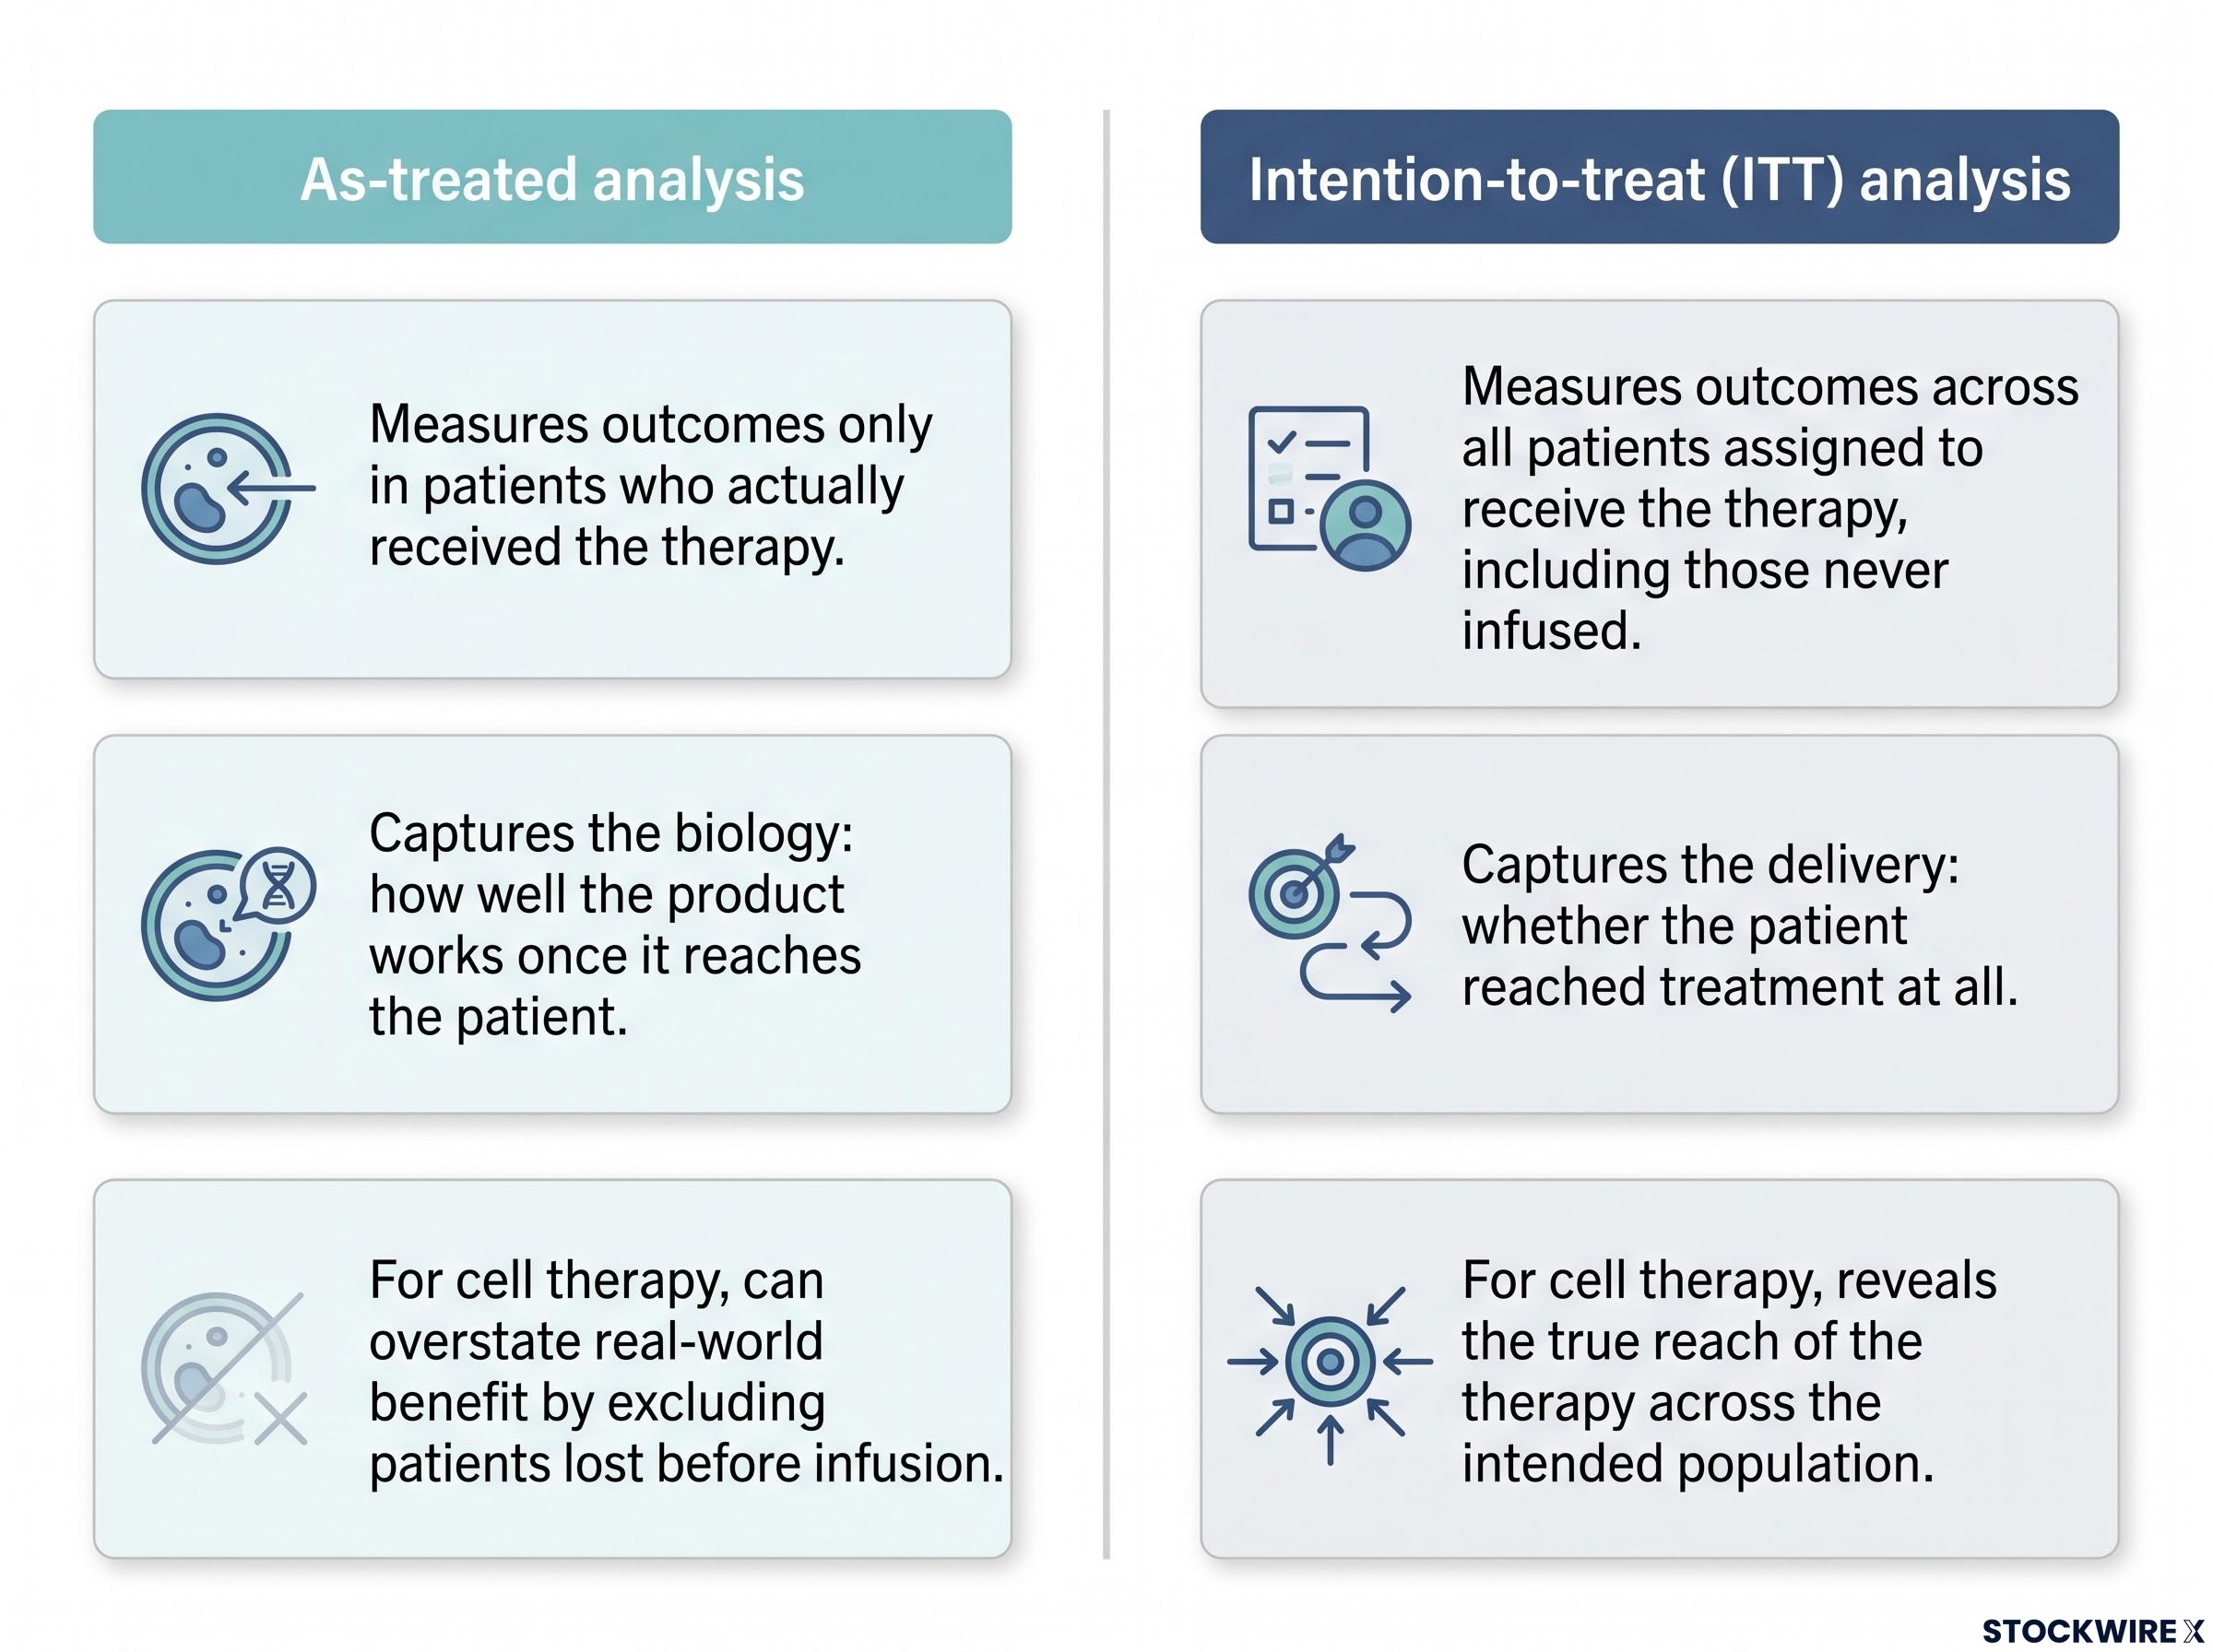
| As-treated analysis | Intention-to-treat (ITT) analysis |
|---|---|
| Measures outcomes only in patients who actually received the therapy. | Measures outcomes across all patients assigned to receive the therapy, including those never infused. |
| Captures the biology: how well the product works once it reaches the patient. | Captures the delivery: whether the patient reached treatment at all. |
| For cell therapy, can overstate real-world benefit by excluding patients lost before infusion. | For cell therapy, reveals the true reach of the therapy across the intended population. |
This is a transferable skill. Apply it to any cell therapy company, and you stop mistaking biological efficacy for reliable access.
When big ASX news breaks, our subscribers know first
The physical cost of the autologous manufacturing wait
The numbers become concrete once you see what causes them.
Autologous CAR-T is built from each patient’s own cells. The process begins with cell collection, after which the material is transported to a central manufacturing facility where it is engineered, expanded, and put through release testing before being returned to the treating centre. Every step is sequential, and every step adds time.
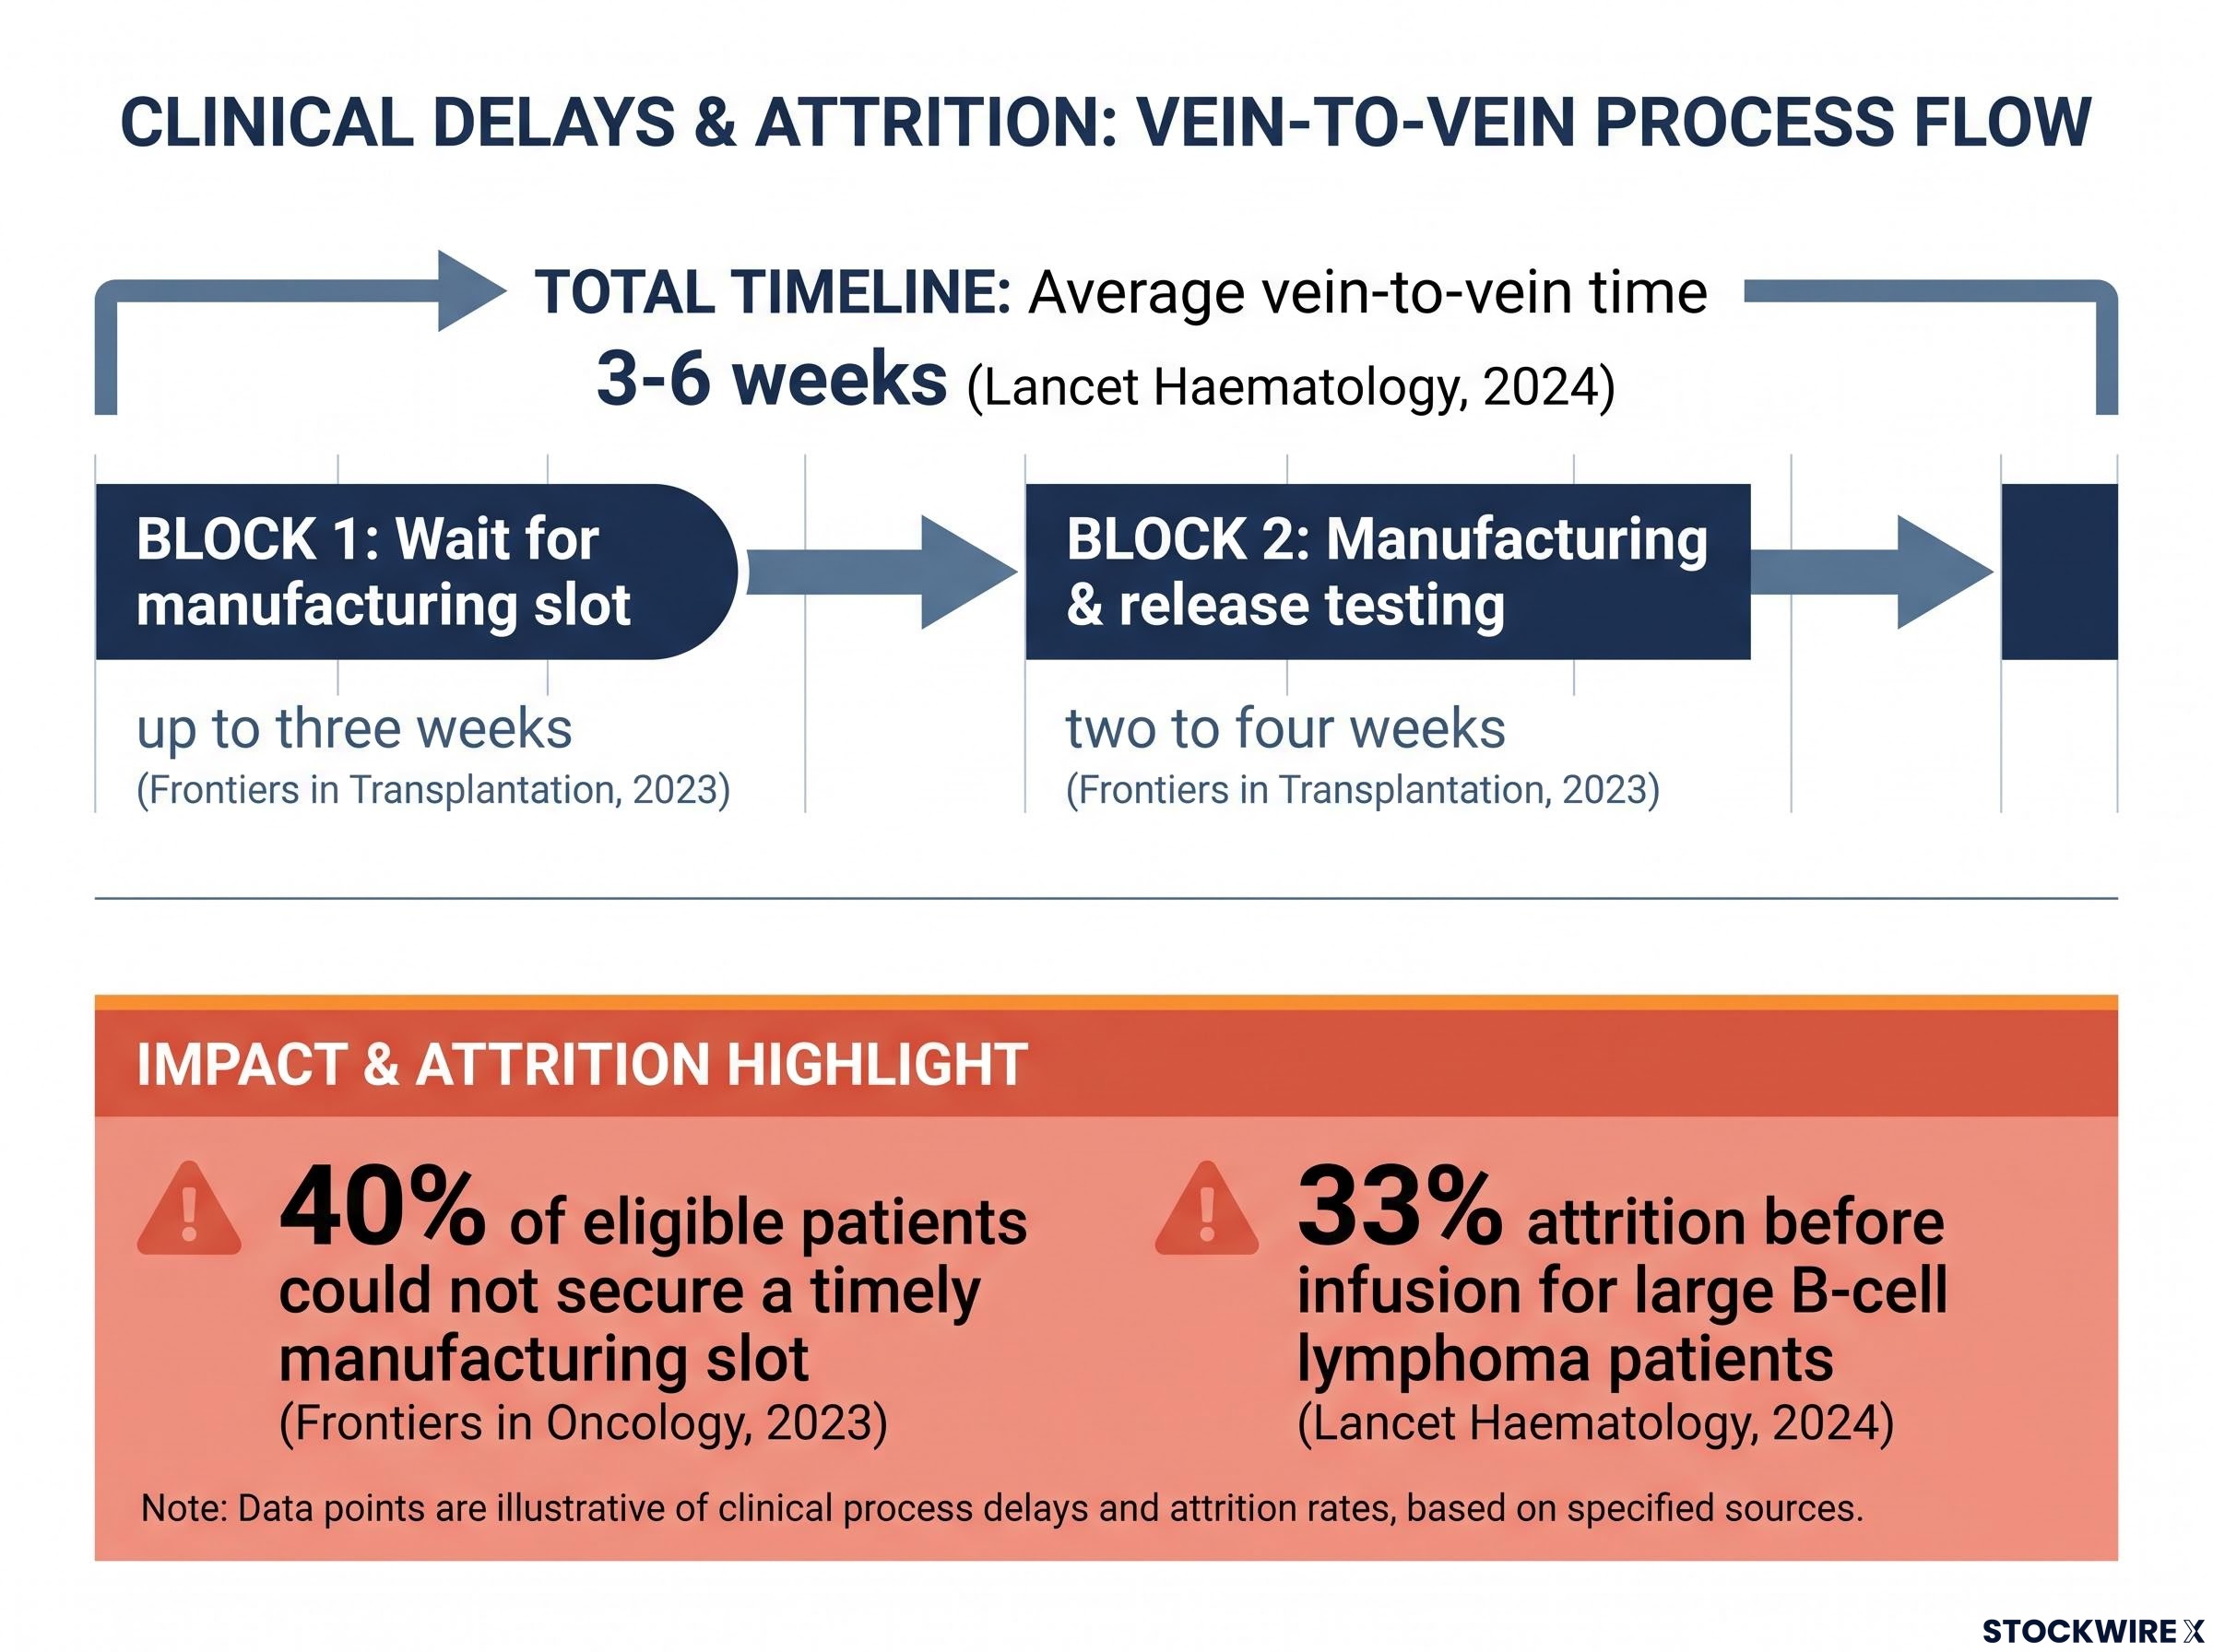
Published reviews put average vein-to-vein time at 3-6 weeks under current protocols (Lancet Haematology review, 2024). Some of that is manufacturing itself. Much of it is not.
CAR-T manufacturing timelines vary considerably across programmes: AdAlta’s BZDS1901 uses a 2-day manufacturing process compared to the 9-day standard for conventional autologous products, illustrating that the vein-to-vein timeline is not fixed but is a function of platform design choices.
Before the process even starts, there can be a wait of up to three weeks for a manufacturing slot, with manufacturing and release testing taking a further two to four weeks thereafter (Frontiers in Transplantation, 2023). Slot availability is its own bottleneck. A single-centre study during a 2021 rollout found that 40% of eligible patients could not secure a timely manufacturing slot (Frontiers in Oncology, 2023, reflecting one centre’s experience and not generalisable).
Now consider who is waiting. These are patients with aggressive blood cancers that have already resisted multiple lines of treatment. A multi-week timeline is not neutral for them. Their disease continues to progress during the wait, which means the wait itself is a clinical risk, not just an inconvenience.
33% attrition before infusion Roughly 33% of large B-cell lymphoma patients who underwent cell collection did not reach CAR-T infusion, with disease progression identified as a major reason (Schuster and colleagues, cited in Lancet Haematology, 2024).
That figure is the delivery gap in a single statistic. It is not a data anomaly. It is the direct output of a supply chain that takes weeks to deliver a product to patients whose disease moves in days.
Modelling published in Blood Advances (2024) reinforces the point: shortening vein-to-vein time produced meaningful improvements in projected life expectancy for later-line large B-cell lymphoma patients. Time is not a logistics footnote here. It is part of the clinical outcome.
The geographic burden of Australian access
Distance compounds the wait. In Australia, CAR-T is delivered through a limited network of specialised sites, 12 qualified treatment centres as of May 2026 data, two of which are paediatric-only.
For patients outside major cities, this adds a further layer of burden. They must relocate, often with a carer, for several weeks to cover collection, the manufacturing period, and infusion. Only one of those 12 centres sits outside a capital city, and no centre is listed for the Northern Territory, Tasmania, or the Australian Capital Territory.
Geography does not appear in an as-treated response rate. But for a regional patient weighing weeks away from home against an already aggressive disease, it is one more reason the intended population and the treated population diverge.
Why the biological target is no longer the bottleneck
Here is the part that reframes the whole problem.
CD19 is a protein found on the surface of most B-cell cancers, and it is among the most extensively validated targets in blood cancer treatment. The science of hitting it is not in question. It has been proven repeatedly across multiple approved therapies and multiple jurisdictions.
Four CD19-directed autologous CAR-T products hold regulatory approval: Kymriah, Yescarta, Tecartus, and Breyanzi. According to Imugene (with the approval count independently verified as four, though Imugene has cited five), CD19-directed therapies carry combined annual sales of around US$3.2 billion, a figure whose reference year Imugene has not confirmed.
The commercial scale tells you the target works. What has not changed is how the product is delivered.
Every one of those approved therapies shares the same three traits:
- All are CD19-directed, hitting a target that is clinically settled.
- All are autologous, meaning a separate product must be built for each individual patient.
- All are subject to the collection, manufacturing, and slot-wait delays described above.
That is the pivot of this whole discussion. The primary challenge for this cancer target is no longer inventing a drug that works. It is building a supply chain capable of delivering that drug to the patient before they deteriorate.
For you as a reader, this shifts where the real innovation sits. For CD19, the breakthrough required is logistical and scalable, not another round of biological discovery.
T-cell exhaustion is the biological counterpart to the delivery problem: even patients who reach infusion on time may face a therapy whose cells lose functional activity before the disease is cleared, making durability a second open question alongside access.
How removing the manufacturing wait reshapes who gets treated
If the bottleneck is delivery, the obvious question is what happens when you remove it.
Off-the-shelf, or allogeneic, CAR-T is made in advance from donor cells and held in inventory. The product exists before any individual patient is identified. That structure removes three things at once: collection from the patient, shipment to a production facility, and the wait for a manufacturing slot. (The June piece in this series covers how the allogeneic model works in full.)
Two requirements remain in place regardless of how the cells were made: eligibility assessment and the preparative lymphodepleting chemotherapy that patients receive before infusion. These requirements exist regardless of how the cells are made, which is why “immediate treatment” is the wrong way to think about it.
What changes is the arithmetic. Removing the largest single delay theoretically narrows the gap between patients assessed and patients infused. Several companies are pursuing this, including Allogene Therapeutics and Caribou Biosciences.
The honest framing is this: whether that theoretically narrowed gap translates into the real world is still an empirical question. It is worth watching as trials mature.
The useful way for you to view off-the-shelf therapy is not as a different kind of medicine. It is a mechanism aimed at structurally closing the gap between the patients who need CAR-T and the patients who actually receive it. That is the lens to judge future trial results against: not just response rate, but improvement in intent-to-treat reach.
The azer-cel programme and its specific clinical realities
Imugene is developing azer-cel, an investigational allogeneic CD19-directed CAR-T therapy for B-cell blood cancers. It sits squarely in the delivery-reform category described above.
It also comes with limitations that need stating plainly. Azer-cel is investigational and in early-phase clinical development. Early response data do not establish long-term outcomes. And allogeneic programmes carry unresolved questions that autologous therapies have already worked through.
The specific safety question for allogeneic therapy is graft-versus-host disease, a condition where donor immune cells attack the recipient’s own tissue. Even with gene-editing designed to reduce it, whether that risk can be fully mitigated remains an active research question rather than a settled one. It is the biological hurdle that off-the-shelf models introduce in exchange for removing the logistical one.
Graft-versus-host disease trial outcomes illustrate how difficult the safety question remains: Cynata’s Phase 2 CYP-001 programme, targeting the same immune-mediated tissue attack that allogeneic CAR-T must manage, produced a Day 28 response rate statistically indistinguishable from placebo despite an 87% overall response rate in Phase 1.
On the clinical data: Imugene has reported complete and partial responses across its programme, but the reported response counts cannot be interpreted responsibly without the total evaluable patient denominator, indications, trial phase, and follow-up period. Where those details are not disclosed, the counts are better understood through Imugene’s existing programme coverage than presented in isolation. Specific disclosed rates for cytokine release syndrome, neurotoxicity, and graft-versus-host disease should be read directly from Imugene’s own figures.
Imugene has described azer-cel’s data as comparable with results from other allogeneic programmes; that characterisation is Imugene’s own and is not head-to-head evidence, because the programmes involve different patient populations, prior treatment histories, and trial designs.
A combination approach pairing azer-cel with a BTK inhibitor is under investigation and covered in the dedicated BTKi analysis. Imugene has also received two FDA Fast Track designations, detailed in the marginal zone lymphoma analysis.
Keep these caveats front of mind:
- The 33% attrition figure comes from one disease setting and varies by centre, disease type, and time period.
- Removing the manufacturing wait does not remove fitness requirements, geographic distance, or funding barriers.
- Graft-versus-host disease and durability of response remain open questions for allogeneic programmes.
- Azer-cel is not approved in any jurisdiction; access outside a clinical trial is not available.
For readers wanting the specific response figures across B-cell malignancy subtypes, our full explainer on azer-cel’s Phase 1b basket study results covers the CLL/SLL and MZL cohort data, including complete response rates and the protocol amendment adding the BTKi combination arm.
The way to evaluate a programme like this is with both eyes open: it aims to remove logistical barriers, but it introduces its own biological hurdles, and early data is never a guarantee of long-term real-world success.
Reading cell therapy data with a sharper lens
The single lesson to carry forward is this: a response rate tells you how well a therapy works in the patients who received it, but it does not tell you how many of the intended patients that was.
Allogeneic CAR-T does not make its case on novel biology or an untested target. CD19 is thoroughly established. The argument rests instead on a concrete shortfall inside the existing delivery model: patients who met the eligibility criteria and still never reached treatment. That shortfall is the figure worth tracking as off-the-shelf trials continue to mature.
This article references Imugene Limited, whose azer-cel programme is discussed for informational purposes. It is for informational purposes only and should not be considered financial advice. Investors should conduct their own research and consult with financial professionals before making investment decisions. It is also not medical advice. Clinical data described here is investigational, and early-phase results do not establish long-term outcomes.