Valuing ASX Bank Stocks: What the Ratios Don’t Tell You
59 mins ago

At approximately $36.94 per share in mid-May 2026, National Australia Bank is one of the most widely held stocks on the ASX. Widely held, however, is not the same as fairly priced. Two quantitative valuation methods, applied to NAB’s verified FY24 financial data, produce indicative values ranging from roughly $24.86 to over $41. The gap between those figures is where the real question lives.
Retail investors in Australian bank stocks often rely on dividend history, broker summaries, or instinct rather than running their own numbers. With NAB trading near multi-year highs and the major banks commanding significant portfolio weight in SMSF and retail accounts, understanding whether the current price reflects fair value is a practical financial literacy question.
This guide walks through two valuation methods: the Price-to-Earnings ratio approach and the Dividend Discount Model. Every calculation uses NAB’s verified FY24 figures and is shown in full so readers can replicate the method on any ASX-listed stock.
The PE ratio measures a simple relationship: how much the market is willing to pay for each dollar of a company’s earnings, compared with what the sector average suggests is a fair price per dollar. A stock trading at a PE above the sector average is priced at a premium; below it, a relative discount.
Running this calculation on NAB requires three steps:
The peer comparison pattern is consistent across 2025-2026 market commentary. CBA commands a persistent premium attributed to its stronger return on equity and perceived quality. NAB, ANZ, and Westpac cluster in a lower PE band.
A three-step PE framework, covering threshold assessment, peer comparison, and implied valuation modelling, produces more rigorous conclusions than a single absolute multiple, and applying it to a smaller bank like Bendigo and Adelaide Bank illustrates how persistent PE discounts can reflect genuine structural factors rather than simple mispricing.
| Bank | Approximate PE Multiple | Relative Position |
|---|---|---|
| CBA | Structurally highest among major banks | Premium (quality and ROE driven) |
| NAB | Approximately 16.1x (FY24 cash EPS basis) | Mid-range within lower peer cluster |
| ANZ / WBC | Similar band to NAB | Lower cluster; WBC sometimes at slight discount |
Applying a sector average PE of approximately 18x to NAB’s FY24 EPS of $2.292 produces an indicative value of approximately $41.26 per share.
That figure sits roughly 12% above the current market price, suggesting the PE method frames NAB as modestly cheap relative to the sector. Whether that discount is warranted requires further analysis, starting with the income-based model that follows.
The Dividend Discount Model (DDM) treats a share as a stream of future dividend payments and discounts those payments back to what they are worth today. If the combined present value of all expected future dividends exceeds the current share price, the stock may be undervalued on an income basis. If it falls short, the price may already reflect more growth than dividends alone justify.
The specific DDM variant used here is the Gordon Growth Model, which assumes dividends grow at a constant rate indefinitely:
Value = D1 ÷ (r – g)
The inputs are straightforward:
The DDM’s core assumptions, stable payouts, a mature growth profile, and predictable earnings, match the structural characteristics of CBA, NAB, ANZ, and WBC. These banks have paid dividends consistently for decades, maintain payout ratios anchored to cash earnings, and operate in a regulated oligopoly with relatively steady revenue streams.
The model becomes less reliable for growth-stage companies or businesses with volatile or suspended dividends. That reinforces why it is specifically appropriate here: Australian bank investors are fundamentally asking an income question, and the DDM formalises that question into arithmetic.
The calculation starts with four sequential decisions. Each one is shown below with the specific number chosen and the reasoning behind it.
At these base-case assumptions, the Gordon Growth Model produces an indicative value of roughly $24.86, well below the current market price of $36.94.
Lowering the required return shifts the output materially. At r of 9% and g of 3%: $1.74 ÷ 0.06 = approximately $29.00. Still below the market price, but the gap narrows considerably with a single percentage-point change in one input.
That sensitivity is the most important feature of the model. The table below shows how the DDM output moves across plausible combinations of r and g, all anchored to the verified $1.69 D0.
| Growth Rate (g) | r = 9% | r = 10% | r = 11% |
|---|---|---|---|
| 2% | $24.63 | $21.55 | $19.15 |
| 3% | $29.00 | $24.86 | $21.76 |
| 4% | $35.16 | $29.30 | $25.12 |
Research commentary on DDM outputs for NAB cites a wide range, from approximately $35.74 on a cash basis to $51.66 on a grossed-up dividend basis, depending on the specific r and g assumptions applied. The discount rate assumption is consistently the single biggest lever in the model.
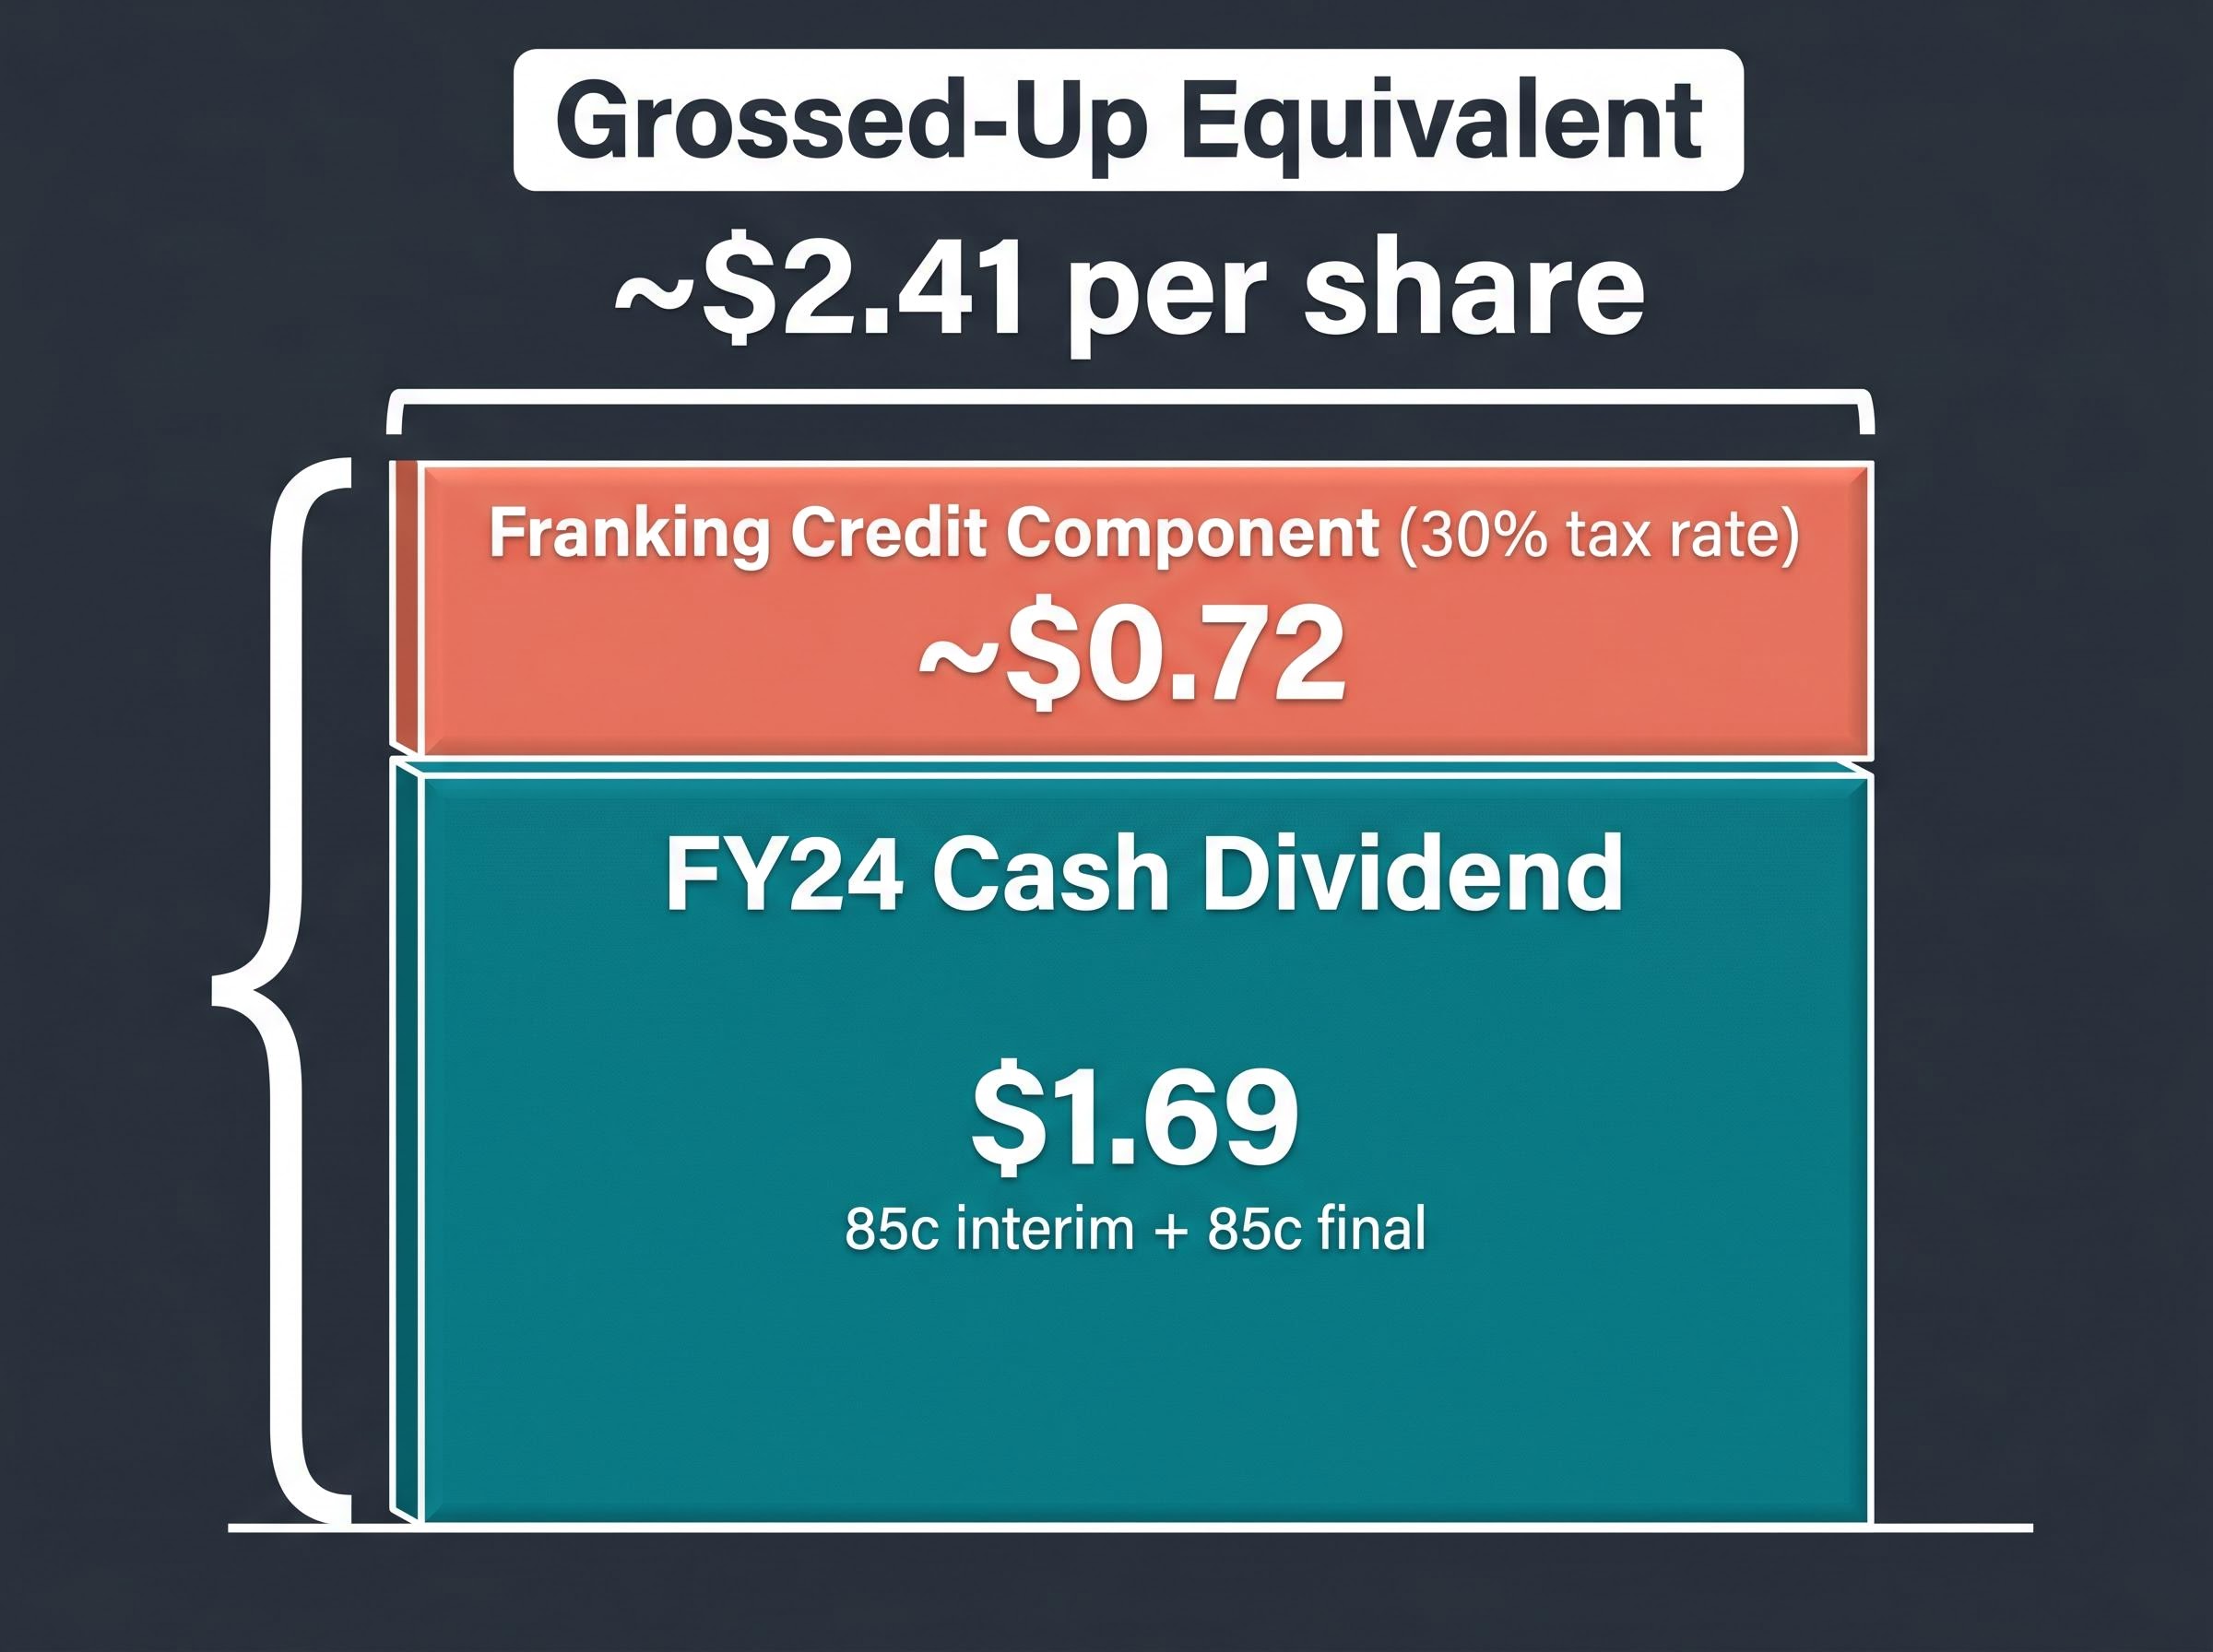
The cash dividend tells only part of the income story. NAB’s dividends are fully franked at the 30% corporate tax rate, meaning eligible shareholders receive a tax credit alongside each cash payment that can offset personal income tax, or be refunded in cash for low-tax entities.
The standard formula underlying franking credit calculations divides the cash dividend by 0.70 and subtracts the original cash amount, reflecting the 30% corporate tax already paid at the company level before the distribution reaches shareholders.
The grossed-up dividend calculation reveals the gap. Cash dividend of $1.69 divided by 0.70 (that is, 1 minus the 30% tax rate) equals a grossed-up equivalent of approximately $2.41 per share. The franking credit component alone is worth roughly $0.72 per share.
Not every investor captures that full $0.72. The value depends on tax position:
The ATO rules on refunding excess franking credits confirm that eligible low-tax entities, including pension-phase SMSFs, can receive franking credits as a cash refund where the credit exceeds their tax liability, which is precisely the mechanism that makes the grossed-up dividend the economically relevant figure for that investor cohort.
For a pension-phase SMSF, NAB’s $1.69 cash dividend grosses up to approximately $2.41 per share once franking credits are included, representing a materially higher effective income yield.
Substituting the grossed-up $2.41 as D0 and growing it by 3% produces D1 of approximately $2.48. Applying the same base-case required return of 10%:
$2.48 ÷ (0.10 – 0.03) = approximately $35.43.
That figure sits much closer to the current market price of $36.94 than the cash-only DDM result of $24.86. For investors who can fully utilise franking credits, the gap between the DDM output and the market price narrows considerably.
This scenario should be clearly labelled as the franking-adjusted case, not the base case, since not all investors can fully utilise credits. Research commentary citing a grossed-up DDM result of approximately $51.66 used a $2.44 forecast gross dividend at different r and g assumptions, illustrating how sensitive even the adjusted model remains to input choices.
Two neat calculations and a sensitivity table can create a false sense of precision. Both methods carry structural limitations that matter specifically for bank stocks.
The PE ratio’s core weakness is that it treats all earnings as equal. A bank can report high cash EPS while carrying a deteriorating loan book that has not yet flowed through to provisions. Earnings quality matters as much as the earnings level, and the PE ratio does not distinguish between them.
The DDM’s vulnerability is the one the sensitivity table already demonstrated: small changes in the discount rate or growth rate produce large swings in the output. A 1% shift in the required return moved the base-case valuation from $24.86 to $29.00. That is not a rounding error; it is a structural feature of a model where two closely spaced numbers sit in the denominator.
It is also worth noting that the FY24 EPS figure used throughout this guide is cash earnings. Statutory earnings can differ from cash earnings, particularly in years with significant notable items.
Bank earnings are inherently more complex than those of non-financial companies. Provisioning decisions, capital ratios, and funding structure all affect the true earning power behind the reported EPS figure.
Four additional checks are worth running before drawing an investment conclusion from these valuations:
Balance sheet metrics, including NPL ratios, CET1 capital buffers, and deposit-to-wholesale funding composition, address exactly the provisioning and credit quality blind spots that the PE ratio and DDM leave uncovered, and reading them alongside the earnings-based models produces a materially more complete picture of whether reported EPS is sustainable.
A PE ratio or DDM output is a hypothesis about value. The balance sheet details are where you test it.
NAB’s CET1 capital ratio and wholesale funding reliance, both available in the bank’s investor presentations, are two metrics worth checking alongside any valuation exercise.
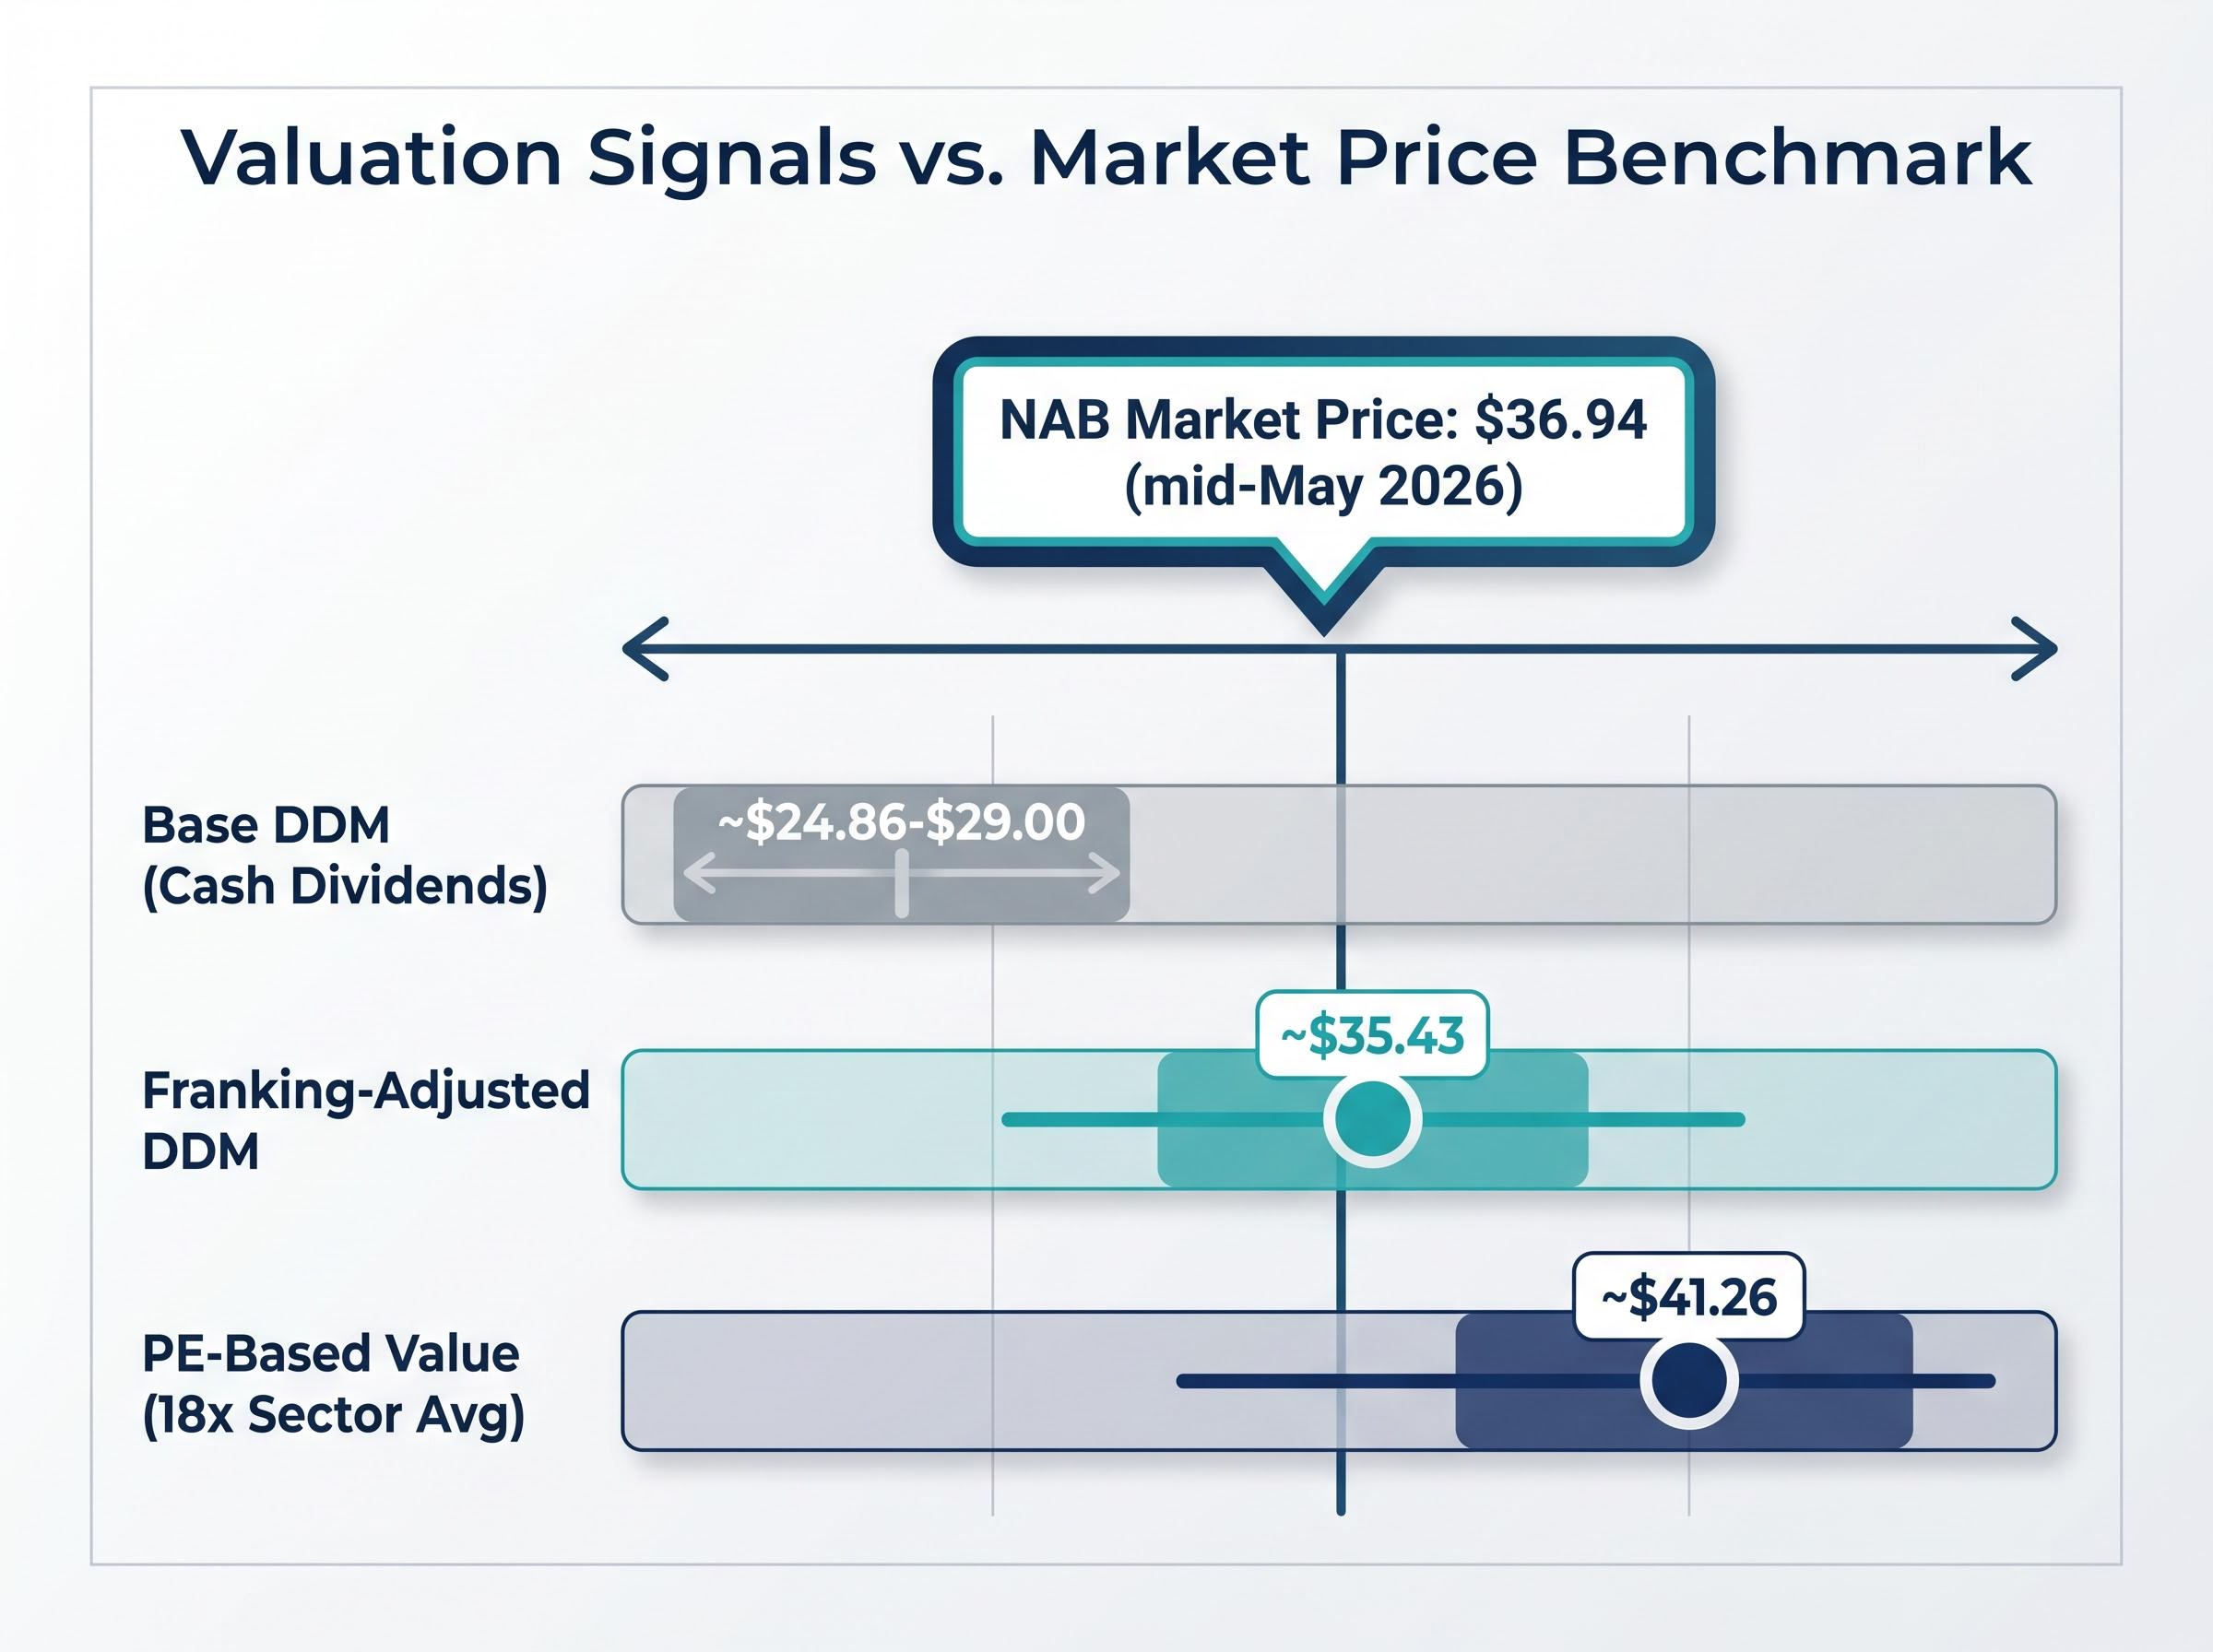
The two methods produce three distinct signals depending on how income is measured and what return is demanded.
| Valuation Method | Key Assumption | Indicative Value | Signal vs. $36.94 |
|---|---|---|---|
| PE-based (sector average) | Sector PE of 18x | ~$41.26 | Modest discount to peers |
| Base DDM (cash dividends) | r of 9-10%, g of 3% | ~$24.86-$29.00 | Market price above conservative income value |
| Franking-adjusted DDM | r of 10%, g of 3%, grossed-up D0 | ~$35.43 | Broadly aligned for investors with full franking benefit |
The PE method produces the most favourable signal, suggesting the market is pricing NAB at a discount to the sector average. The base-case cash DDM is the most cautious, indicating the current price may reflect expectations beyond what dividends alone justify at a 10% required return. The franking-adjusted DDM sits between the two and narrows the gap considerably for pension-phase SMSF investors and others who capture the full credit.
Neither model produces a definitive buy or sell signal in isolation. Together, they bracket the range of rational values depending on the investor’s tax position and return requirements.
The overall picture depends materially on which return assumption is applied and which investor tax profile is relevant. That is not a weakness of the analysis; it is a feature. Valuation is a range, not a point.
For updated inputs, NAB’s ASX announcements page (https://www2.asx.com.au/markets/company/nab) and the official results PDFs provide the EPS and dividend figures needed to refresh these calculations as new reporting periods arrive.
Readers who have followed this walkthrough can now apply both the PE ratio method and the Gordon Growth Model DDM to any ASX-listed, dividend-paying stock with a verified EPS and dividend figure. The calculations are transferable; only the inputs change.
The most important skill is not selecting the “right” output from the range. It is understanding which input assumptions drive the answer most, and stress-testing those assumptions against the specific company’s financial position. For the DDM, that means the required return. For the PE method, that means the comparability of the chosen sector benchmark.
NAB’s FY25 full-year results are expected in the second half of 2025. When those figures are released, updating D0 and EPS with the new verified numbers will keep the valuation current.
For readers who want a rigorous checklist covering loan book growth quality, provisioning overlay size, deposit-to-wholesale funding ratios, and NIM trajectory across CBA, ANZ, NAB, and Westpac, our dedicated guide to NIM and provisioning risk works through each factor in sequence using the most recent reported figures, showing how a single provisioning cycle can materially compress the earnings that both the PE ratio and DDM assume remain stable.
This article is for informational purposes only and should not be considered financial advice. Investors should conduct their own research and consult with financial professionals before making investment decisions. Past performance does not guarantee future results. Financial projections are subject to market conditions and various risk factors.
The Dividend Discount Model (DDM) values a share by discounting all expected future dividend payments back to today's present value. Applied to NAB using the verified FY24 cash dividend of $1.69 per share, the base-case Gordon Growth Model produces an indicative value of approximately $24.86 at a 10% required return and 3% growth rate.
NAB's dividends are fully franked at the 30% corporate tax rate, grossing up the $1.69 cash dividend to approximately $2.41 per share for eligible investors. Pension-phase SMSFs can receive the franking credit as a cash refund, and substituting this grossed-up figure into the DDM produces an indicative value of approximately $35.43, much closer to the current market price of $36.94.
Based on FY24 cash earnings per share of $2.292 and a share price of approximately $36.94, NAB's PE ratio is roughly 16.1x. This places NAB in a lower cluster alongside ANZ and Westpac, below CBA, which commands a structurally higher multiple driven by stronger return on equity.
The required return (r) is the single most influential input in the Gordon Growth Model. A one percentage point change in the required return, for example moving from 10% to 9%, shifts the NAB base-case DDM output from approximately $24.86 to $29.00, illustrating how sensitive the model is to this one assumption.
Investors should review balance sheet metrics including the non-performing loan ratio, CET1 capital buffer, bad debt provisioning trends, and the mix of wholesale versus retail deposit funding, as these factors affect the sustainability of the earnings and dividends that both the PE ratio and DDM assume remain stable.