The global financial system is being pulled in two directions at once, and the strain is showing up directly in the price of nearly every international asset you own.
As of late September 2026, the Federal Reserve and the European Central Bank are running on entirely different clocks. Washington is holding rates high to finish off stubborn inflation, while Frankfurt is inching forward cautiously, wary of energy shocks and fragile growth.
That widening policy gap has stopped being an economists’ debate. It is now the main force steering global currency markets and deciding where capital flows.
This explainer gives you a clear framework for understanding how a gap between two central banks shapes long-term currency trends. You will learn the mechanics behind currency valuation, see exactly why European officials are hesitating, and understand how to think about positioning your portfolio for a structurally stronger US Dollar.
The 125-basis-point gulf separating Washington and Frankfurt
Start with the raw number, because everything else follows from it. As of mid-to-late September 2026, the Federal Reserve’s benchmark sits 125 basis points above the European Central Bank’s, and that spread is the single most important figure in global currency markets right now.
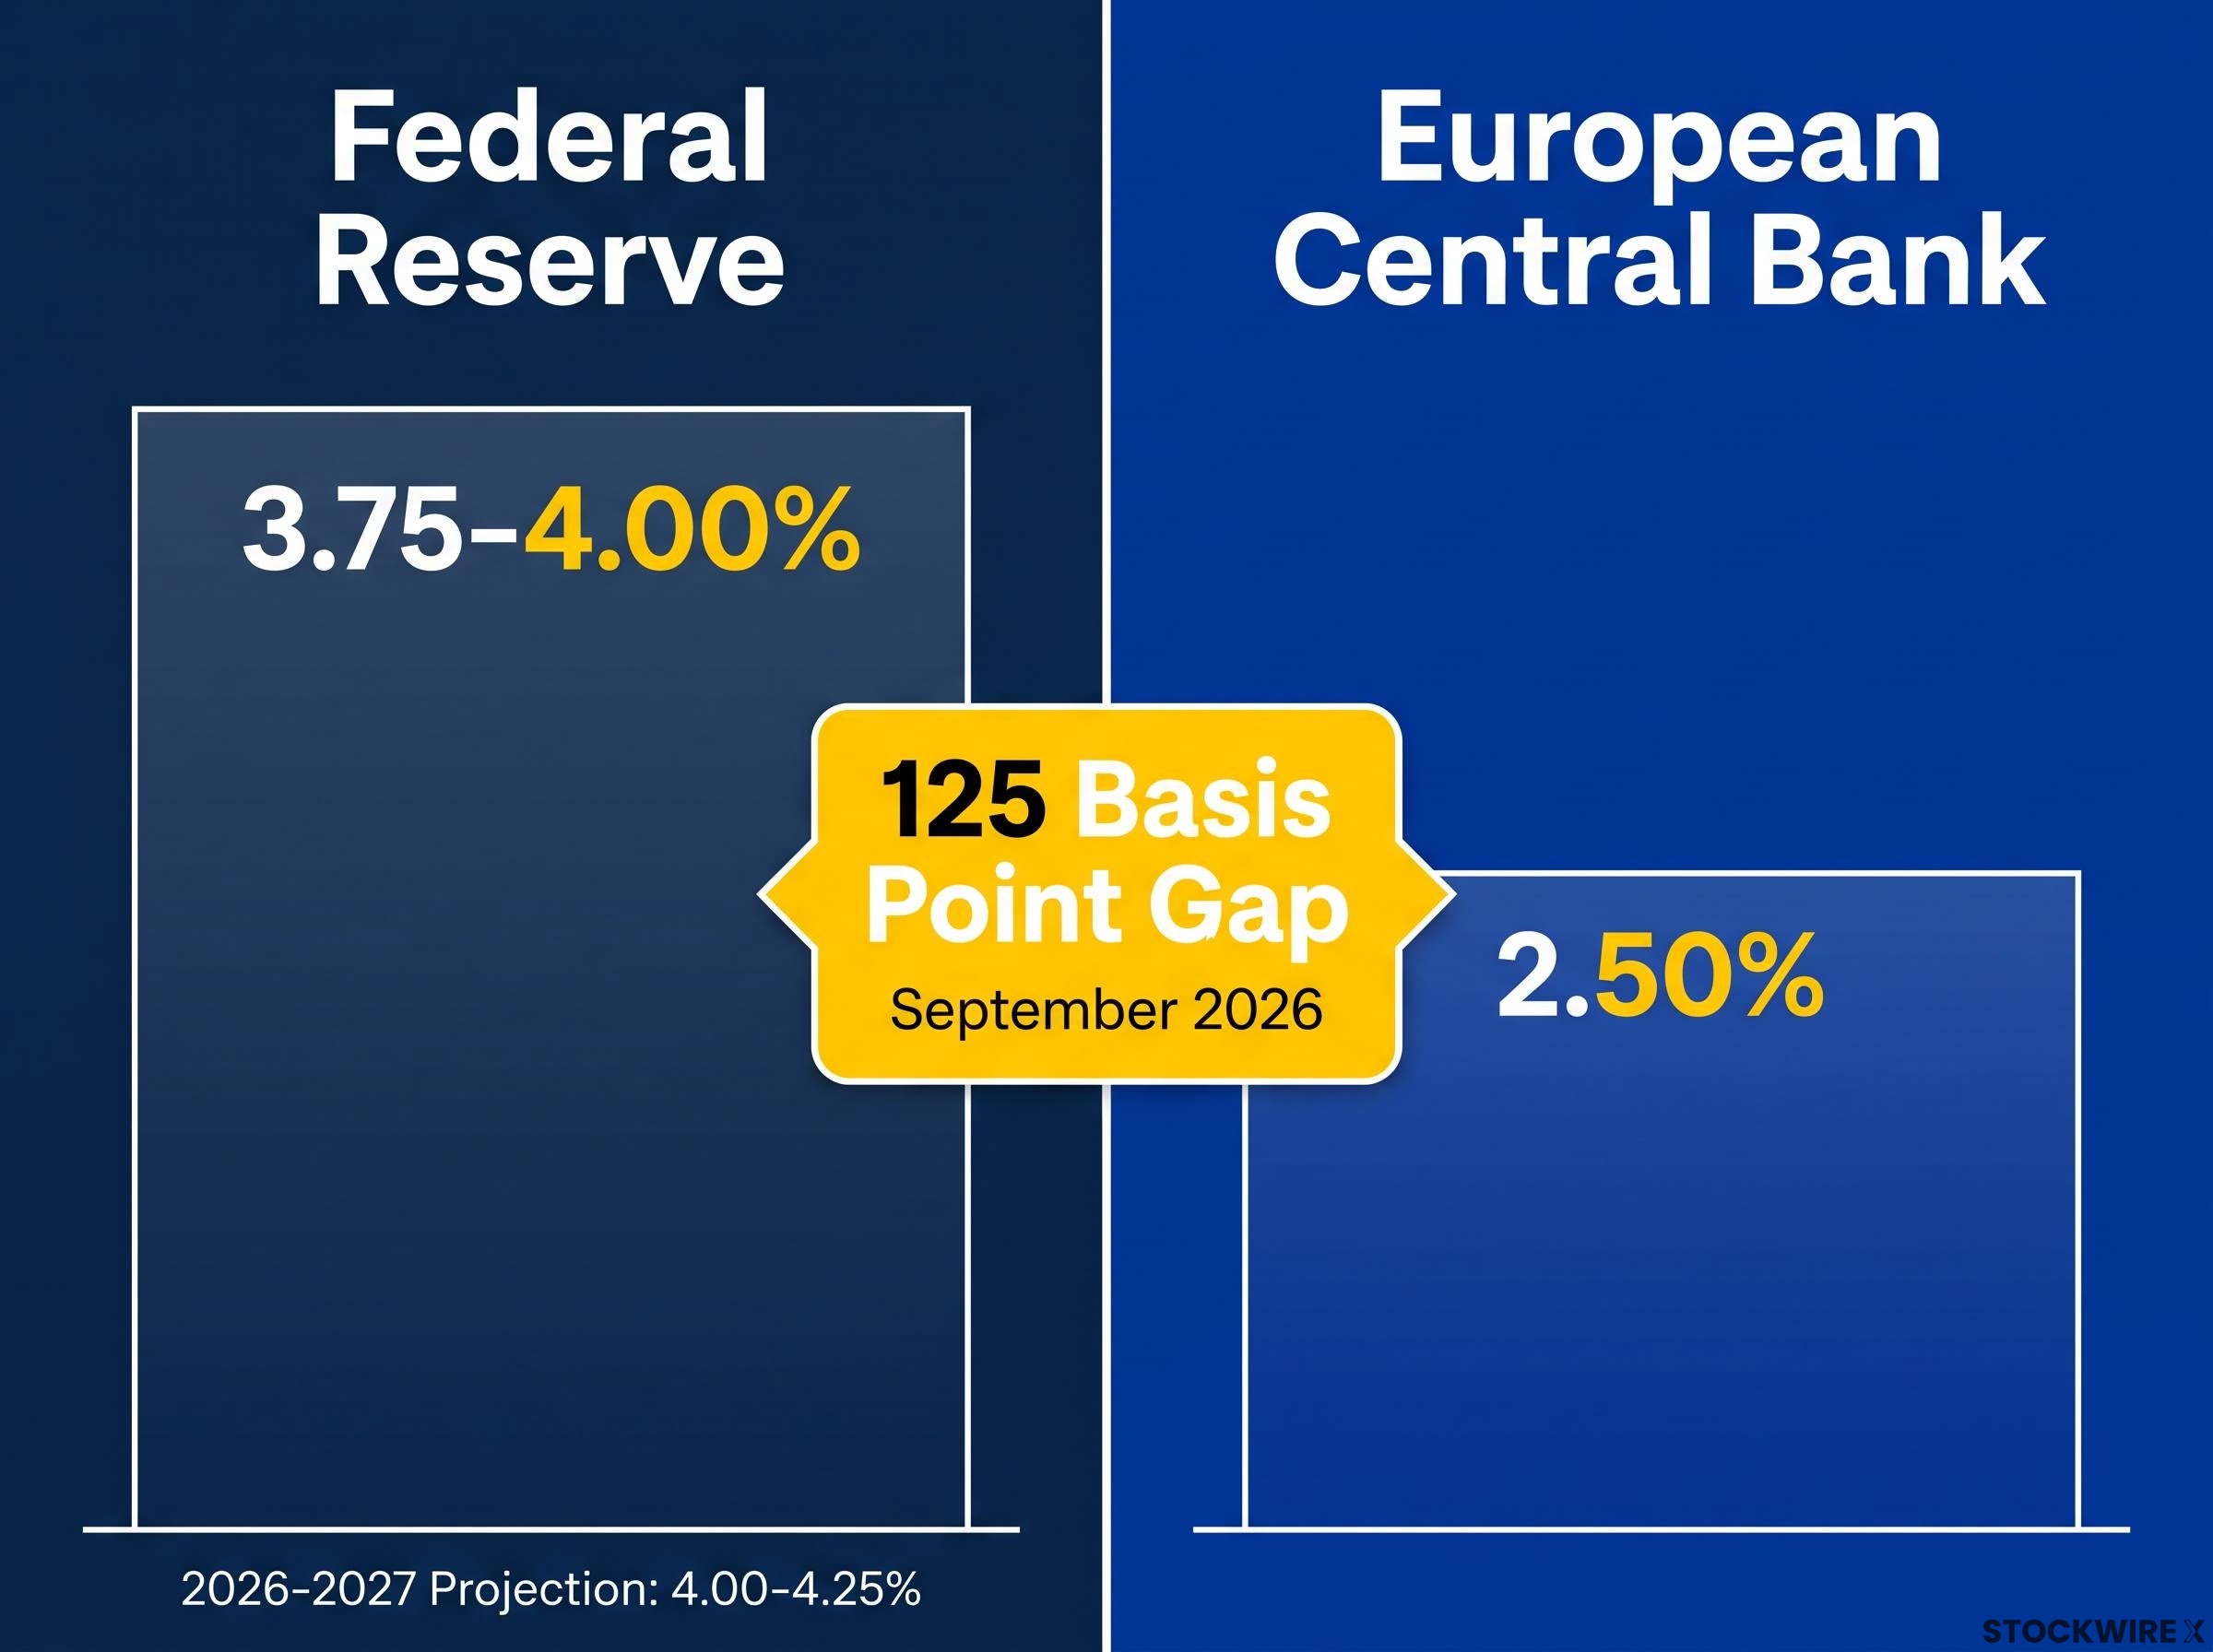
Here is how the two stack up. On 16 September 2026, the Federal Open Market Committee raised its federal funds target range by 25 basis points to 3.75-4.00%. The ECB Governing Council, meeting on 10 September 2026, also lifted rates by 25 basis points, taking its deposit facility rate to 2.50% effective 16 September 2026.
Same 25-point move, wildly different starting points. That is the gap in a sentence.
The September 2026 Fed decision crystallised these forces in real time: the DXY technical breakout above 100 following the unanimous 12-0 hike reflected not just the rate move itself but a 30-basis-point dot-plot revision and layered safe-haven demand from Middle East geopolitical risk arriving simultaneously.
The trajectory tells the same story. The Fed’s September 2026 dot plot, the chart that maps where individual Committee members expect rates to land, clusters year-end projections for both 2026 and 2027 around 4.00-4.25%. In plain terms, the Fed expects to stay restrictive for a long time.
| Metric | Federal Reserve | European Central Bank |
|---|---|---|
| Current benchmark rate (September 2026) | 3.75-4.00% (federal funds target range) | 2.50% (deposit facility rate) |
| Stated policy focus | Ensuring inflation returns durably to target | Data-dependent, monitoring energy-driven inflation |
| Year-end trajectory | Clustered around 4.00-4.25% through 2027 | Uncertain, further tightening not fully priced |
Notice what to focus on here. The absolute level of either rate matters far less than the spread between them, because that gap is what dictates the gravitational pull on your international assets. A 125-basis-point advantage for US assets is not a temporary wobble; it is a structural feature of the 2026 macro backdrop, and you cannot adjust your strategy without first knowing exactly how wide that yield advantage runs.
When big ASX news breaks, our subscribers know first
How central bank divergence actually dictates currency values
So why does a gap between two committees in different cities move the value of the money in your portfolio? The link is mechanical, and once you see it, currency moves stop feeling random.
The main transmission channel is the interest rate and yield differential. When the Fed holds a higher policy rate and US yields sit above euro-area yields, global money has a simple incentive: park capital where it earns more. That demand for US assets means demand for the US Dollar, which pushes the Dollar up and, by definition, the Euro down.
Research from the Bank for International Settlements (BIS) and the International Monetary Fund (IMF) has consistently framed EUR/USD moves through exactly this lens, often via the concept of uncovered interest parity, the theory that currency movements should offset differences in interest rates between two countries.
The flows arrive through three main channels.
- Carry trades. Higher returns on US cash and short-dated bonds attract investors who borrow in lower-yielding currencies to hold higher-yielding Dollar assets.
- Portfolio rebalancing. Global managers shift allocations toward US Treasuries and US credit to capture the yield advantage, moving real money into Dollar-denominated markets.
- Safe-haven demand. A high-yielding US that is also seen as a haven draws additional Dollar buying whenever global risk appetite sours.
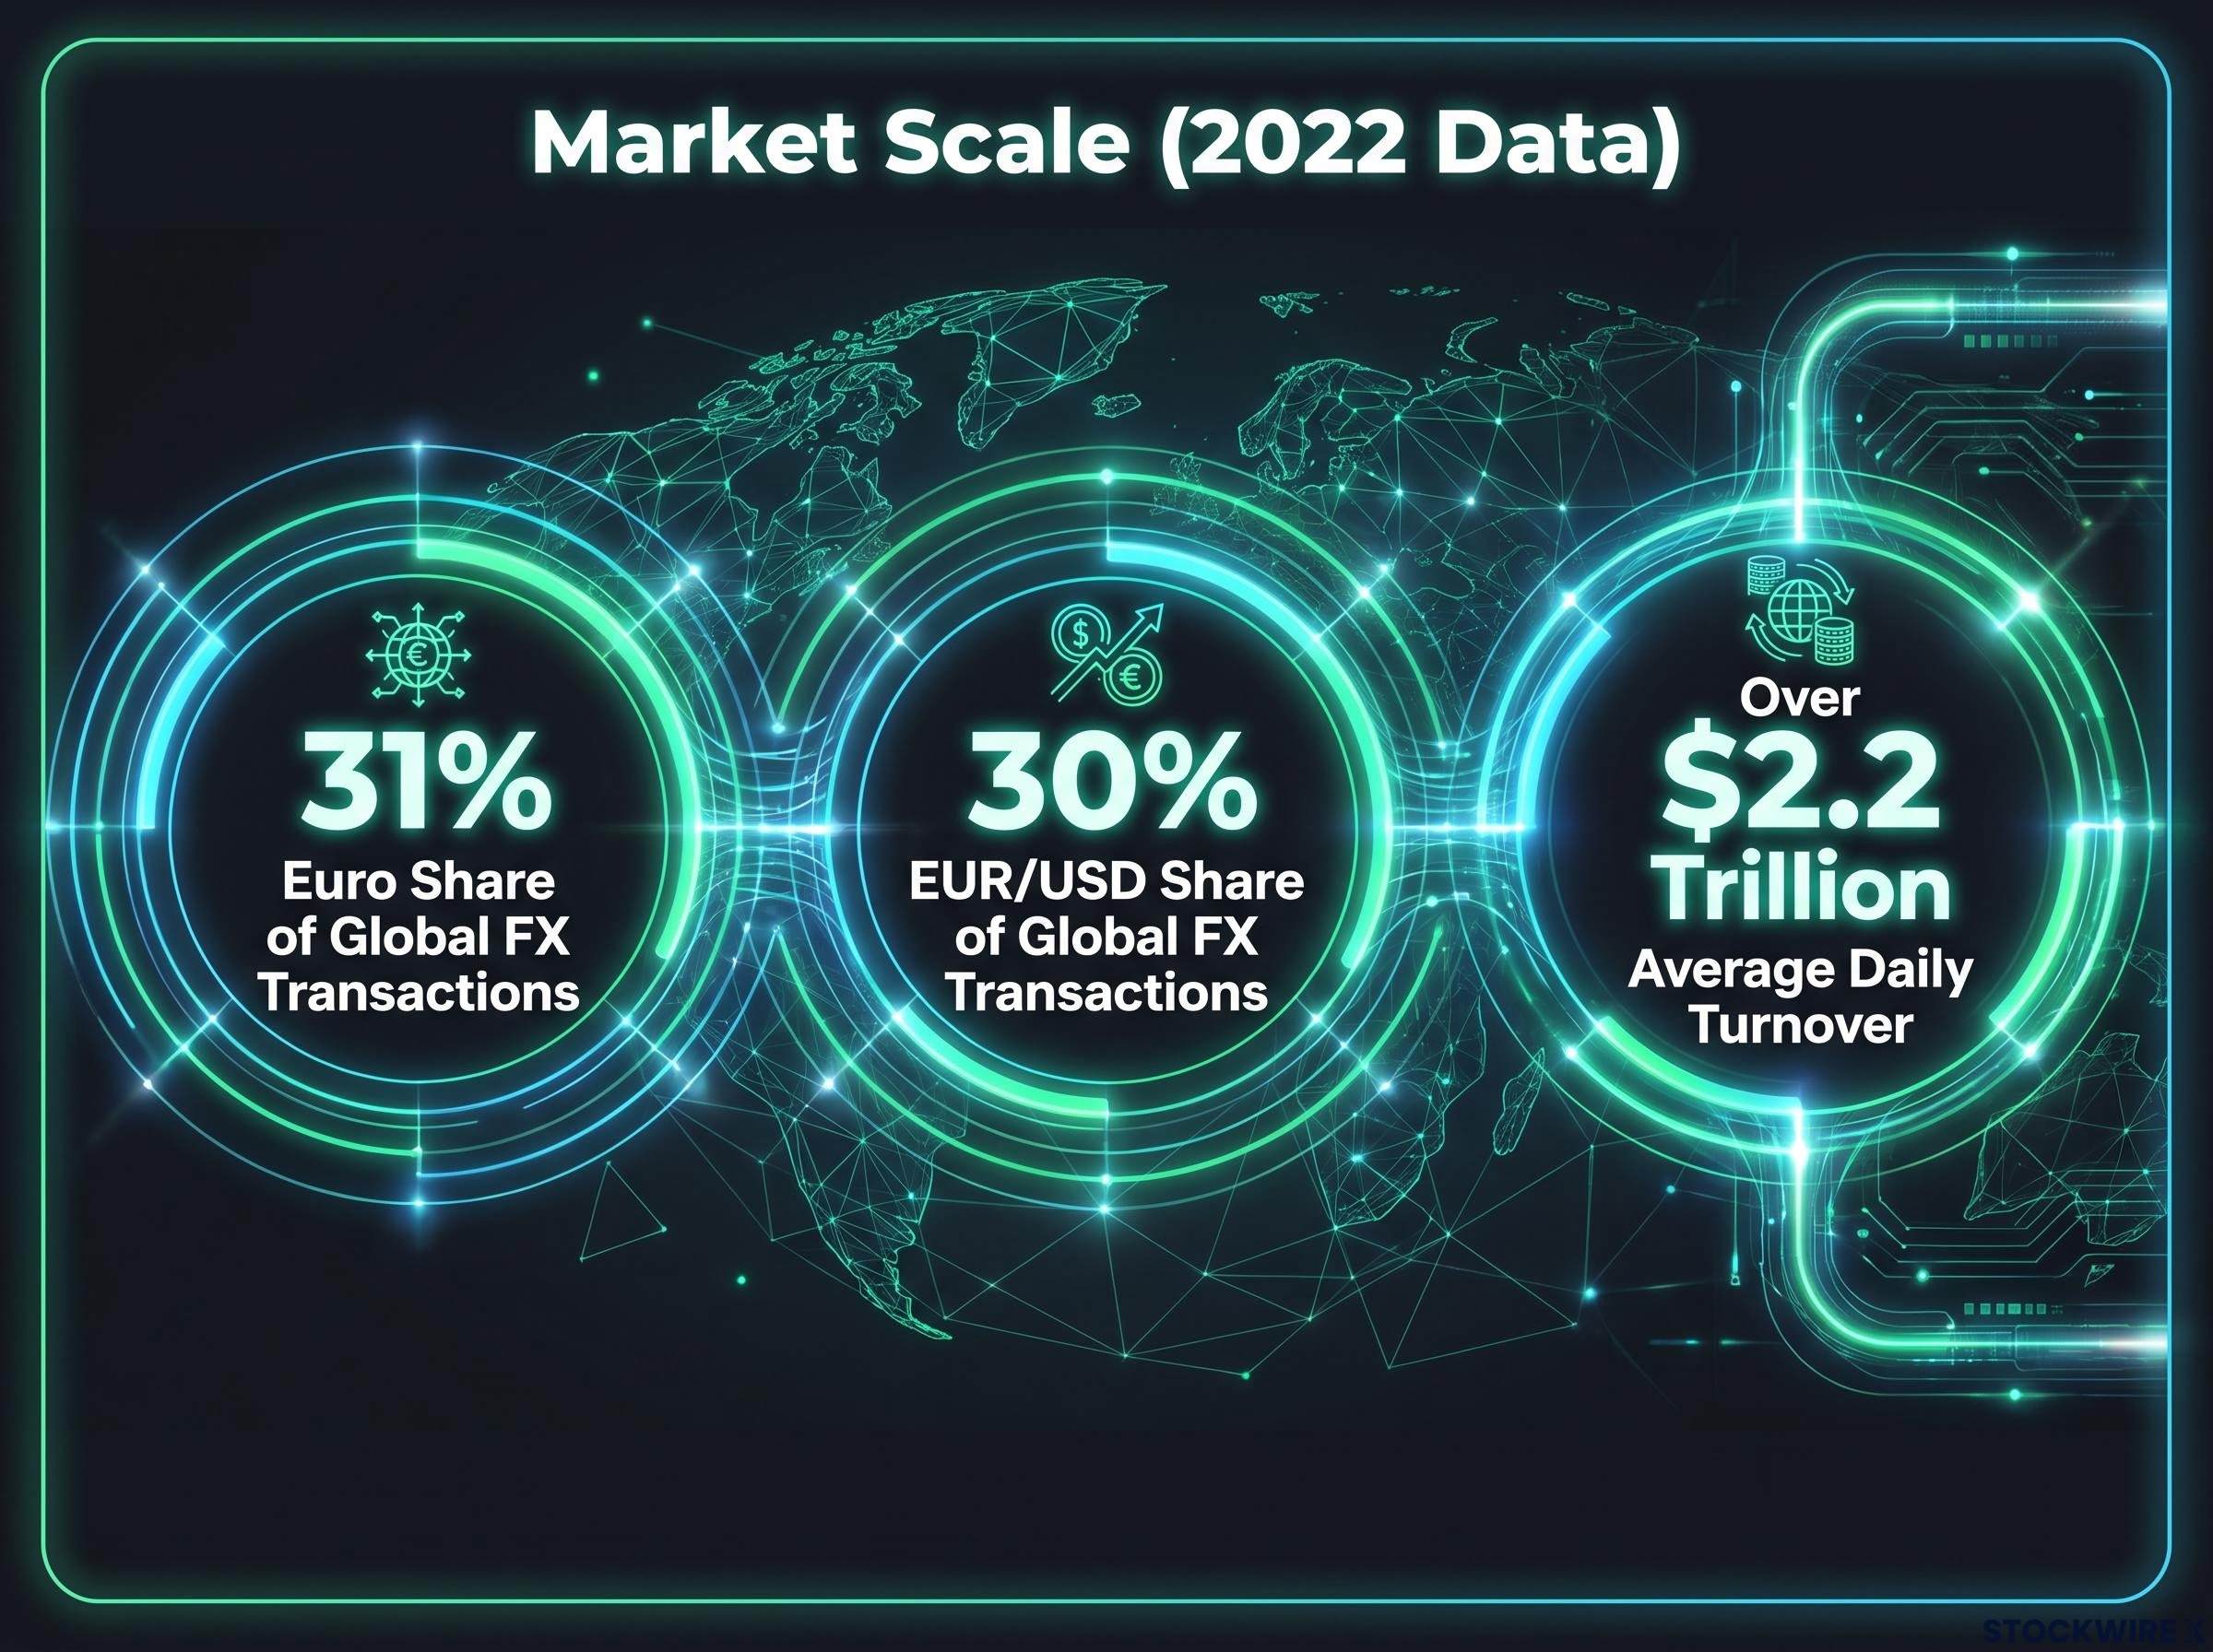
The scale here is worth grasping. The Euro represented 31% of all global foreign exchange transactions in 2022, with average daily turnover above $2.2 trillion. EUR/USD alone accounted for an estimated 30% of all global FX transactions that year, making it the most heavily traded currency pair on the planet.
When the most-traded pair in the world reprices around a rate gap, the effect ripples through everything from your international equity funds to the cost of imported goods.
One caution worth holding. Analysts at global banks such as Goldman Sachs and JPMorgan argue that rate differentials alone are less predictive than they once were, with relative growth and productivity expectations increasingly driving the pair. Strong US growth can push EUR/USD lower even with only a modest rate advantage.
Understanding this mechanism gives you a reliable compass for your currency exposure. It lets you read structural capital trends rather than reacting to the daily chart noise that dominates headlines.
Why the European Central Bank is playing a waiting game
Now flip the perspective. If the Fed is holding firm, why is the ECB not simply matching it? The answer is that Europe’s rate hike was a targeted response to a specific problem, not a signal of an overheating economy.
The 10 September 2026 Governing Council decision to raise rates by 25 basis points was driven by energy-related inflation pressures, an energy shock tied to geopolitical developments. This was defence against a supply-side price spike, not a reaction to booming domestic demand of the kind driving the US.
That distinction matters for what comes next. The ECB is not looking to keep tightening for its own sake; it is watching for one specific danger.
Secondary inflation mechanics
The trigger the ECB is monitoring is what policymakers call secondary inflation effects, the point at which a one-off jump in energy prices starts feeding into wider wages and prices across the economy. A spike in gas prices is a first-round effect. Workers demanding higher pay to cover that spike, and firms raising prices in response, is the second round, and that is far harder to reverse.
ECB policymaker Gabriel Makhlouf signalled that the central bank could raise borrowing costs again if elevated energy prices begin transmitting into broader price pressures, while noting that no evidence of such effects had yet emerged.
The stakes here are sharpened by a significant disagreement between ECB inflation forecasts and independent bank modelling: Rabobank projects Eurozone headline inflation peaking near 4.4-4.5% in early 2027, almost double the ECB’s own 2.5% forecast for that year, with the entire gap driven by differing energy price assumptions.
Makhlouf indicated the ECB could tighten further only if elevated energy prices begin feeding into broader, secondary inflation effects across the economy. At the time of the September decision, he noted no such evidence had appeared.
Energy price volatility complicates the ECB’s core job of maintaining price stability, because it forces the Governing Council to separate a temporary shock from a durable inflation trend before acting. That is why the threshold for further tightening is high, and why markets are not fully pricing another hike until December 2026 at the earliest.
The practical takeaway for you: watch European wage and price data as closely as the press conferences. Those underlying figures will signal the ECB’s next move before officials confirm it, which means European inflation and labour reports now carry the power to shift the EUR/USD balance overnight.
The structural reality of a long-term strong Dollar
Widen the lens and a bigger picture comes into view. The rate gap is the immediate driver, but the case for a durably strong Dollar rests on foundations that outlast any single policy meeting.
Societe Generale has reaffirmed its long-term bullish framework for the US Dollar, maintaining that strong Dollar fundamentals will ultimately prevail despite subdued near-term volatility. The bank’s strategists left their outlook unchanged, conceding that volatility has been the main casualty of the tension between Dollar fundamentals and a stated US preference for a weaker currency, but held firm that fundamentals reassert themselves over time.
History backs the pattern. During the 2014-2016 cycle, the Fed normalised policy while the ECB launched large-scale asset purchases and pushed rates negative. EUR/USD fell from around 1.40 in early 2014 to near parity by late 2015 into early 2016, a stark illustration of how sustained divergence can drive prolonged euro depreciation.
Several structural factors support the Dollar beyond the interest rate spread.
- Enduring safe-haven status. The US remains the primary provider of deep, liquid, high-quality assets, especially Treasuries, and global investors still flock to the Dollar in a crisis.
- Relative productivity and growth. US innovation and corporate profitability tend to outpace other advanced economies, supporting higher real returns on Dollar assets.
- Institutional infrastructure. Rule of law, investor protections, and developed capital markets keep global demand for US assets high and make rapid de-dollarisation unlikely.
The picture is not one-sided. The IMF and BIS warn that prolonged Dollar strength tightens global financial conditions, particularly for emerging markets carrying heavy US Dollar debt, raising their debt-service burdens and rollover risk. Both institutions also flag that the Dollar can trade above levels implied by fundamentals, leaving room for eventual mean reversion once US rates peak.
There is also the counter-case from history. In 2017, EUR/USD rallied despite ongoing Fed hikes, as euro-area growth improved and markets anticipated eventual ECB tapering. Rate divergence, in other words, interacts with growth, and it does not move the pair in a straight line.
The counter-argument deserves weight: as of early September 2026, the DXY was trading in the low-to-mid 98s despite a yield-strength relationship that should have been supportive, with analysts at Convera, Nomura, and Bank of America reading rising 10-year yields near 4.77% as a fiscal risk premium rather than an investment signal.
What this means for you is a matter of preparation, not prediction. Stress-test your portfolio against a scenario where the Dollar stays structurally dominant for years, rather than assuming a quick snap back to historical averages. That framing shapes how you weigh unhedged international equities and foreign currency cash, and it stops you from fighting a trend with genuine staying power.
This article is for informational purposes only and should not be considered financial advice. Investors should conduct their own research and consult with financial professionals before making investment decisions. Past performance does not guarantee future results. Financial projections are subject to market conditions and various risk factors.
Navigating the new baseline in global currency markets
Strip everything back and one fact anchors the whole picture: the 125-basis-point policy spread between Washington and Frankfurt is the defining feature of currency markets right now. It is not background noise; it is the main event.
That gap will not close on a whim. It resolves only when European growth accelerates enough to justify further ECB tightening, or when US inflation collapses durably enough to let the Fed cut. Until one of those happens, the structural pull toward the Dollar persists.
Your monitoring list follows directly from that. Watch US inflation prints and Fed guidance on one side, and European wage, price, and energy data on the other. Those releases move the spread, and the spread moves your international exposure.
For investors who want to act on these signals before the market moves, our comprehensive walkthrough of reading macro events explains how to use OIS curve pricing, CFTC positioning data, and PPI-CPI sequencing to anticipate EUR/USD moves ahead of scheduled central bank announcements.
The strategic point is simple. A long-term international strategy has to account for this transatlantic policy gap, because waiting for coordinated central bank action is no longer a viable thesis. Position for the divergence you can see, not the convergence you might wish for.