
Something unusual is happening in global bond markets this month. Government bond yields in the United States, Japan, the United Kingdom, and Australia are all climbing at the same time, yet no global central bank meeting triggered it, no coordinated policy action explains it, and no single inflation print connects them.
So if the usual suspects are not responsible, what is actually driving this?
The moves are not trivial. The US 10-year Treasury yield has jumped 29 basis points in two weeks, Japanese government bond yields have crossed 3% for the first time since 1996, UK gilt yields sit at their highest since 2007, and Australian 10-year yields are back at levels last seen in 2011. This is a structural repricing of long-duration sovereign debt happening across the developed world simultaneously.
The mechanism behind it is one most market commentary has not been naming clearly: the term premium. After reading this, you will have a working conceptual toolkit for what term premium is, why it is the structural force linking these otherwise independent moves, and what a high-term-premium environment means for the assets in your portfolio.
What the yield data is actually telling you right now
Consider what is happening across four completely separate economies, each with its own central bank, its own fiscal position, and its own inflation dynamics.
In the United States, the 10-year Treasury note reached 4.98% to 5.01% in mid-September 2026, briefly touching 5.01% to 5.02%, its highest level since October 2023. That 29-basis-point climb over two weeks amounts to roughly a two-standard-deviation move relative to where the market was pricing at the start of the period.
In Japan, the benchmark 10-year JGB yield now sits at 3.00% to 3.04%, with early September auctions clearing near 2.995%. Japanese 10-year yields have not touched the 3% threshold since September 1996, nearly three decades ago.
The United Kingdom tells the same story. The 10-year gilt is trading at 5.33% to 5.39%, its highest since 2007, and the government recently auctioned a 30-year gilt at the steepest yield on record since tracking began in 1998.
Australia rounds out the picture, with the 10-year government bond reaching 5.38% to 5.40% and intraday highs near 5.404%, the highest since 2011.
| Market | Current 10-year yield | Historical reference |
|---|---|---|
| United States | 4.98% to 5.01% | Highest since October 2023 |
| Japan | 3.00% to 3.04% | First time at 3% since September 1996 |
| United Kingdom | 5.33% to 5.39% | Highest since 2007 |
| Australia | 5.38% to 5.40% | Highest since 2011 |
Here is the detail that matters most: these are four independent fiscal systems and four independent central banks moving in the same direction at once. That synchronicity is exactly what makes the episode so telling.
The inverse relationship at the heart of bond yield mechanics, where a lower purchase price automatically produces a higher yield, is purely mathematical, but the forces that move market prices are layered: inflation data, central bank signals, and fiscal risk perceptions all feed into the same single number you see on a screen.
There is a further wrinkle. Nominal yields are rising even as longer-term inflation breakevens have stayed relatively contained, which means this is not simply the market repricing how much inflation it expects.
The market read from LPL Research Bond buyers are still willing to purchase government debt. They are simply no longer willing to do so at the prices that prevailed under the previous interest rate regime.
The synchronicity across four separate jurisdictions tells you something specific: whatever is moving these yields is not country-specific. It is embedded in the global structure of long-duration sovereign debt itself. If you hold long-duration bonds, bond funds, or rate-sensitive equities, working out the source of this move is what determines whether the repricing has further to run or is close to exhausting itself.
When big ASX news breaks, our subscribers know first
The Bernanke decomposition: how economists actually break down a bond yield
The yield you see on a screen is a single number. What economists understand, and what makes the current moment legible, is that this single number is actually the sum of three separate forces.
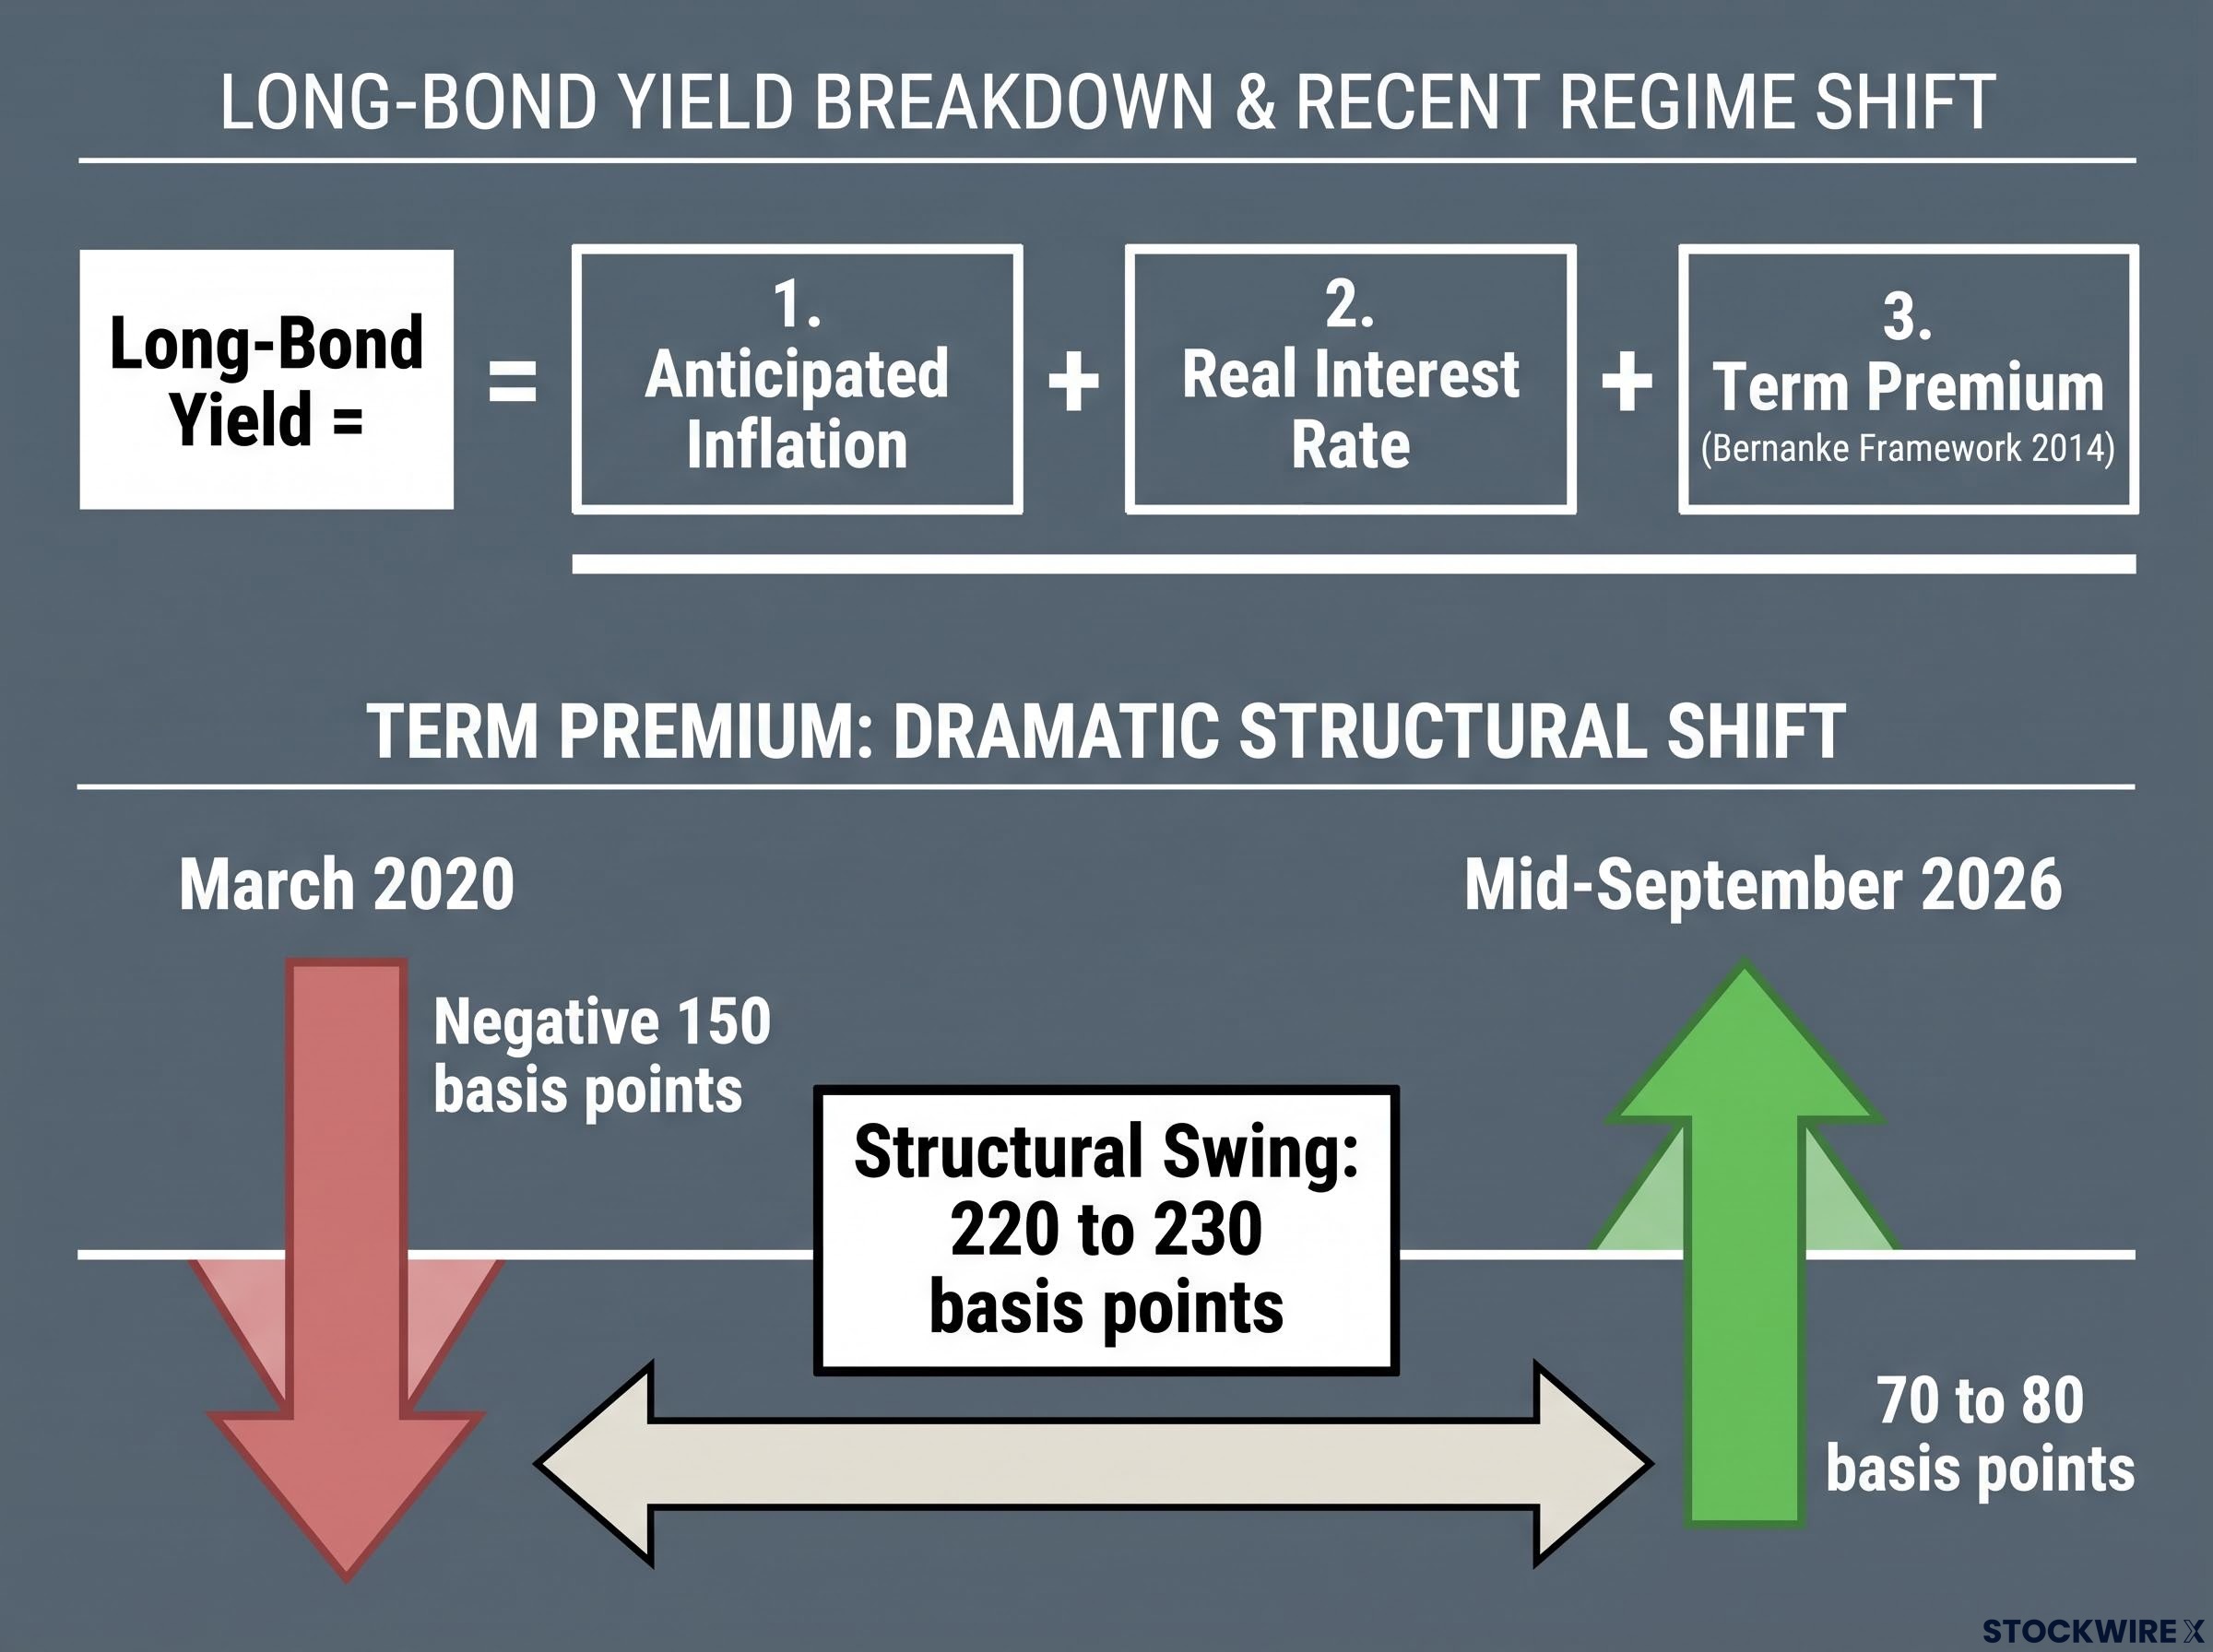
Former Federal Reserve Chair Ben Bernanke laid out this framework in 2014. A long-bond yield can be broken into three parts:
- Anticipated inflation: the average rate of price increases investors expect over the life of the bond.
- The real interest rate: the return investors require above inflation, reflecting views on growth and productivity.
- Term premium: the extra compensation investors demand for holding a long-duration bond rather than rolling over a series of shorter-term instruments.
The first two are relatively straightforward to observe or infer from market prices. The third is where the difficulty lies.
Why the model sensitivity matters for how you read today’s data
Term premium is a residual. It cannot be read directly from any market price, which means it has to be estimated using statistical models. The primary reference is the Adrian-Crump-Moench (ACM) model maintained at the Federal Reserve.
Term premium captures two distinct risk concepts at once. One is the compensation you demand simply for locking up your capital over a long horizon. The other is your uncertainty about where inflation and growth will actually land across that horizon.
The current numbers are striking. The ACM model estimates the US 10-year term premium at 70 to 80 basis points in mid-to-late 2026, peaking near 80 basis points in mid-August and settling near 70 basis points by mid-September. In March 2020, the same model read approximately negative 150 basis points.
The regime shift in one number From roughly negative 150 basis points in March 2020 to around positive 75 basis points today: a structural swing of 220 to 230 basis points.
That swing tells you the foundational assumption embedded in long-duration pricing during 2020 and 2021, that holding long bonds carried no meaningful duration risk, has been completely and structurally reversed.
Because term premium is inferred rather than observed, analysts genuinely disagree about how much of the current yield rise to attribute to it, versus repriced inflation expectations or moving real rates. Research from the IMF and BBVA cautions that yield decompositions often blend several risk components together. The distinction between structurally higher predicted inflation, which lifts the risk-free rate, and uncertainty about future inflation outcomes, which drives term premium, is analytically meaningful and frequently conflated in market commentary.
Why does the distinction matter for you? Because each component carries a different policy implication. Rising inflation expectations demand tighter monetary policy. Rising real rates reflect growth and productivity views. But a rising term premium can, in theory, permit a lower short-rate path even while long yields climb. Confuse the three, and you misread the signal entirely.
Bruegel data attributes roughly 80% of the rise in US long-term rates since September 2024 to the real yield component rather than inflation expectations, classifying the move as a discount-rate shock and reinforcing the Bernanke decomposition point that the reason behind a yield rise matters as much as the direction.
What is actually causing term premium to rebuild globally right now
If no single central bank can explain a move across four jurisdictions, the cause has to be something shared. Three structural forces are converging, and each one adds a layer of pressure on top of the last.
- Net sovereign debt supply. Widening US fiscal deficits and elevated debt levels across the developed world are increasing the sheer volume of bonds that markets must absorb. When supply climbs, buyers gain pricing power, and they are exercising it.
- Quantitative tightening. As major central banks shrink their balance sheets, they remove a large, price-insensitive buyer from the market. The remaining investors are far more sensitive to duration risk, and they demand to be paid for it.
- Declining convenience value. Investors have historically paid a premium for the safety and liquidity of government bonds. As supply rises and the sense of scarcity fades, that premium is eroding, and yields rise to compensate.
The scale of the supply story US national debt has surpassed $40 trillion, a figure that anchors just how much sovereign paper the market is now being asked to hold.
Taken together, these forces tell you something important: the buyers who once absorbed long-duration sovereign debt at negative or near-zero term premia are no longer in the market in sufficient size. The market is now repricing to reflect who actually remains.
Each country’s domestic ignition point
Japan’s move is tied to Bank of Japan policy normalisation combined with hot producer price inflation. The BOJ’s short-term policy rate now sits at 1.0% following a June 2026 hike to its highest since 1995, while producer prices ran at 7.2% year-on-year in July 2026. Both give domestic bondholders reason to demand more, and the global structural backdrop amplifies that demand.
The United Kingdom’s gilt pressure reflects acute fiscal credibility concerns, heavy debt supply, and a difficult budget environment. That record 30-year gilt auction yield is the clearest marker of the credibility premium investors are now insisting upon.
Australia’s yields are climbing as the Reserve Bank of Australia reprices around domestic inflation worries, compounded by the country’s exposure as a key node in global supply chains. In a low-term-premium world, each of these local catalysts would have registered as a smaller shock. Against elevated global term premium, they land harder.
What a sustained high-term-premium environment does to markets beyond bonds
Term premium is not an abstract fixed-income curiosity. When it stays elevated, it restructures the risk and return calculus across your entire portfolio, and the assets you think of as “not bonds” reprice through the same mechanism.
Three transmission channels carry the effect outward:
- Equity valuations. Higher real long-term rates and a positive term premium raise the discount rate applied to future earnings, mechanically compressing forward price-to-earnings multiples. The effect concentrates in long-duration growth equities, such as NASDAQ-100 constituents, whose value depends most heavily on distant future cash flows.
- Credit and mortgage markets. A steeper yield curve driven by positive term premium feeds directly into higher term funding costs for banks, higher corporate bond rates, and elevated mortgage rates, slowing interest-rate-sensitive sectors.
- Emerging-market capital flows. Investors demand higher compensation to hold EM debt when US real rates are already high, widening EM credit spreads and raising the risk of capital outflow shocks. The IMF estimates a 5% probability that EM outflows could reach around 2.3% to 2.4% of GDP over the next year.
The discount-rate channel operates mechanically: the IMF estimates that a 100-basis-point increase in global long-term real rates lowers the equilibrium price-to-earnings ratio of advanced-economy indices by 10-15%, holding earnings constant, which explains why technology and other long-duration equity sectors reprice sharply even when underlying earnings are unchanged.
Institutional frameworks already embed this logic. The EU applies a risk-premium penalty to sovereigns with debt above 90% of GDP, formalising the idea that heavier debt loads warrant higher compensation.
| Channel | Mechanism | What it means for your portfolio |
|---|---|---|
| Equities | Higher discount rate compresses forward multiples | Long-duration growth holdings face the most pressure |
| Credit and mortgages | Steeper curve raises funding and borrowing costs | Rate-sensitive sectors and leveraged names slow |
| Emerging markets | Higher required EM compensation drives rebalancing | EM exposure carries elevated outflow and spread risk |
History offers three reference points, each with a key divergence from today:
- The 1994 Bond Massacre. Like now, yields moved synchronously across markets. But 1994 was triggered by unexpectedly rapid US policy rate hikes, pushing 10-year Treasury yields up 130 to 250 basis points. Today’s driver is supply and fiscal concern, not a short-rate surprise.
- The 2013 Taper Tantrum. A shift in expected central bank balance-sheet policy drove a sudden term premium spike. The current environment shares that sensitivity to balance-sheet communication, but sits atop far higher baseline debt.
- The 2023 Treasury Tantrum. The most direct analogue. Long yields spiked chiefly on term premium increases linked to quantitative tightening, larger issuance, and outlook uncertainty. The distinction now is that today’s debt levels and post-pandemic inflation uncertainty make the episode structurally different.
The read for you is this: term premium is the connective tissue linking bond yields, equity multiples, credit spreads, and EM risk appetite into one coherent framework. The current 70 to 80 basis point reading represents a materially different regime from the negative-to-near-zero environment that ran from 2015 through 2021.
What the term premium reset means for how you should read yield moves from here
Here is the shift in thinking to take away. When a yield rises, the direction alone tells you almost nothing. What matters is which component of the Bernanke decomposition is doing the work.
A term-premium-driven rise is structurally different from a rate-expectation-driven rise. The Federal Reserve itself has acknowledged that a high term premium could, in theory, allow a lower path for short-term policy rates, even as long yields climb. That is the opposite of what a rate-expectation-driven move would imply.
So when you next read a bond yield headline, ask three questions:
- Which component is moving: inflation expectations, real rates, or term premium?
- What direction are breakevens heading, contained or climbing?
- What are short-rate expectations doing at the same time?
Those three questions separate a reader who understands what a yield number means from one who simply knows which way it moved.
Frame the current environment as a regime shift, not a cyclical spike. The swing from negative 150 basis points to 70 to 80 basis points is a complete reversal of the post-GFC assumption that long-duration sovereign debt carries minimal compensation requirements. Reading that as structural rather than temporary shapes every duration and asset allocation decision you make from here.
The yield normalisation thesis holds that current levels are not unprecedented but rather a return to the pre-QE range that prevailed through the early-to-mid 2000s, a view supported by bid-to-cover ratios across four major sovereign markets that remain at or above ten-year averages, suggesting institutional buyers have not abandoned government debt.
This article is for informational purposes only and should not be considered financial advice. Investors should conduct their own research and consult with financial professionals before making investment decisions. Past performance does not guarantee future results, and financial projections are subject to market conditions and various risk factors.